by Siddharth Singh Bhaisora
Published On June 15, 2025
Large drawdowns – sharp declines from a stock’s peak to trough – are an inevitable part of long-term investing. Even the most successful stocks and investors experience significant drawdowns, which can be considered “the cost of doing business” over the long haul.
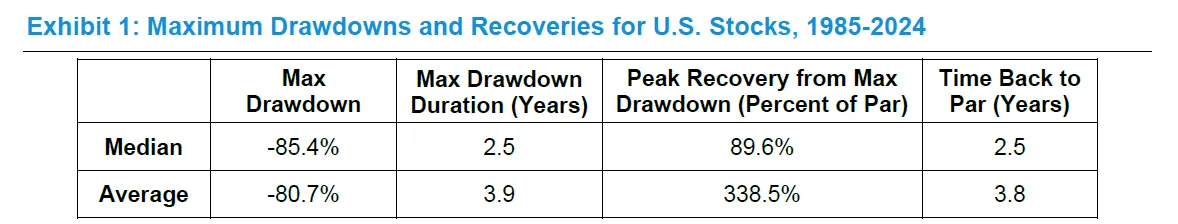
The typical stock’s worst decline is very severe. The median US stock saw an –85% maximum drawdown, taking 2.5 years from the peak to the trough. The average drawdown (–81%) is slightly less severe, but that average is skewed by some truly spectacular collapses (many stocks went essentially to zero). Likewise, the average rebound was +338% (to 3.4× the prior peak), but this is misleading – it reflects a few huge success stories that wildly overshot their old highs, whereas 54% of stocks never reached their prior peak again. In fact, the median recovery topped out at only ~90% of the previous high, meaning most never quite got back to “even”.
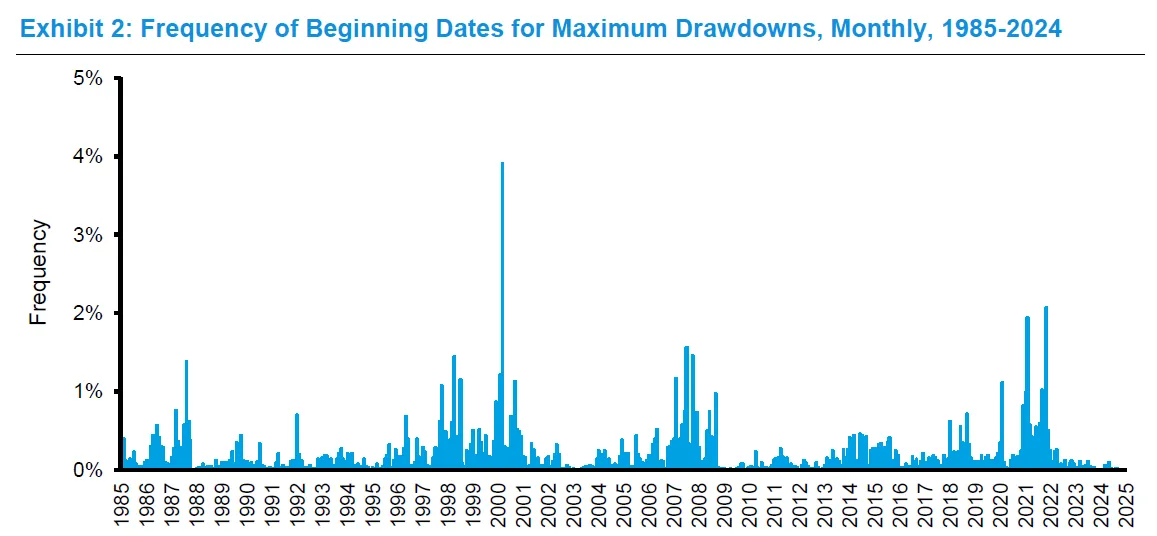
Data shows that big drawdowns are much more common than small ones. Amazingly, nearly 1/3rd of all stocks had a 95–100% collapse at some point (essentially flatlined or went bankrupt). On the other end, only a small minority avoided any major drawdown (>50%). Most stocks experience some large slump in their lifetime. And the magnitude of the drop tends to correlate with the duration: the worst 95–100% drawdowns lasted ~6–7 years on average from peak to bottom, whereas milder <50% drawdowns typically bottomed in about 1 year. Recoveries, if they happen, also take far longer for massive drawdowns (on average ~8 years to get back to prior peak after a 95%+ crash) than for smaller ones (~1.5 years after a sub–50% drop).
Steeper the fall, the bleaker the odds of ever clawing back. Historical base rates show roughly 80% of stocks that fell less than 50% did eventually recover to their old high. But once a stock plunges 80% or more, the majority never fully recover. In the worst category (–95% to –100%), only ~16% of stocks (≈1 in 6) ever saw their price back at the previous peak. The stark takeaway: while any stock can crash, deep collapses are often permanent for most companies. Surviving and prospering after a 90% collapse is the exception, not the norm.
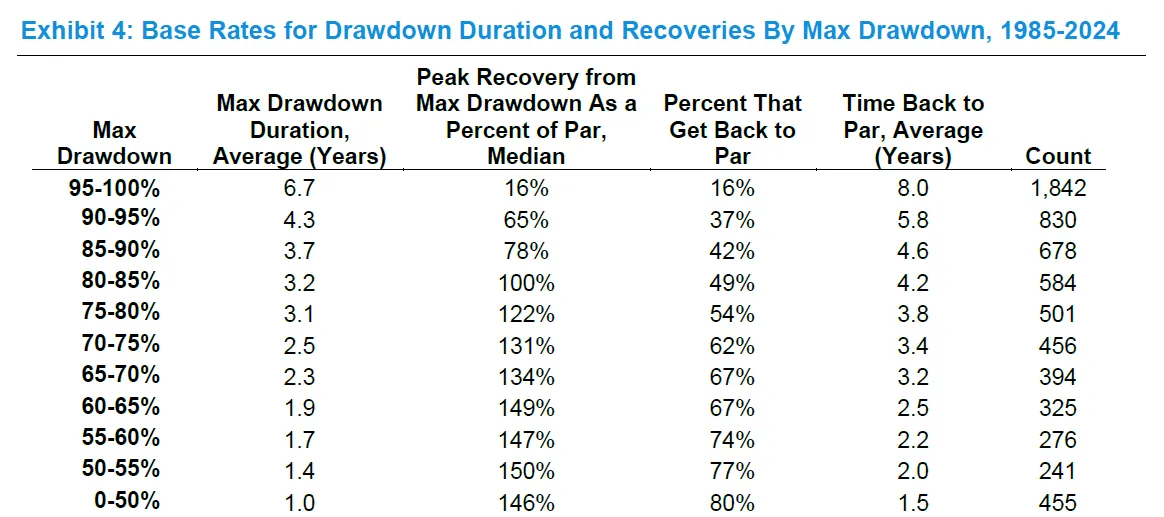
Survivors of large drawdowns often produce huge gains off the bottom (even if they don’t reach the old peak). For example, among stocks that fell ~75–80%, the median rebound carried them to about 122% of their prior high – which means a hypothetical investor who bought at the bottom could quintuple their money. Even in the near-total loss category (–95%+), the median stock that did rebound reached only ~16% of its former peak – but that still equates to a +540% gain from the bottom.
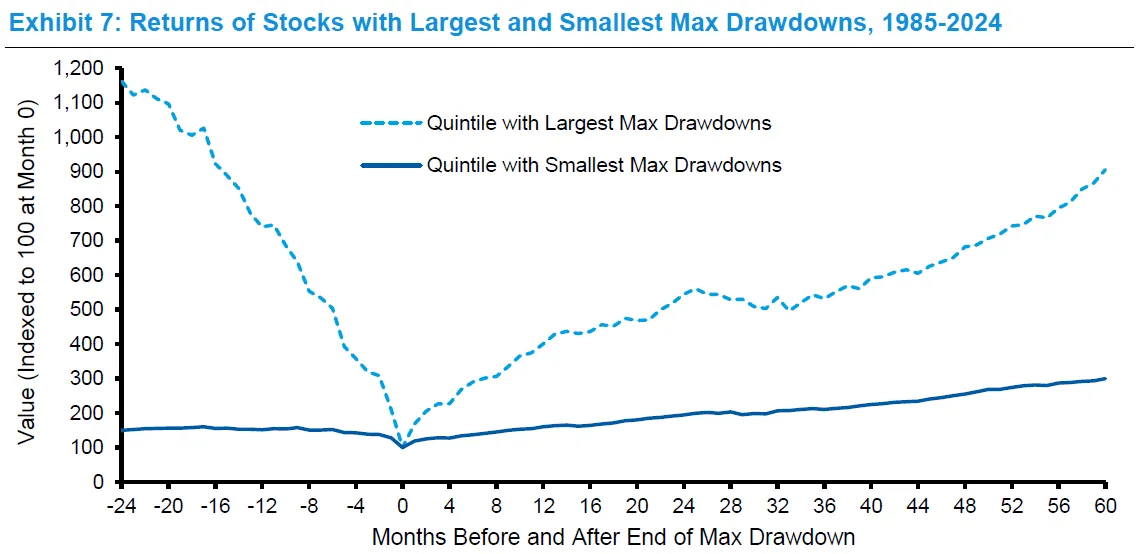
The worst collapses, if not fatal, can generate outsized multi-year returns going forward. In fact, looking at median 5-year performance after the trough, stocks in the deepest drawdown group (–95%+) delivered about +55%/year, roughly twice the +25–30%/year median for stocks in the mildest drawdown group. This pattern reflects a classic high-risk/high-reward scenario – big crashes sometimes precede big recoveries, but many crashed stocks never recover at all (hence the survivors’ average is pulled up by a few spectacular turnarounds). In short, enduring occasional deep declines was part of the journey to exceptional long-term performance.
What happens to stocks after they suffer large price drops? Do markets overreact to news? Do “loser” stocks subsequently outperform “winner” stocks?
Pioneering work by Werner De Bondt and Richard Thaler in 1985 found exactly that: stocks that had very poor returns over a 3 year period went on to do better in the next 3 years than those that had been big winners. This was dubbed the overreaction hypothesis, suggesting that investors often push prices too far in both directions. Excessive pessimism drives loser stocks below their intrinsic value, setting the stage for above-average future returns as the mispricing corrects.
A more recent study replicated the loser vs winner effect and found that, while the portfolio of past losers did outperform on average, the median loser-stock actually continued to underperform. In other words, the big returns to the “loser portfolio” were driven by a few huge turnarounds – many of the loser stocks remained losers (or even went bankrupt).
This aligns with our earlier observation of skewed averages: a small number of miraculous recoveries can pull up the average, even though most beaten-down stocks don’t fully recover. So while there is truth to the idea that the market overreacts and some stocks rebound strongly, it’s hard to predict which ones will be the big winners.
Another relevant finding comes from Hendrik Bessembinder’s research on long-run stock returns. He showed that the majority of net wealth creation in the stock market comes from a tiny fraction of stocks – and those superstar stocks often went through gut-wrenching declines along the way. In fact, the shareholders who achieved the greatest long-term gains “endured large price declines over shorter intervals,” as Bessembinder notes.
He also found the top-performing companies of each decade tended to have suffered larger drawdowns in the prior decade than an average company. In short, huge long-term winners like Amazon or Apple often had periods where they were deeply out of favor. This provides some comfort to those holding a quality company that’s down big – many eventual success stories spend years in the wilderness before triumphing.
What about investor behavior during drawdowns?
Interestingly, studies of retail investor behavior find that individuals are more likely to buy more of a stock that has fallen than one that has risen. Psychologically, this “averaging down” is appealing because it lowers one’s average cost basis and makes the eventual recovery (if it happens) less of a climb. It also perhaps feels like a bargain-hunting strategy. This behavior may be driven by loss aversion – by adding to a losing position, investors hope to break even faster, reducing the pain of loss. However, the research found that averaging down did not improve those investors’ results on average. Often, buying more of a troubled stock just compounded the losses.
The difficulty is knowing whether a fallen stock is truly a bargain or a value trap. Academic evidence suggests caution: while some legendary investors have made fortunes doubling down on convictions during drawdowns, many others have gone broke doing the same on the wrong stocks. The overreaction effect implies some beaten-down stocks will bounce back spectacularly – but identifying which ones have merely overshot to the downside, versus those that are fundamentally impaired, is the real challenge.
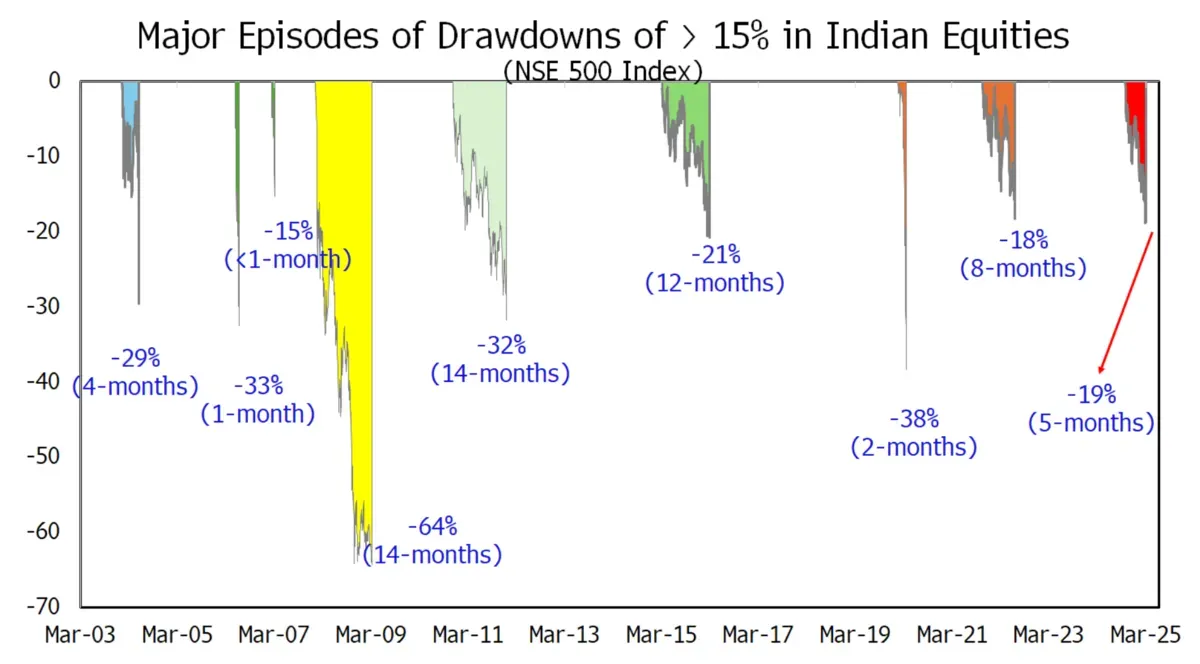
India’s equity market fell sharply in February & March 2025. February marked a significant milestone, registering the longest losing streak for the Nifty 50 index in 2 decades. Every year, investors witness temporary market corrections—declines ranging from 10% to 20%—yet many investors are tempted to wait for these corrections before investing new funds. On the surface, waiting for a 10% market dip appears intuitive. Here are some of the major drawdown episodes the Indian market has seen in earlier this year.
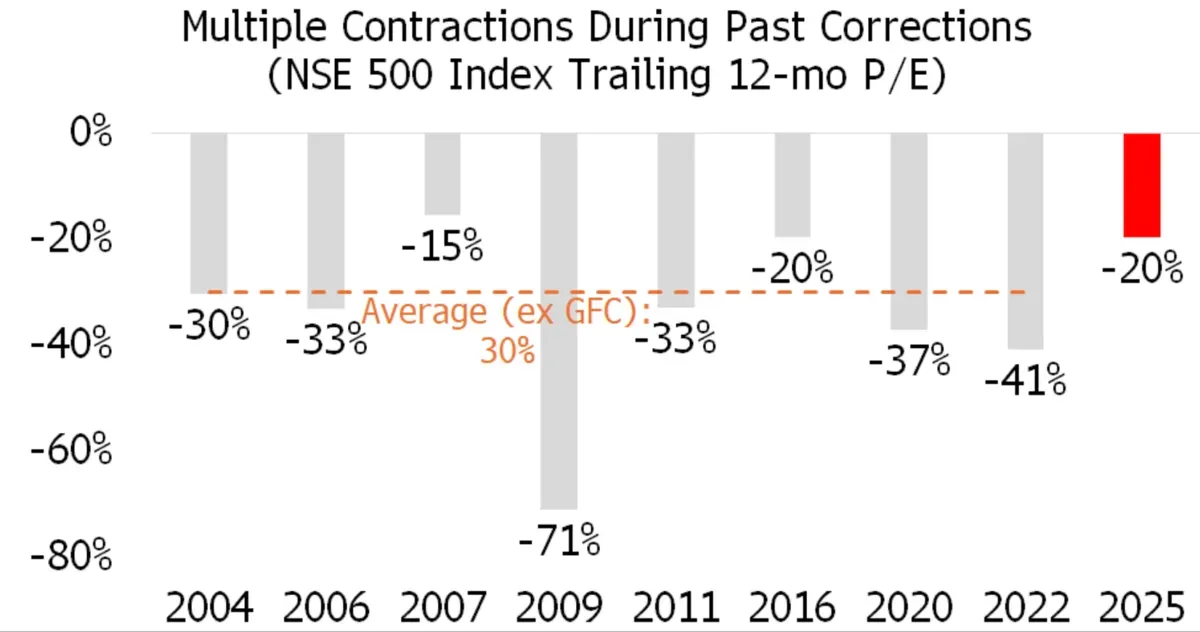
Historically, market downturns in India have led to valuation contractions averaging around 30%, whereas the current cycle has only seen valuations fall by roughly 20%.
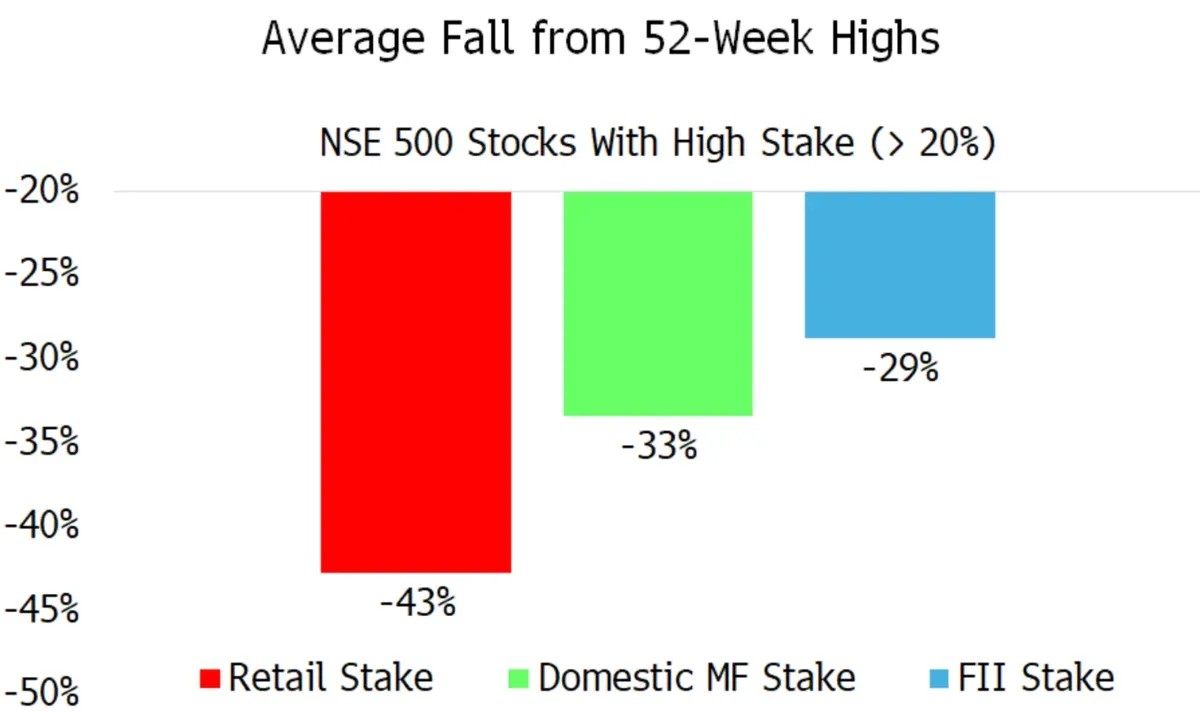
 Additionally, the selloff appears particularly acute for stocks favored by retail investors, underlining the vulnerability of this segment.
The first challenge is evident when markets continue rising rather than correcting. If an investor waits for a 10% drop but markets climb higher, the required correction becomes increasingly steep. For instance, an investor aiming to enter when Sensex falls from 75,000 to 67,500 (a 10% drop) would later need a 20% correction if the Sensex rises to 85,000. This demonstrates how waiting can lead to unrealistic re-entry expectations.
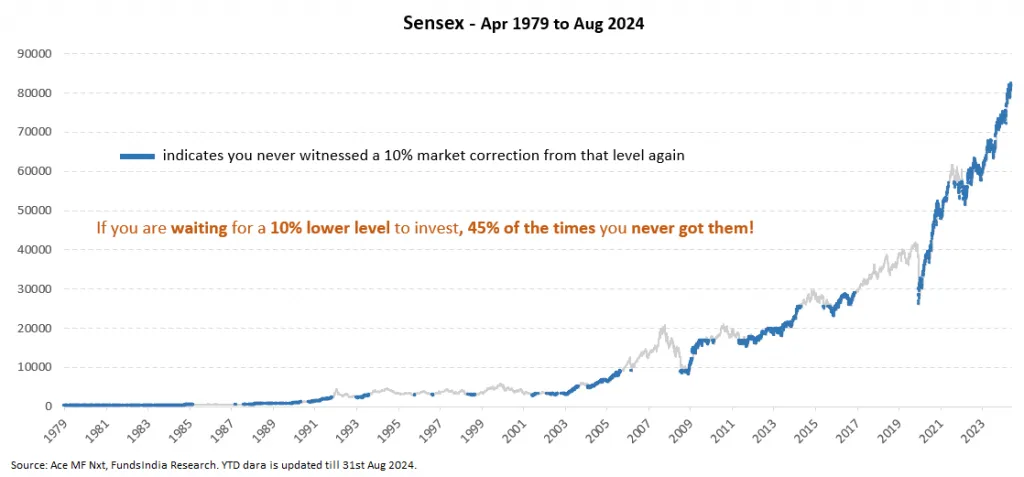
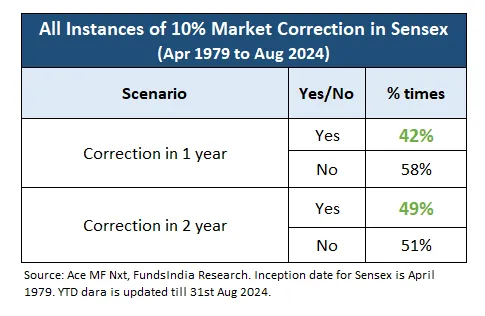
The second challenge is statistical probability. Historical data reveals that, astonishingly, 45% of the time markets never corrected 10% from a given point. While corrections do frequently occur, they don’t always happen from the initial entry point investors anticipate. Hence, waiting might mean missing significant market movements entirely.
The third challenge is the cost of waiting. Historical analysis shows that about half the time, markets correct 10% within one to two years. However, if a correction does not occur within this period, investors risk losing substantial returns. Data suggests investors can miss average market gains of 33% to 60%, and in extreme cases, even returns of up to 475%.
The fourth challenge addresses psychological behavior. If a market continues to rise, investors find it difficult emotionally to re-enter at higher prices. Admitting an initial decision was wrong or realizing missed gains can create significant psychological barriers, potentially leading to prolonged underinvestment.
For long-term investors, drawdowns are a fact of life. Knowing this, you can better steel yourself for the inevitable volatility and avoid panic when it occurs. Charlie Munger’s admonition rings true: if you can’t endure a 50% drop a few times in your investing lifetime, you’re likely to end up with mediocre results. The ability to remain calm and logical during gut-wrenching declines is part of what separates successful long-term investors from the rest.
At the same time, not every fallen stock will rise again. More than half of stocks never revisit their peak after a major drawdown. Discerning the exceptions – the roughly 1/3rd of big losers that do recover or even excel – is the hard part. The evidence suggests that these winners tend to be companies with enduring strengths that hit a rough patch, rather than those in terminal decline. They often have the financial resilience and management savvy to navigate the storm, and they emerge into favorable cyclical turnarounds or new growth opportunities.
For retail investors, the key implications are:
Don’t be surprised by large drawdowns. Even a well-diversified equity portfolio (like an index fund) can halve in value during a bad market. Individual stocks can do far worse. Build a portfolio that matches your risk tolerance beforehand, so you aren’t forced to sell at the worst time.
Since it’s very hard to tell which stocks will recover from drawdowns, avoid over-concentration in any single stock or sector. Diversification increases the odds that the painful losers are offset by other holdings.
Market overreactions can create opportunities – some beaten-down stocks are undervalued and poised for a comeback. But do your due diligence. It’s often wiser to average down on high-conviction, high-quality businesses than to gamble on a structurally broken company.
If you decide to invest in a turnaround situation, be patient. The data shows recoveries, when they happen, often play out over years, not months. Avoid checking the stock obsessively; instead, monitor the business fundamentals. Conversely, if you realize a company’s thesis has broken, don’t hold on just hoping to get back to even – redeploy that capital into stronger opportunities.
In summary, drawdowns and recoveries are two sides of the same coin in equity investing. Maintaining a disciplined long-term approach, rather than getting swept up in fear or euphoria, will ensure that you are still in the game when the recovery (whether in a given stock or in the broader market) eventually comes. As history shows, those who ride out the storms with the right boats and the right mindset are ultimately rewarded when the skies clear.
Discover investment portfolios that are designed for maximum returns at low risk.
Learn how we choose the right asset mix for your risk profile across all market conditions.
Get weekly market insights and facts right in your inbox

It depicts the actual and verifiable returns generated by the portfolios of SEBI registered entities. Live performance does not include any backtested data or claim and does not guarantee future returns.
By proceeding, you understand that investments are subjected to market risks and agree that returns shown on the platform were not used as an advertisement or promotion to influence your investment decisions.
"I was drawn to Wright Research due to its multi-factor approach. Their Balanced MFT is an excellent product."

By Prashant Sharma
CTO, Zydus
By signing up, you agree to our Terms and Privacy Policy
"I was drawn to Wright Research due to its multi-factor approach. Their Balanced MFT is an excellent product."
By Prashant Sharma
CTO, Zydus
Skip Password
By signing up, you agree to our Terms and Privacy Policy
"I was drawn to Wright Research due to its multi-factor approach. Their Balanced MFT is an excellent product."
By Prashant Sharma
CTO, Zydus
"I was drawn to Wright Research due to its multi-factor approach. Their Balanced MFT is an excellent product."
By Prashant Sharma
CTO, Zydus
Log in with Password →
By logging in, you agree to our Terms and Privacy Policy
"I was drawn to Wright Research due to its multi-factor approach. Their Balanced MFT is an excellent product."
By Prashant Sharma
CTO, Zydus
Log in with OTP →
By logging in, you agree to our Terms and Privacy Policy
"I was drawn to Wright Research due to its multi-factor approach. Their Balanced MFT is an excellent product."
By Prashant Sharma
CTO, Zydus
Answer these questions to get a personalized portfolio or skip to see trending portfolios.
Answer these questions to get a personalized portfolio or skip to see trending portfolios.
(You can choose multiple options)
Answer these questions to get a personalized portfolio or skip to see trending portfolios.
Answer these questions to get a personalized portfolio or skip to see trending portfolios.
Answer these questions to get a personalized portfolio or skip to see trending portfolios.
(You can choose multiple options)
Investor Profile Score
We've tailored Portfolio Management services for your profile.
View Recommended Portfolios Restart


