

We completed 3 years of Wright PMS on 18th August.
Three years is enough time to be right, to be badly wrong, and to find out which one you learn more from. We compounded at 20.3% against the market's 11.1%. We also gave back most of two years of that lead in about two months, and the models had nothing to do with it.
I have learnt more as a quant manager in these three years than in the decade before them. This post is what those years actually taught me about conviction, about process, about what to say to investors, and about the difference between running a model and trusting one. With the numbers behind all of it, including the ones I would rather not show you.
The strategy has been through a full cycle. It splits into four phases, each teaching a different thing.
■ Thirteen months of growth. We returned 79.9% against the market's 43.8%, and I concluded I was rather good at this.
■ Six months of risk-off. We fell 20.9% against 12.6%, and I intervened.
■ Nine months of rebuilding. The models worked and we still lagged.
■ Eight months of recovery. Up 14.2% against a market that is down 2.2%.
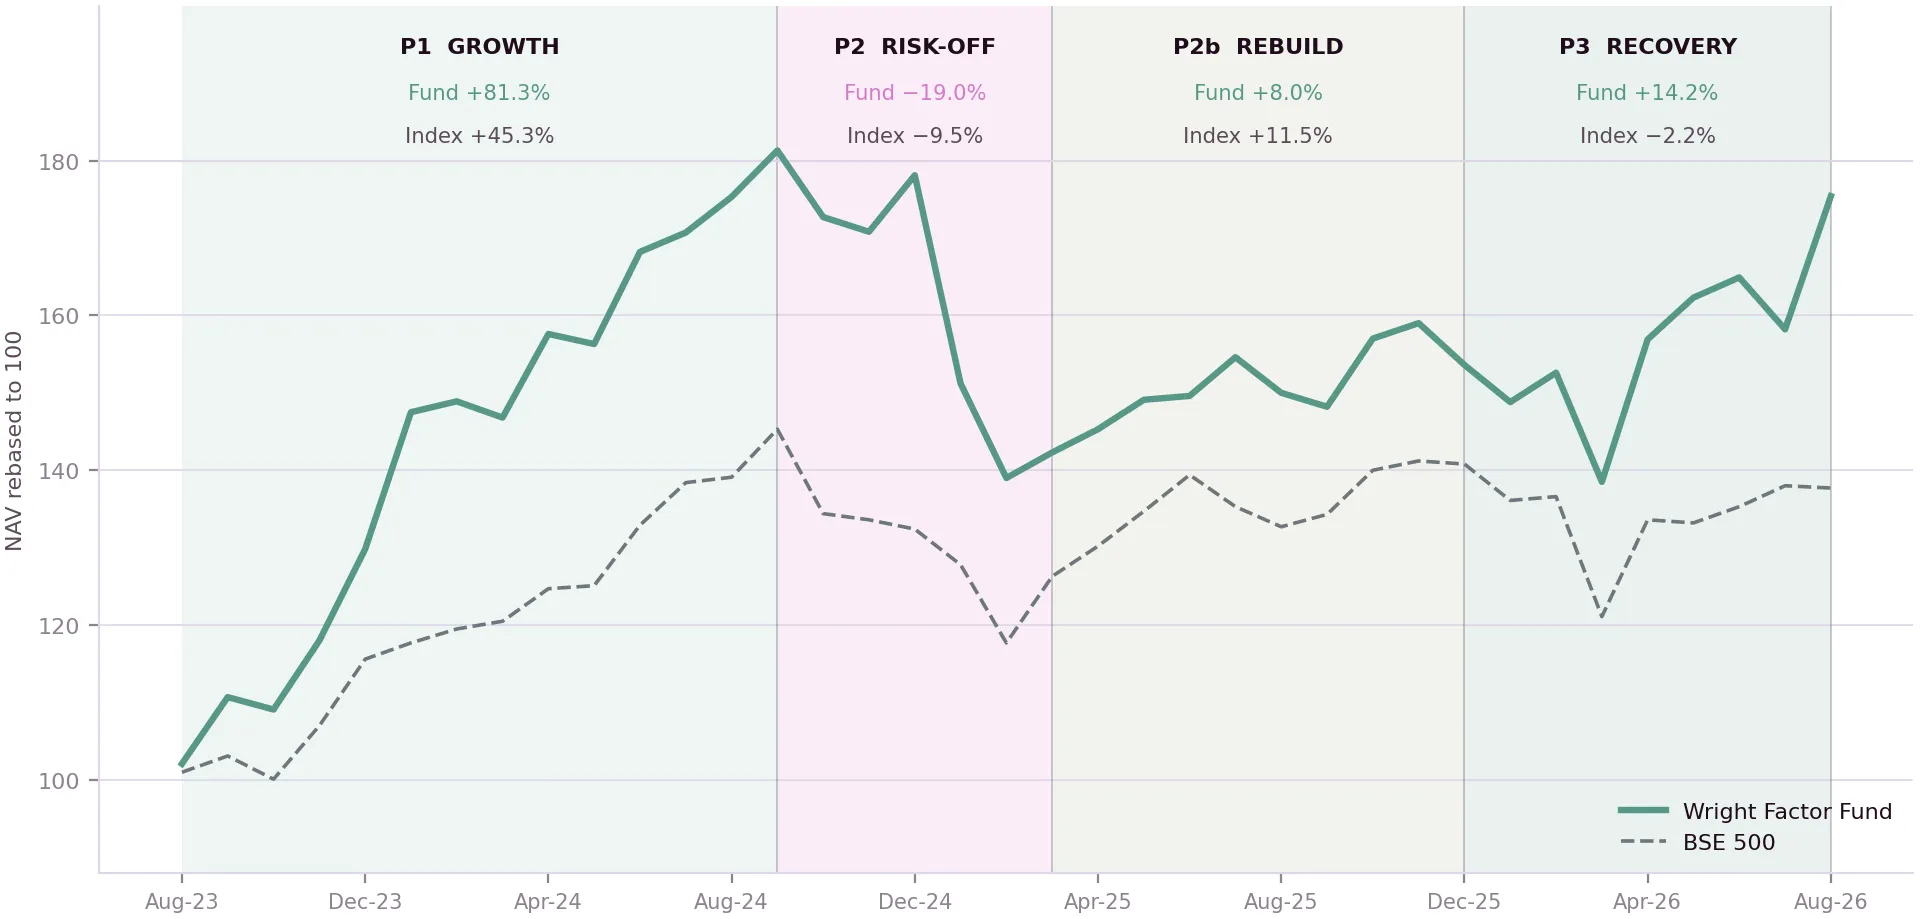
The journey in four phases. Fund and index returns are cumulative published NAV over each period.
PHASE | FUND | NIFTY 500 | ALPHA P.A. |
|---|---|---|---|
P1 growth | +81.3% | +45.3% | +30.6% |
P2 risk-off | −19.0% | −9.5% | −16.7% |
P2b rebuild | +8.0% | +11.5% | −4.8% |
P3 recovery | +14.2% | −2.2% | +25.3% |
Since inception | +75.0% | +37.7% | +9.2% |
Phase 1 · Aug 2023 – Sep 2024 · Fund +81.3% vs index +45.3%
We started unsure. We didn't know how it would go
I remember sitting with the website, the strategy and the portfolio alone, biding time, not sure when to start.
And one day I sat alone, finalised the collateral, shot an intro video, and put it out to the world.
We got early success. Clients kept coming at a steady pace, and honestly I could not always tell you where from. We were in top 10 lists almost every month in the first 1–1.5 years, and grew from 0 to 300 crore.
And I kept tom-toming performance and growth. Clients thought we could do no wrong, and I rode that high.
But now I cringe at those posts.
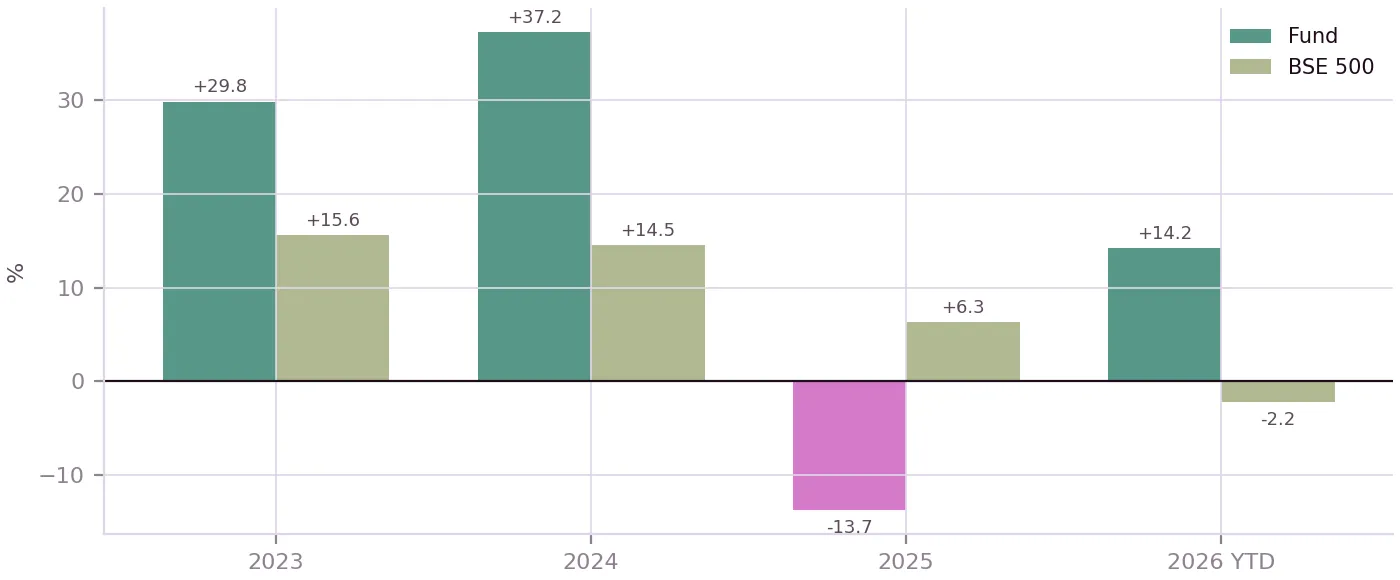
Calendar year returns · fund vs BSE 500. 2023 from 18 August. 2026 to 27 August.
Phase 2 · Sep 2024 – Mar 2025 · Fund −19.0% vs index −9.5%
Then came the moment that flipped everything
In January 2025, after DJT's election victory, Indian markets saw panicked selling in mid and small caps. Ever competitive for the top 10 slot, we were allocated in the growth names, which got battered.
In that one month we fell 15.1% against the index's 3.5%. Eleven points of underperformance in thirty-one days.
And because we had gone from 0 to 300 crore in a year, a big chunk of our clients had joined right at the top of the cycle, with no earlier gains to cushion them. When the correction came they got shaken, and so did I.
Then I made it considerably worse
The order of what happened next is the whole lesson, so let me be exact about it.
1. We kept buying into the early part of the correction. That was the right call, and it was the models' call.
2. Then the client queries got louder, and I sold. A whole lot of small and midcaps, down to more than 25% cash, and aggressively hedged with midcap index options. The worst possible thing you can do in a correction. SELL.
3. The direction was right. The timing was not. The market did tank after DJT announced his tariffs. But I hedged using March midcap options, expecting the market to react before the announcements, and markets stayed irrationally high through March. The hedges expired worthless.
4. And we did not roll them. Clients were understandably angry about hedges eroding equity profits in a month when equities had gone up.
So by April we had the worst of both: the good stocks gone, sold near the bottom, and the protection we had paid for expired. Our drawdown reached 27.3% against the index's 19.0%.
And I learnt with experience that that is a cardinal sin.
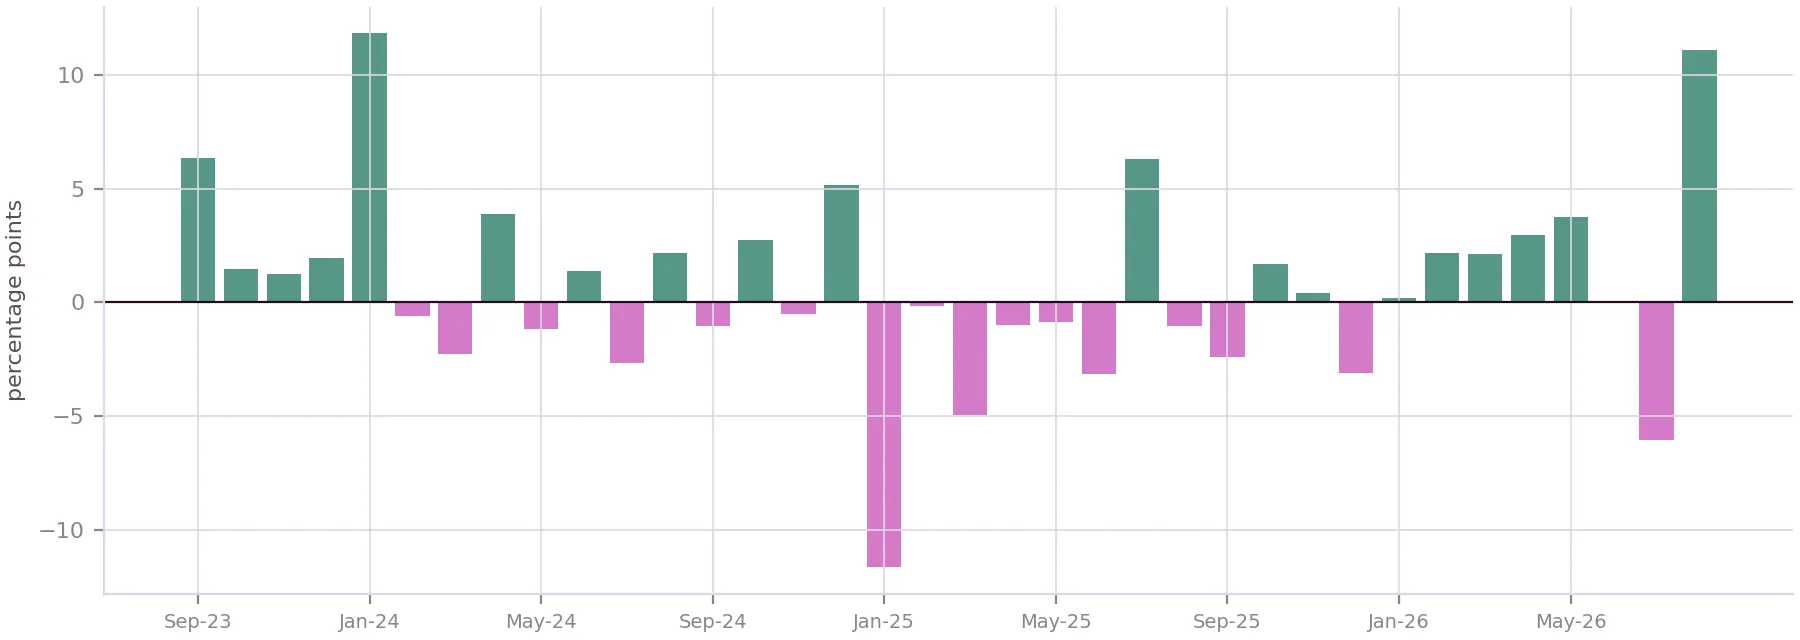
Monthly outperformance vs BSE 500 · percentage points. Every month of the fund's life. The two deepest bars are January and March 2025.
Phase 2b · Mar – Dec 2025 · Fund +8.0% vs index +11.5%
What it cost
Calendar 2025 finished at −13.7% against +6.3%, twenty points in one year. Spoilt by the bull market, we thought this shall pass, and shall pass quickly. But that did not happen!
Over the two years to August 2026 we returned nothing at all, and the index returned −0.5%. Two years of work for half a point a year. Whatever we built in year one, the intervention very nearly gave all of back.
All through it our strategies stayed robust against their benchmarks, doing their job while I overruled them.
Phase 3 · Dec 2025 – Aug 2026 · Fund +14.2% vs index −2.2%
But then we shone through in 2026
2026 has been great. We have outperformed 7 of 8 months, are ahead by 13.1 points year on year, and are ending the 3 years up 10.8% in August against a market that fell.
What matters more than the headline is where it came from. Sixteen points of alpha in eight months, in a market that is down. This is the models being left alone to work.
See what markets are pricing in
Live indices, sector moves and market breadth — the backdrop to every story we publish.
The five lessons
Three years produced five things worth writing down. The first two are about the product; the last two are about running the business that sits around it.
1 / Corrections are the worst time to sell good stocks, and the best time to hold conviction
One thing we've always done is have the right set of stocks. Our strategy is capable of filtering and allocating to where we have conviction.
I can show you that rather than assert it. MTAR Technologies, picked in January 2026, is up 192% and has contributed 7.5 of this year's 16.5 points on its own. Across 234 closed positions we win 22.5% when we are right and lose 10.9% when we are wrong.
The worst thing that we did in 2025 was to sell some stock at the bottom, be hedged, and not buy them back before they ran up. Essentially that's what went wrong, and that's been a huge lesson for me.
In four months I closed 31 positions, 88% of the book by weight. Twenty-five of them at a loss, at an average of −15.6%.
I should be precise about what that did and did not cost. Measured against the index over the twelve months after each exit, most of those sales were fine. Aurionpro went on to lag the market by 46 points, Kaynes by 45, Jindal Saw by 44. The strategy was right to step away from those.
But one day was not fine at all.
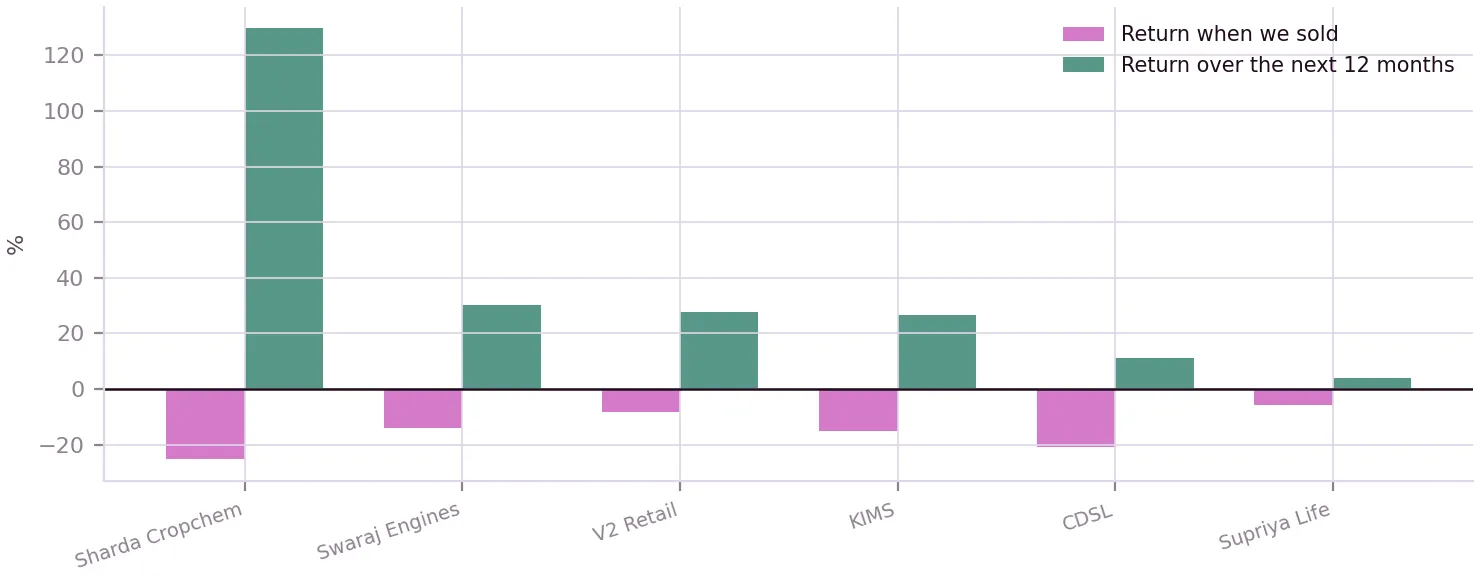
17 February 2025 · six positions closed in one day. Our return at exit, against the following twelve months. Those six beat the index by an average of 25 points after we let them go.
On 17 February 2025 we closed six positions in one day, 13.7% of the book, at an average loss of 14.8%. Over the next twelve months they averaged +38.3%, beating the index by 25 points.
It has been tested since. In July our strategies corrected 4% when the market was up 2%. Clients asked what was happening. But the models were very loudly telling us we were holding good stock, so we never sold them. In August we are up 10.8%. The market is down.
And that is so, so, so powerful.
And Welspun Corp? The process bought it back on 5 May 2026. It is up 89.3% since. The strategy was right about it the first time and right the second time. The only thing that changed in between was whether I let it work.
2 / The power of systematic investing is in trusting the process, not merely running it
Our systematic investing, when you really respect it, can be blinding.
We've been running Wright Research since 2019, but until the last two years we had only seen strong markets. Drudgery is where you find out what your process is worth.
When the dip came in early 2025, instead of trusting the hypothesis our own models had produced, I started calling brokers to find out what we were missing. The whole error, in one sentence.
What I have done since is work on the process. I've worked hard for clients, but the hardest I have worked is for myself, until I can say exactly why we hold every position, as clear as day. That removes the urge to go canvassing opinions the moment things get uncomfortable.
But I want to be careful here, because there is a version of this lesson the data does not support.
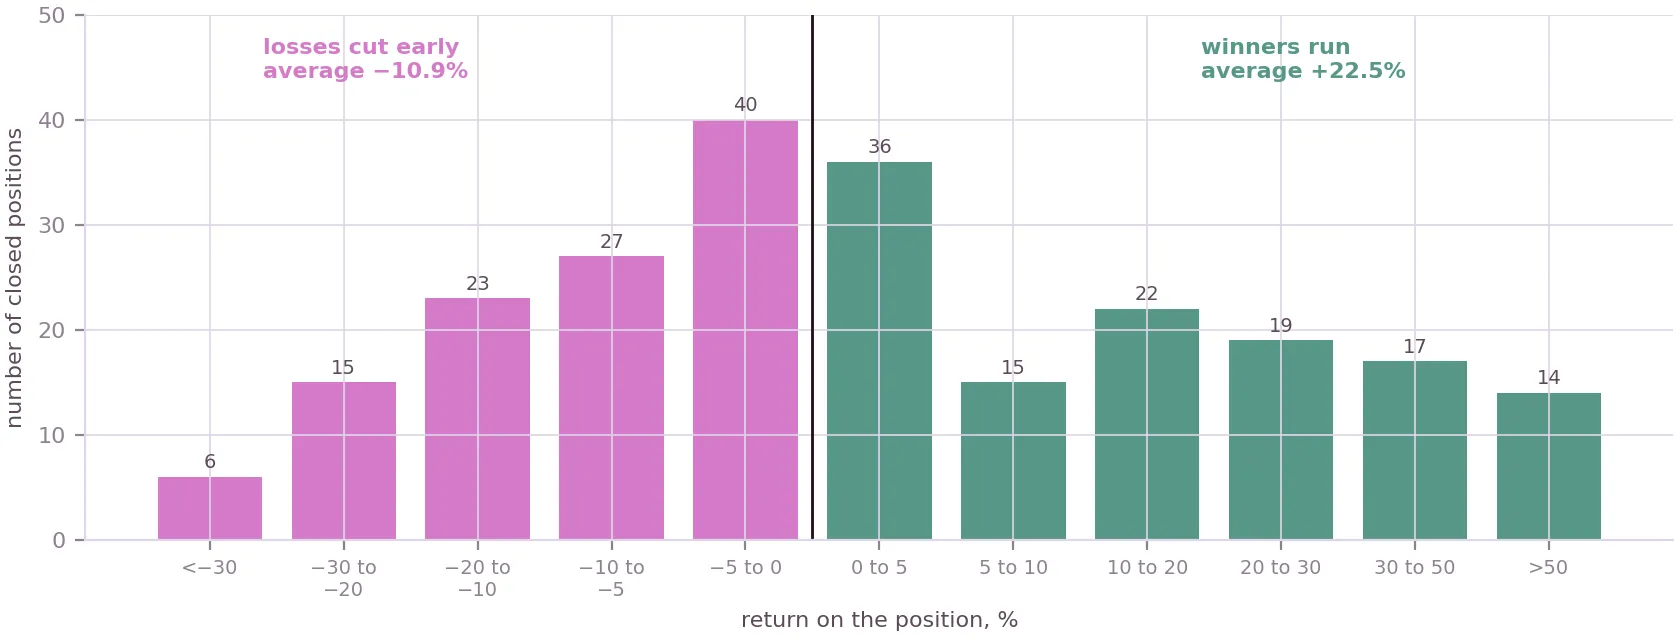
Every closed position, by outcome · 234 trades. The shape is the whole argument: a wall of small losses, and a long tail of winners.
Our turnover has not fallen. Median holding period is 78 days, and 55% of closed positions are held under ninety days. If I said the lesson was that we now trade less, the numbers would call me a liar.
The lesson is different. The trading is now the model's, not my nerves'. When the process says rotate, we rotate; when it says hold through a drawdown, we hold, which is exactly what July was. That asymmetry is what makes the churn a feature and not a symptom.
The question is not how often you trade. It is whether the trade came from the data or from the discomfort.
This is what the real power of quant investing is, especially when things are looking scary. Your model gives you that guidance and you trust it, because panicking when your money is going down is very easy for everybody. And human emotion is just as biased when you are super confident as when you are panicking. A fund manager's experience can be super powerful, but it should not be the only thing in the room.
2.5 / Tom-tomming performance is naive
My marketing strategy, since we started the PMS, was only talking about performance, retweeting whenever we were in the top ten. But obviously things will not work perfectly every time.
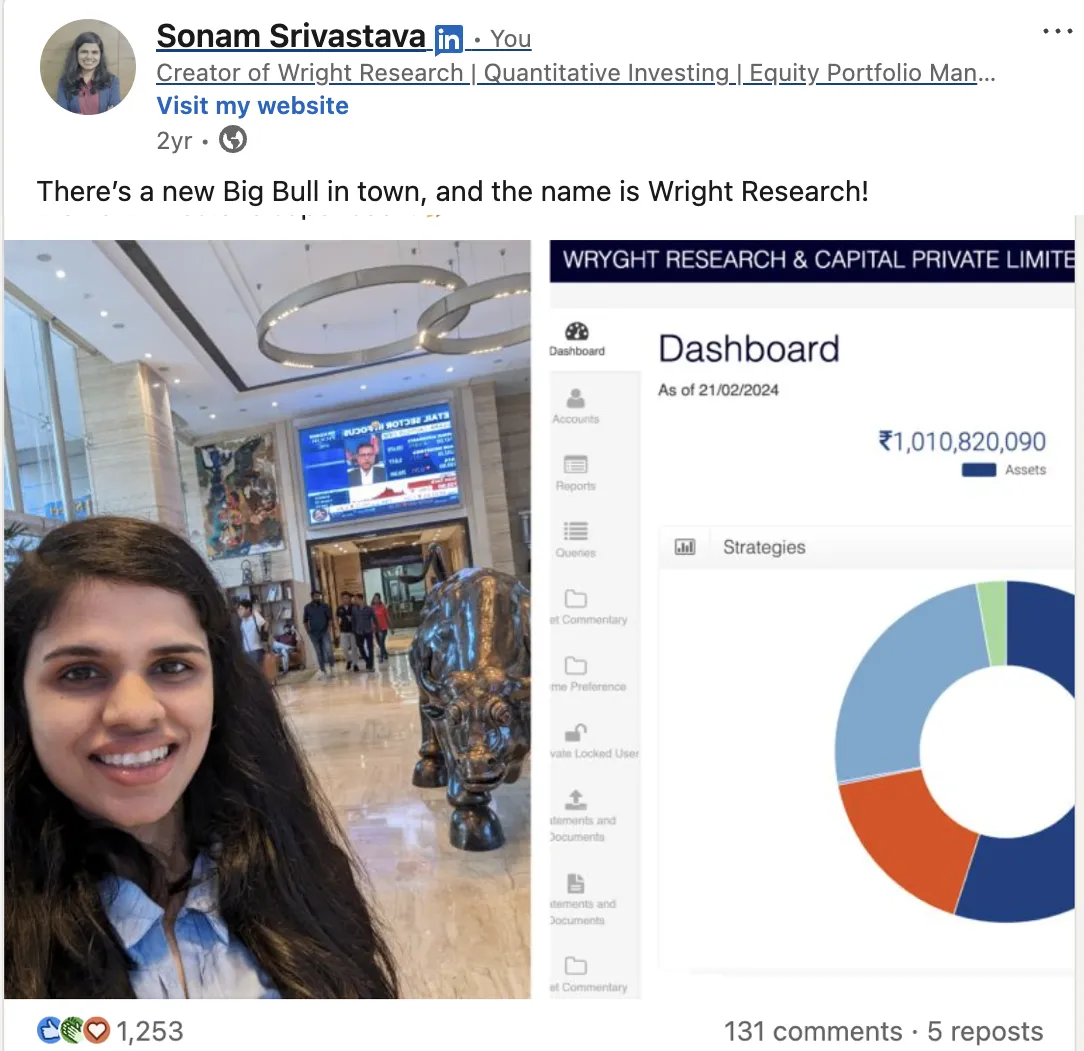
February 2024. This is the post I mean. 1,253 reactions.
Quant investing is statistical. Across three years we have beaten the index in 59% of months; this year, 88%. Neither is 100%, and neither is meant to be. The months we lose are not a flaw in the design. They are the design.
If your whole strategy is tom-toming the performance, that's just stupid. You set the wrong expectation, and create a narrative about yourself, the manager who can never be wrong, that the next drawdown dismantles for you in public. Which is exactly what happened to us.
In 2025 I used to apologise to investors and set a timeline: recovery by roughly here, or roughly then. Which is just not correct. Now we pass on the conviction instead. If people have trusted us with their money, they are owed the research, not a scoreboard.
3 / Investor relations are powerful but transitory
I got addicted to that first year of good performance, and to everybody treating me like the best person in their life because I was making them money.
Go back three years and look at my posts. I remember them. Such amazing people from all walks of life are trusting us, and wow, look at us.
People invest in a strategy because they expect it to make money. That is all it is. They don't come to Sonam because Sonam talks very nicely or does very good maths. They come because they think we will grow their money better, and if we don't, they will leave. Which is just right.
Building a thick skin around it is very important. Not those misguided views in your head that this wonderful person has chosen to trust you, so they're so powerful. No. They've invested in your strategy to make money.
The other thing is the noise. Investors don't want the very smart relationship managers in our team, they want to talk to me, and especially when things are bad, you hear a lot that can guide your judgment. The answer is the same thick skin. I appreciate talking to people when they come to me. But that should not influence the process at all.
4 / A well-aligned team makes the process enriching; the wrong people can ruin it
All of this happened while running a team. With a well-aligned team you can prioritise what matters, because responsible people own real chunks of the work: relationships, operations, trading, research.
Hire the wrong people, and you are left firefighting, or literally fighting your employees. I would not say there is anything wrong with them; they were wrong for that role. Which is extremely bad in a bad situation.
Getting the right people, rewarding the ones who contribute, giving them responsibility and scope to make mistakes, and advocating for them in front of an angry client when they've done nothing wrong. All of it matters enormously. You need the right incentives, and people with the right motives.
Performance to 31st August 2026
PERIOD | FUND | BSE 500 | ALPHA |
|---|---|---|---|
1 month | 10.8% | −0.2% | +11.1 |
3 months | 8.0% | 3.4% | +4.7 |
6 months | 14.9% | 0.8% | +14.1 |
1 year | 16.9% | 3.8% | +13.1 |
2 years | 0.0% | −0.5% | +0.5 |
3 years | 19.8% | 10.9% | +8.9 |
Since inception | 20.3% | 11.1% | +9.2 |
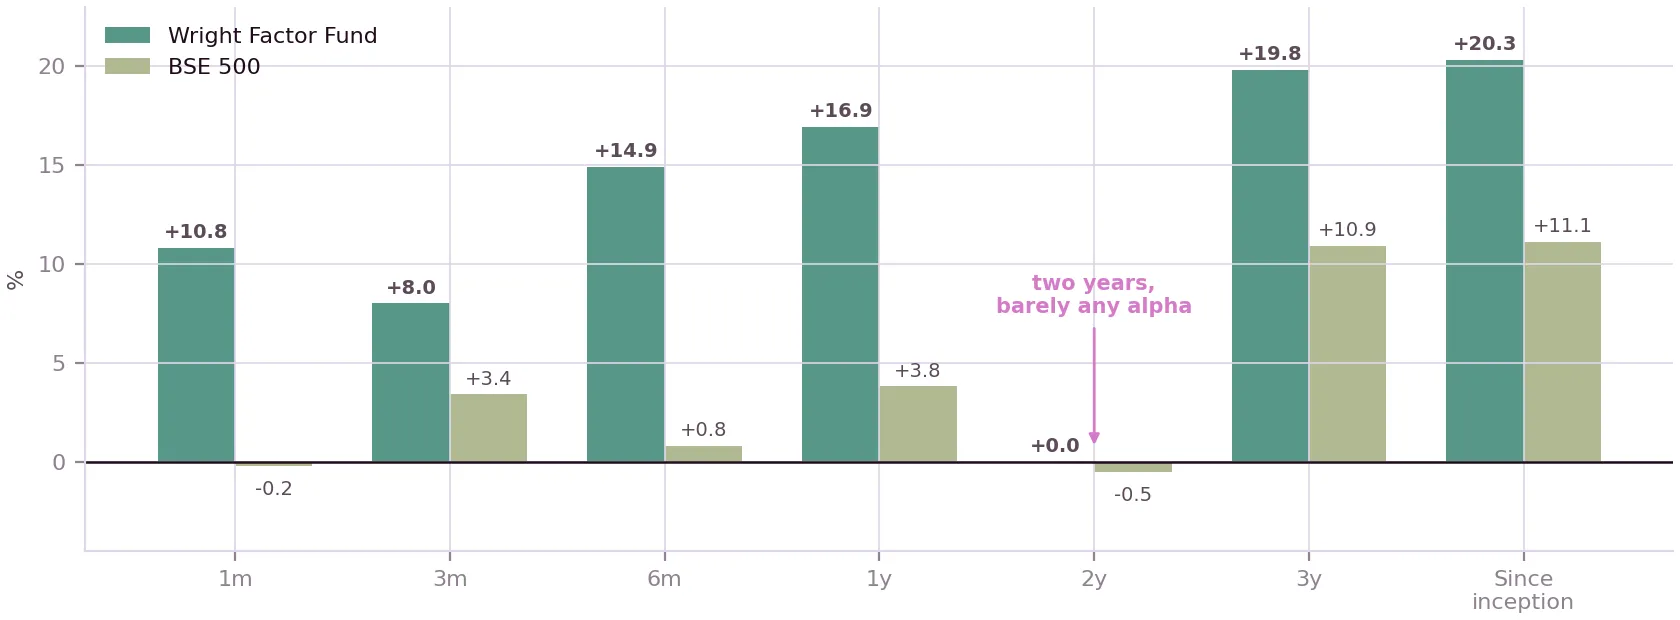
Fund vs BSE 500 by period · %.
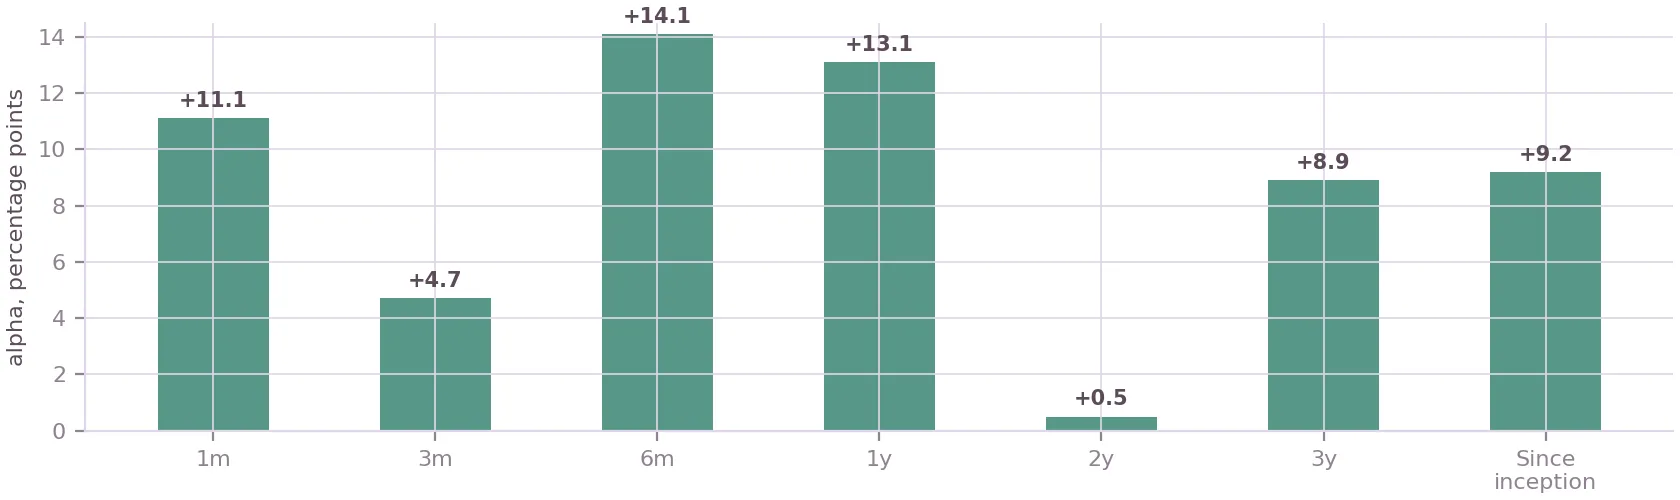
Alpha by period · percentage points. Every window is positive except the two-year, which is the one that matters most right now.
Risk: annualised volatility 16.4% against the index's 11.7%, beta 1.10, tracking error 10.2%, information ratio 0.59.
The two-year number is the one I would look at first. It is the honest price of the 2025 intervention, and it will take another good year to work off.
Positioning
Twenty-six holdings, and a very different book from the one we ran into the correction: in December 2024 we held 37% in Financial Services and 16% in Industrials. Those weights have effectively swapped.
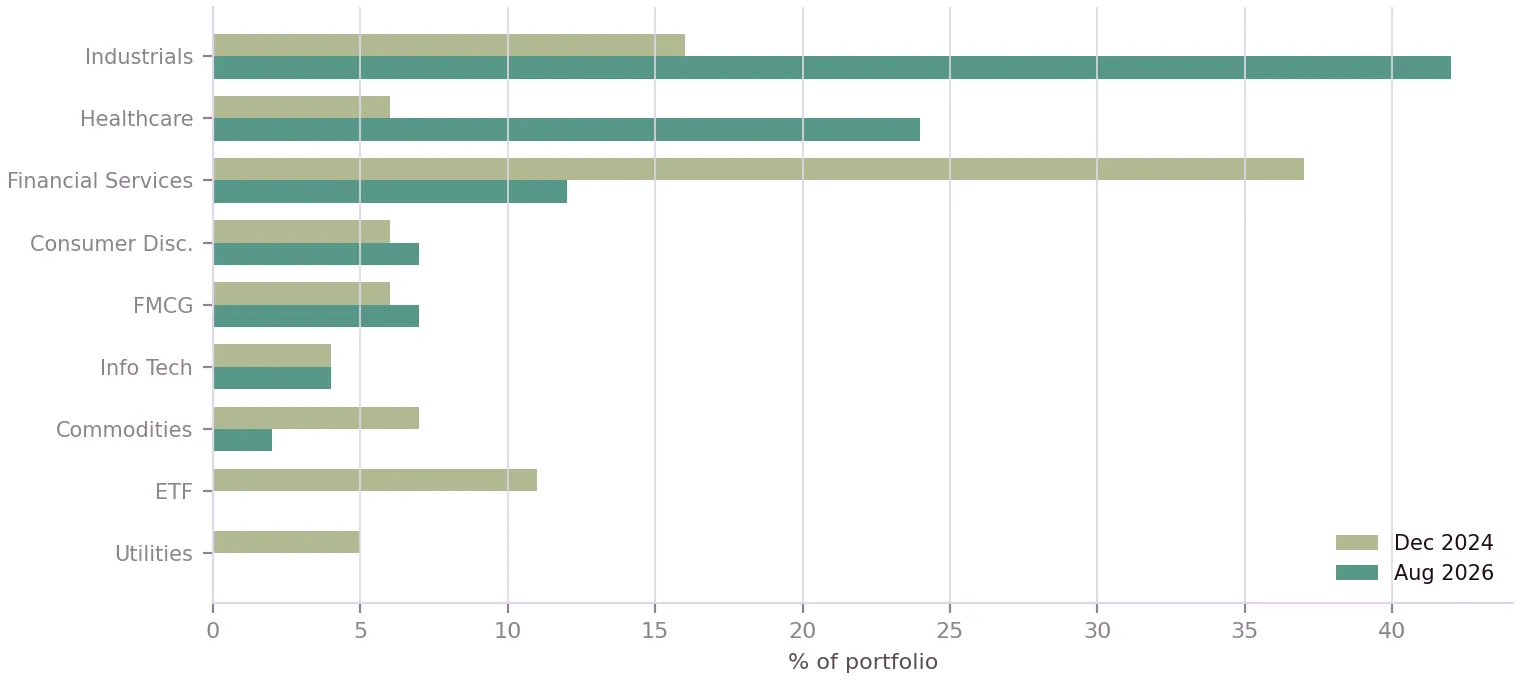
Sector allocation · December 2024 vs August 2026.
By market cap the book is 10% large, 17% mid and 68% small, the most small-cap-heavy it has ever been, against 19% in March 2024. I would rather say this plainly than bury it: this is a high-conviction small and midcap portfolio, it will have drawdowns larger than the market, and 2025 is what that looks like when it goes against you.
Factor tilt
Percentile exposures against the BSE 500 universe, weighted by position. The book is built on earnings momentum and price momentum, with deliberately lower beta and volatility than the market.
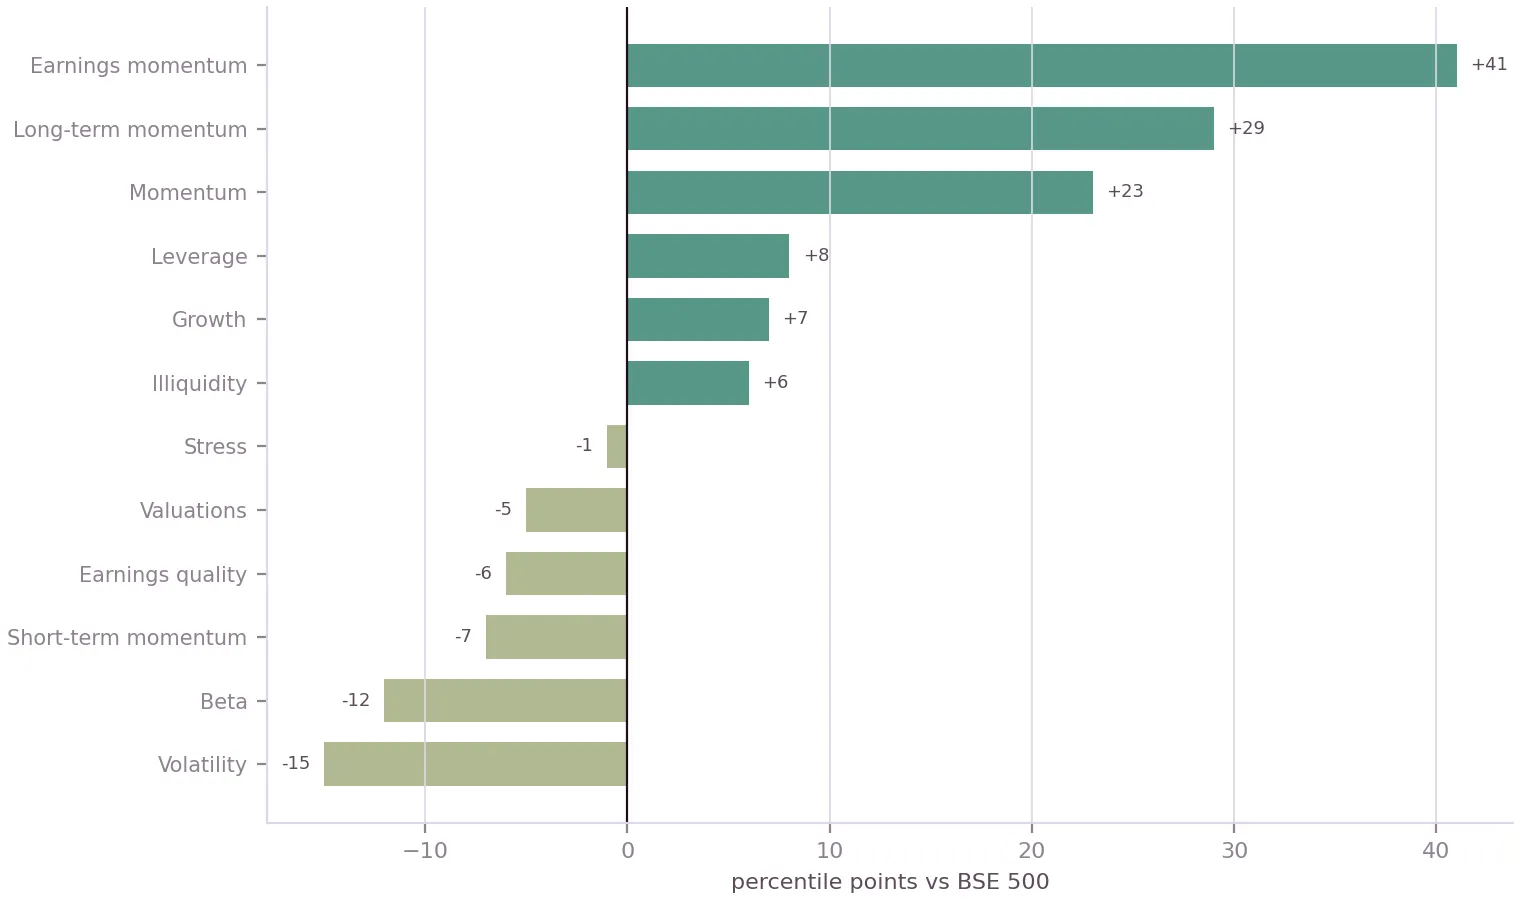
Factor tilt vs BSE 500 · percentile points. Weighted PE is 40.4 against a BSE 500 median of 32.2. We are paying up for the earnings momentum.
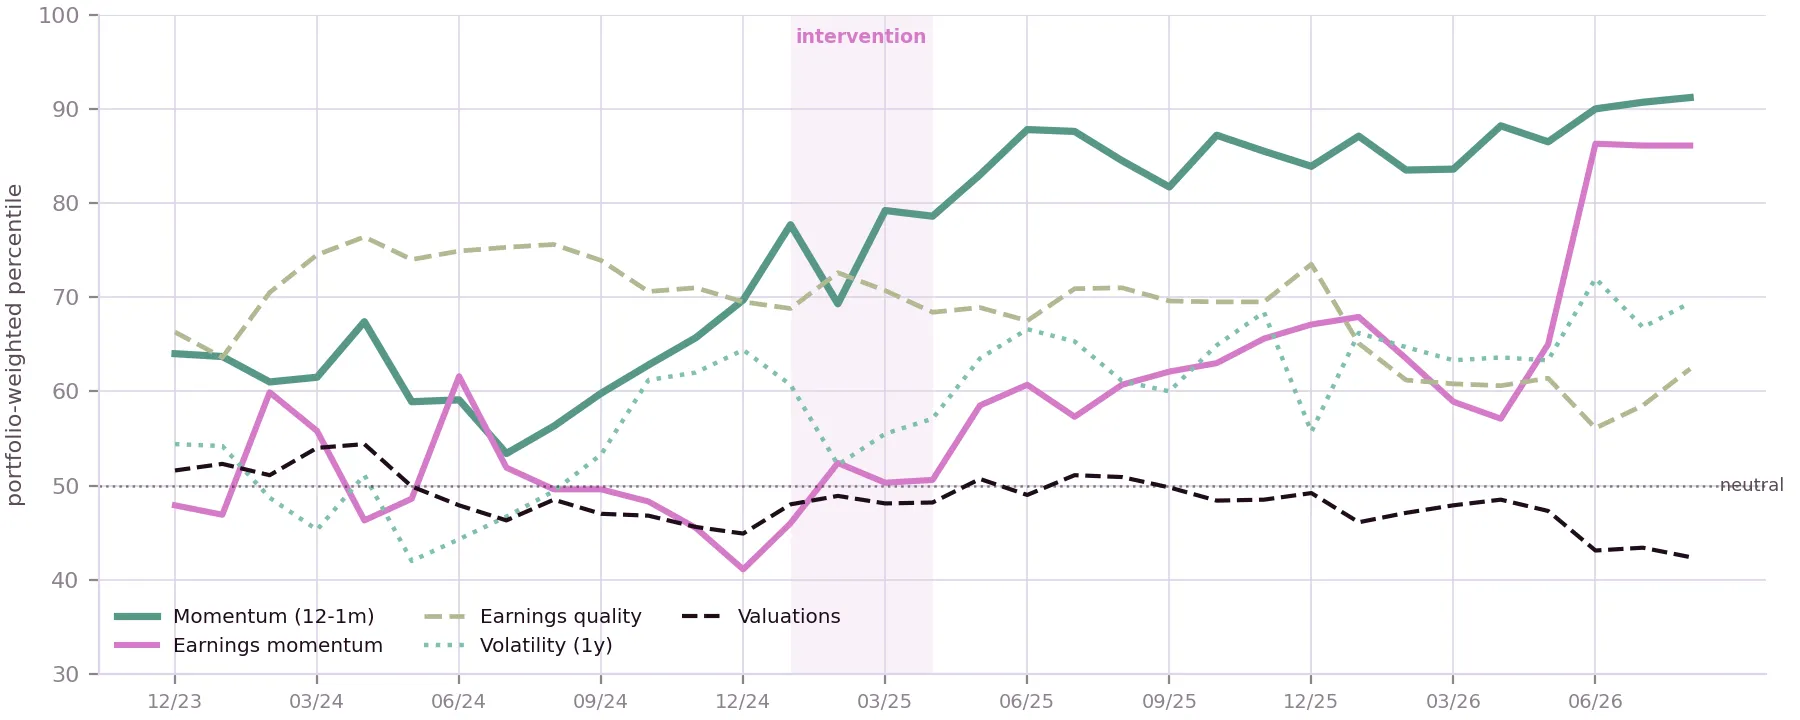
Exposure over time · portfolio-weighted percentile within the universe. Monthly, December 2023 to August 2026. Momentum and volatility are computed from prices at each date; the fundamental factors apply today's factor scores to the holdings we ran then, so read those as how the composition changed rather than what the scores were at the time.
Momentum has climbed almost without interruption, from the 64th percentile at the end of 2023 to the 91st today. Nothing states more clearly what this book has become. Volatility followed it from the 54th to the 69th, the honest counterpart.
Earnings momentum drifted near neutral for two years, bottomed at the 41st percentile in December 2024, right before the correction, then stepped up hard to the 86th.
Two exposures went the other way: earnings quality from the mid-70s to the low 60s, valuations from the low 50s to the 42nd. We hold cheaper, lower-quality companies with faster-improving earnings than we used to. A deliberate consequence of leaning on revisions, and worth stating rather than leaving for someone to find.
Stocks
Our PMS presentation carries three slides: multibaggers, great entries, great exits. Here they are, computed from every holding episode since inception.
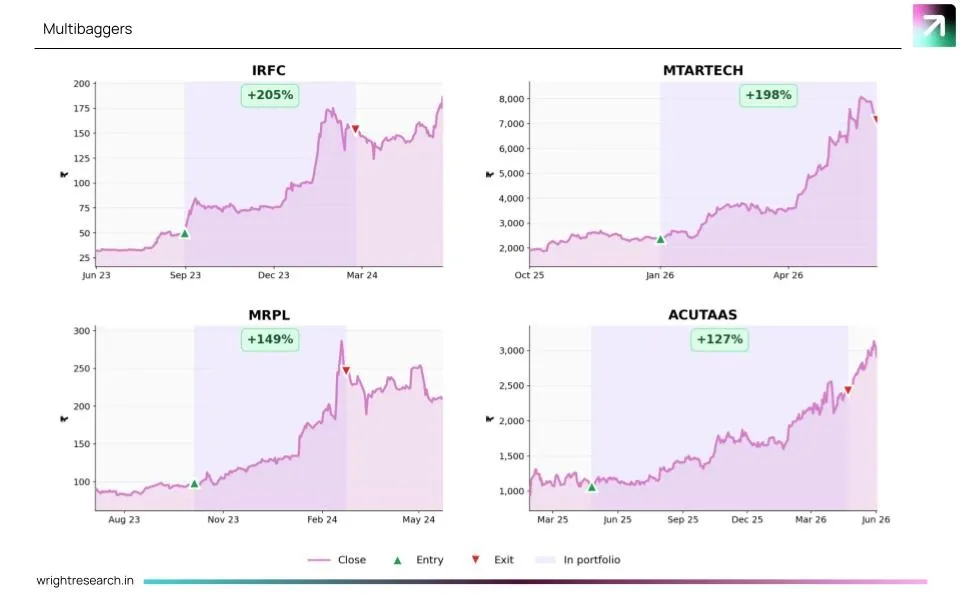
Multibaggers · largest position returns since inception.
Multibaggers
MTAR Technologies is up 192% and still held, and has contributed 7.9 points of NAV on its own. Maharashtra Scooters made 114% over 664 days; MRPL made 88% in 49.
Great entries
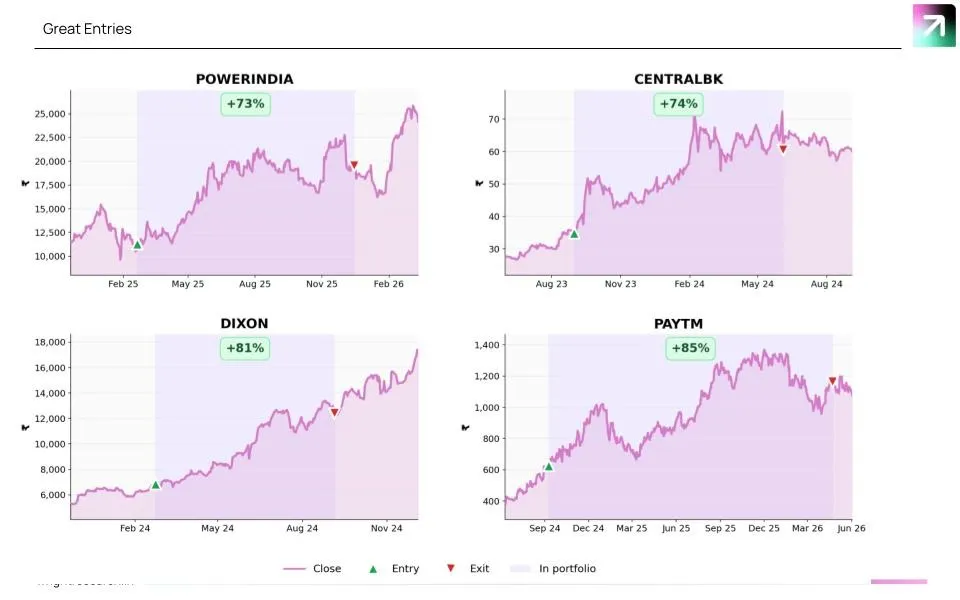
Great entries · alpha earned over the holding period. Every episode since inception, open and closed. Measured as the stock's return minus the BSE 500 over exactly the days we held it, which is what an entry is actually worth.
An entry is only as good as what it earned over the market while we held it, so this is alpha rather than raw return, across every episode since inception.
MTAR is +194 points over 239 days. IRFC +87, PFC +84 and REC +70 were all bought on 31 August 2023, in the fund's first fortnight. Four of the top twelve are still open, and Welspun appears for the second time, having been sold at a loss nine months before the models bought it back.
Great exits
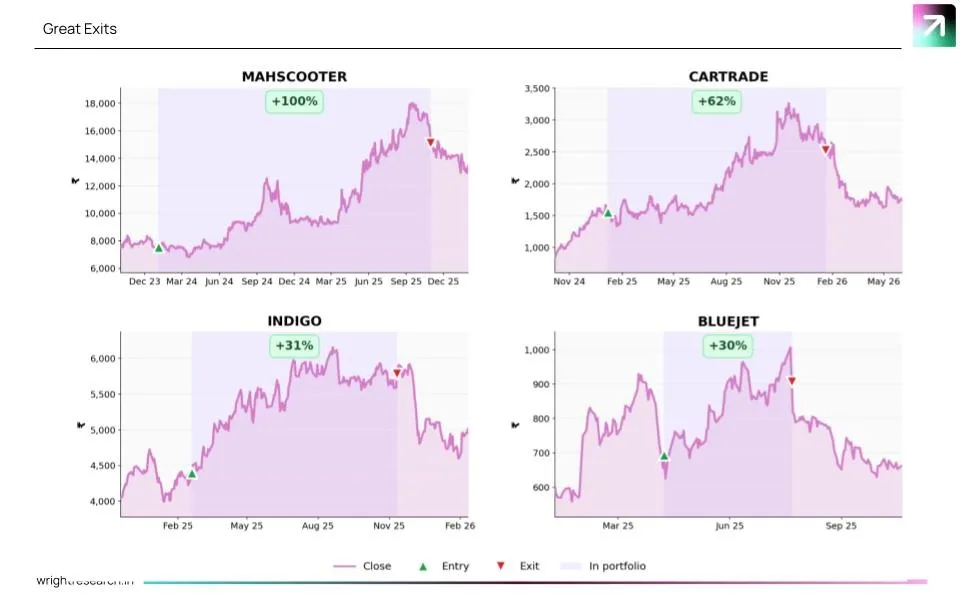
Great exits · what the stock did in the twelve months after we sold.
The exits are the half of the process nobody puts on a slide willingly. Motilal Oswal was sold at +28.7% and fell 64% over the next year; MRPL sold at +88.5% and fell 54%; Central Bank sold at +37.7%, then down 44%. Those are the sells that make the buys worth having. It is the same discipline that failed in February 2025, a process that exits on evidence rather than on how the month feels.
Get research like this in your inbox
The week’s research that mattered, in five minutes. Joined by 2L+ investors.
Where the returns came from
Contribution figures below are attribution-based and overstate the published NAV; treat them as directional. Between January and May 2025 we closed 40 positions, and those 40 episodes contributed −8.5 points to the portfolio. That is the cost of those months measured position by position rather than inferred from the NAV curve.
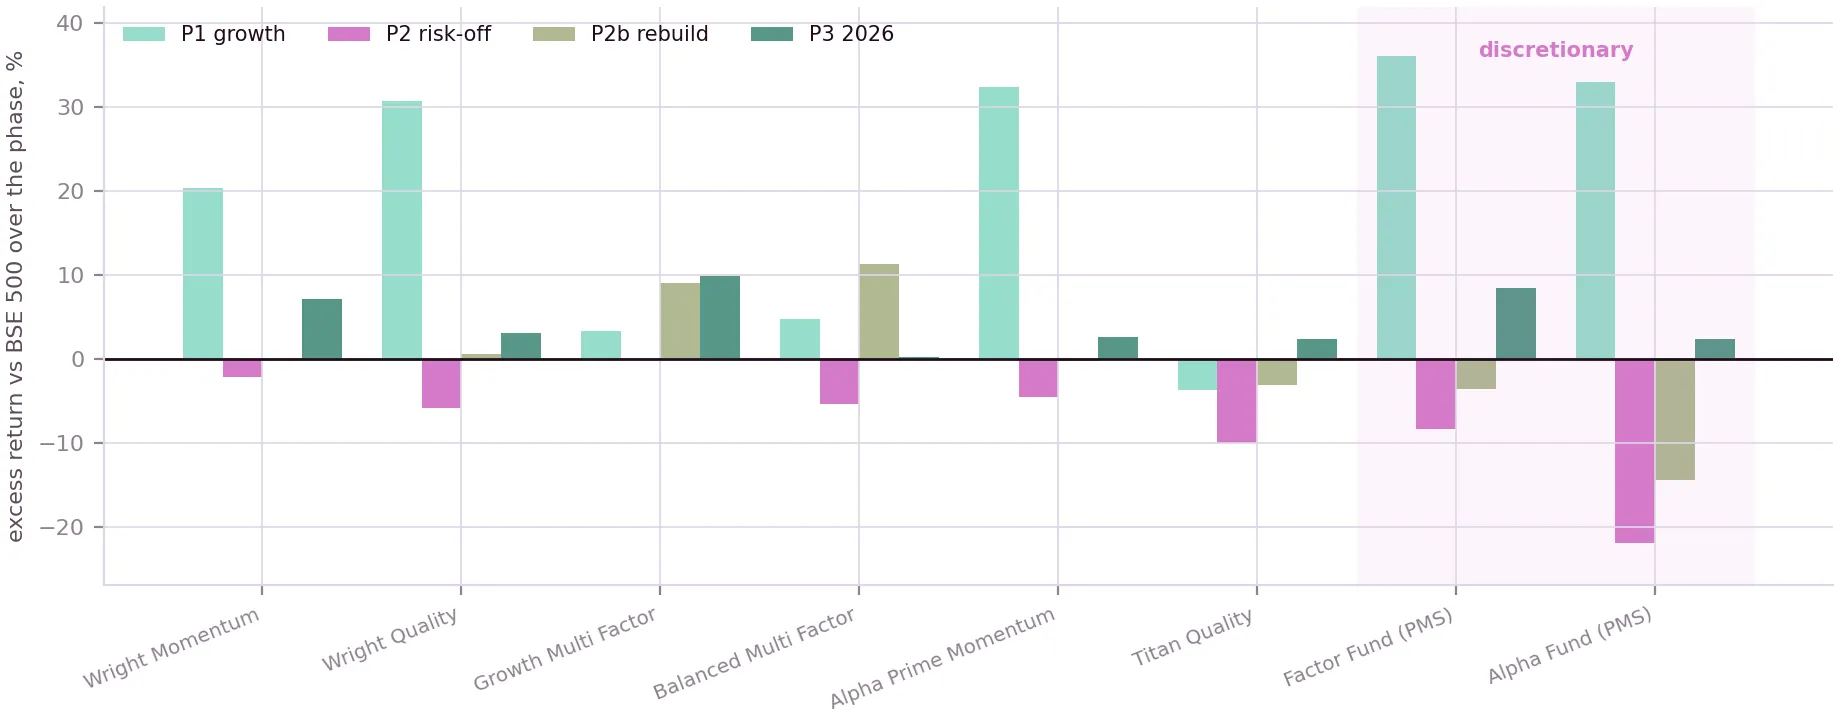
Every Wright strategy through the four phases. Excess return against the BSE 500 over each phase. The shaded pair on the right are the two discretionary PMS products; the other six are model portfolios that run untouched.
One comparison is worth stating plainly. We run eight model portfolios off the same engine: six model portfolios that run untouched, and two PMS products where I can intervene. Through the risk-off phase the six model portfolios lost an average of 4.7 points against the BSE 500. The two I could touch lost 8.4 and 22.0.
Wright Momentum lost 2.2 points in the same six months the Factor Fund lost 8.4, off the same factor engine. The mandates differ, so it is not a controlled experiment. But the difference between those two numbers is mostly me. By 2026 the gap has closed: the Factor Fund is at +8.5 for the phase, second only to Growth Multi Factor at +9.9.
Sector attribution since inception
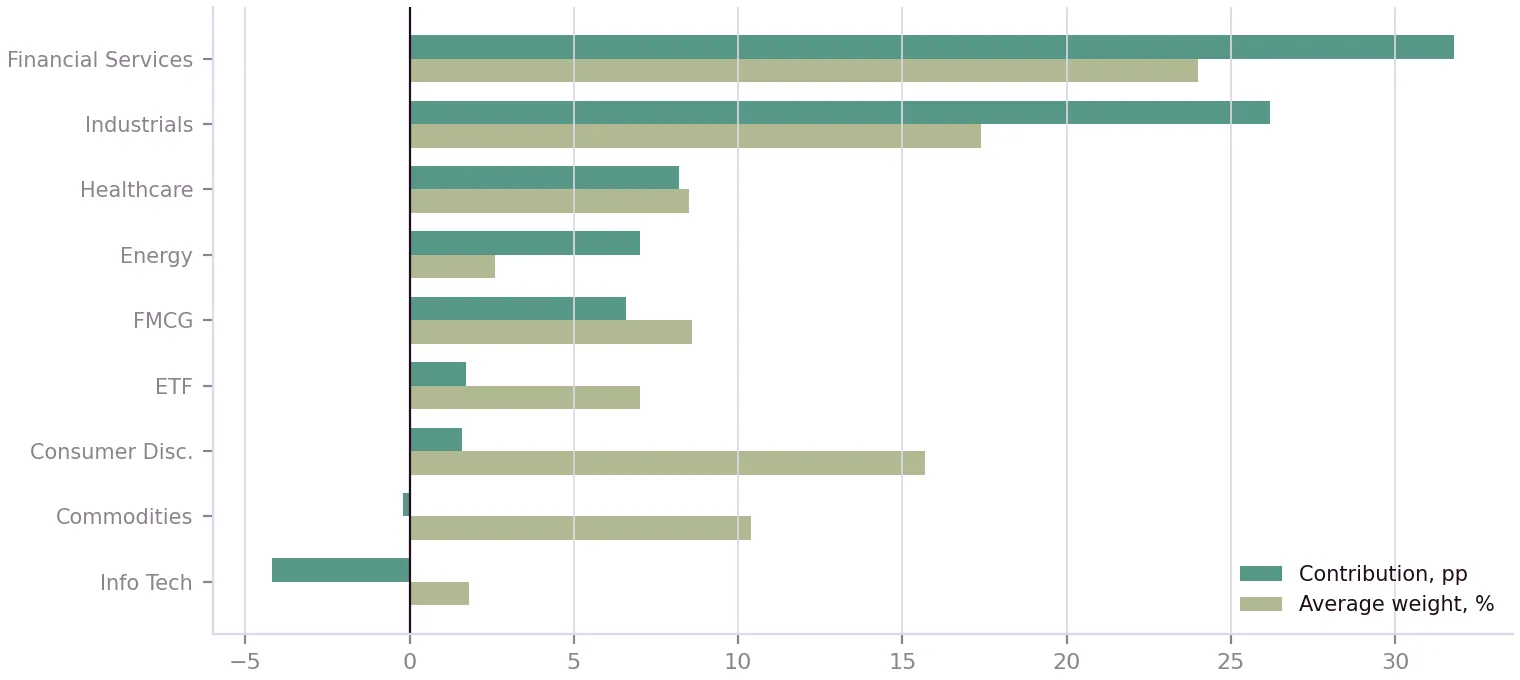
Contribution vs average weight by sector · since inception.
SECTOR | CONTRIBUTION | AVG WEIGHT | RETURN ON WEIGHT |
|---|---|---|---|
Financial Services | +31.8 | 24.0% | 133% |
Industrials | +26.2 | 17.4% | 151% |
Healthcare | +8.2 | 8.5% | 96% |
Energy | +7.0 | 2.6% | 263% |
FMCG | +6.6 | 8.6% | 77% |
ETF | +1.7 | 7.0% | 25% |
Consumer Discretionary | +1.6 | 15.7% | 11% |
Commodities | −0.2 | 10.4% | −2% |
Information Technology | −4.2 | 1.8% | −241% |
Did we really pick the right sectors early?
I said in my notes that our strategies kept picking the right sectors early, so I scored it: every time a sector weight moved 5 points or more in a month, did the matching Nifty sector index then beat the Nifty 500 over the next three months?
Some calls were very good and some very expensive. Cutting Capital Markets in February 2026 cost us: the index beat the market by 22 points over the next three months.
2026 CALL | MOVE | INDEX 3M | INDEX 6M | OWN 3M | VERDICT |
|---|---|---|---|---|---|
Industrial Products, July | +10pp | +0.9 | +0.9 | +4.4 | Right |
Industrials, May | +8pp | +0.3 | +0.3 | +6.0 | Right |
Healthcare, February | +6pp | +6.3 | +9.4 | +1.1 | Right |
Pharma & Biotech, February | +6pp | +8.5 | +14.1 | +1.1 | Right |
Non-ferrous metals, January | +7pp | +10.2 | +6.2 | −1.0 | Right |
Financial Services, February cut | −13pp | −6.7 | −7.7 | 0.0 | Right |
Capital Markets, February cut | −7pp | +22.0 | +14.1 | +0.7 | Wrong |
Financial Services, January add | +12pp | −4.4 | −5.1 | −0.9 | Wrong |
Auto Components, June cut | −10pp | +8.1 | +8.1 | +0.2 | Wrong |
Aerospace & Defence, July cut | −7pp | +4.3 | +4.3 | +0.9 | Wrong |
Four forces that favour active right now
Everything above is history. This is where we are pointing now, and the argument is not that markets are about to rise. It is that this particular market is unusually hostile to owning the average of everything.
One. The calm is a level, not a behaviour
India VIX sits near 13, which reads as a quiet market. On 8 July it spiked 26% in a single session on the Iran scare, with Brent up 6.2% and the rupee through 95.5. The Sensex fell 1,677 points, the worst day since March. The very next session VIX fell 9% and the whole thing reversed inside 48 hours. Over the year the range has been 8.7 to 28.9.
That is a market with a nervous system on edge. Sitting still on one fixed position is the risk, not the safety.
Two. Stocks are going separate ways
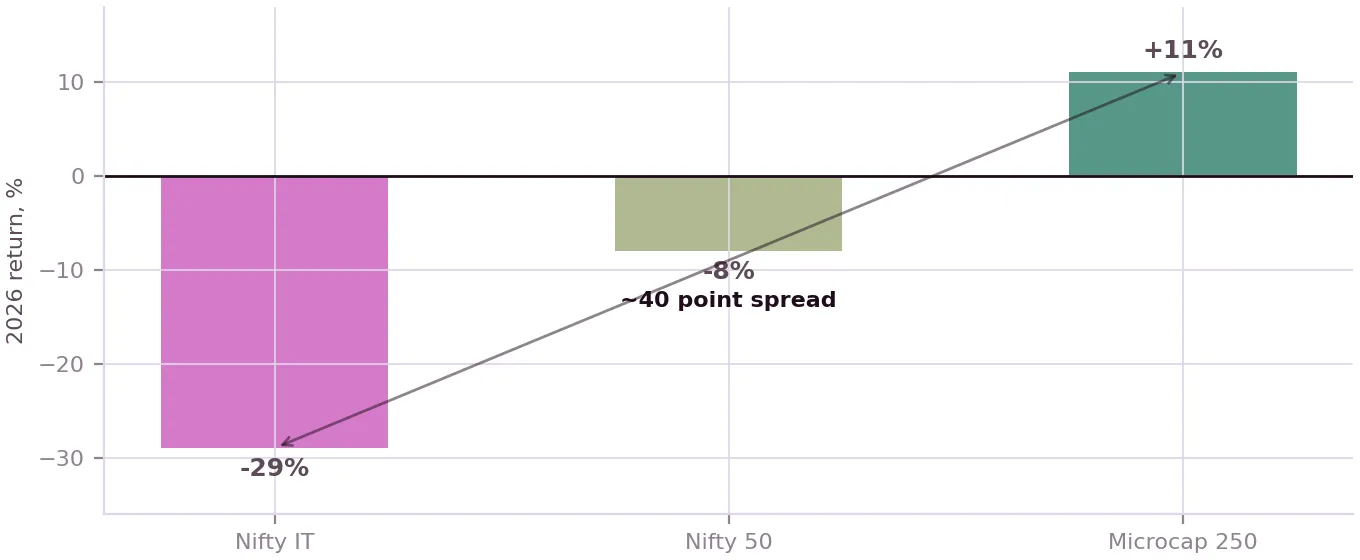
Same market, very different journeys. 2026 returns. Nifty IT against Nifty 50 against Microcap 250.
Nifty IT is down 29% this year. Microcaps are up 11%. That is a forty point spread inside one market. And inside IT itself, similar businesses trade at 41 times next to 29 times, with analysts split enough to have a buy on one and an underperform on its neighbour.
When the whole market moves as one, selection adds nothing. When it splits like this, selection is the only thing that adds anything.
Three. Dear money widens the gap
Everyone sees the first effect of high rates: a fixed deposit competes with a mediocre index, so beta alone has to clear a higher bar. The second effect is the one that matters to us. A business with cash and steady profits is worth far more, relatively, when money is dear, than one burning cash for a payoff five years out.
Rates are not hostile to equities. They are hostile to undifferentiated exposure. A disciplined book plays that gap on both sides: in what it owns, and just as deliberately in what it refuses to own.
Four. Money that is not watching price
FIIs pulled roughly ₹78,000 crore out in the first half of 2026. SIPs replaced it at about ₹30,000 crore a month, buying almost regardless of price. Of the 41 Nifty names FIIs sold, domestic institutions added to 39.
An FII exit this size produced drawdowns of 20 to 25% in 2013 and 2018. This cycle it has produced about 5%. Price-insensitive buying cushions every fall, and it also makes the market slower to price things correctly. That is precisely where a careful investor finds room.
What our own engine says
Three readings, and they do not all point the same way.
The regime model flipped risk-on in July
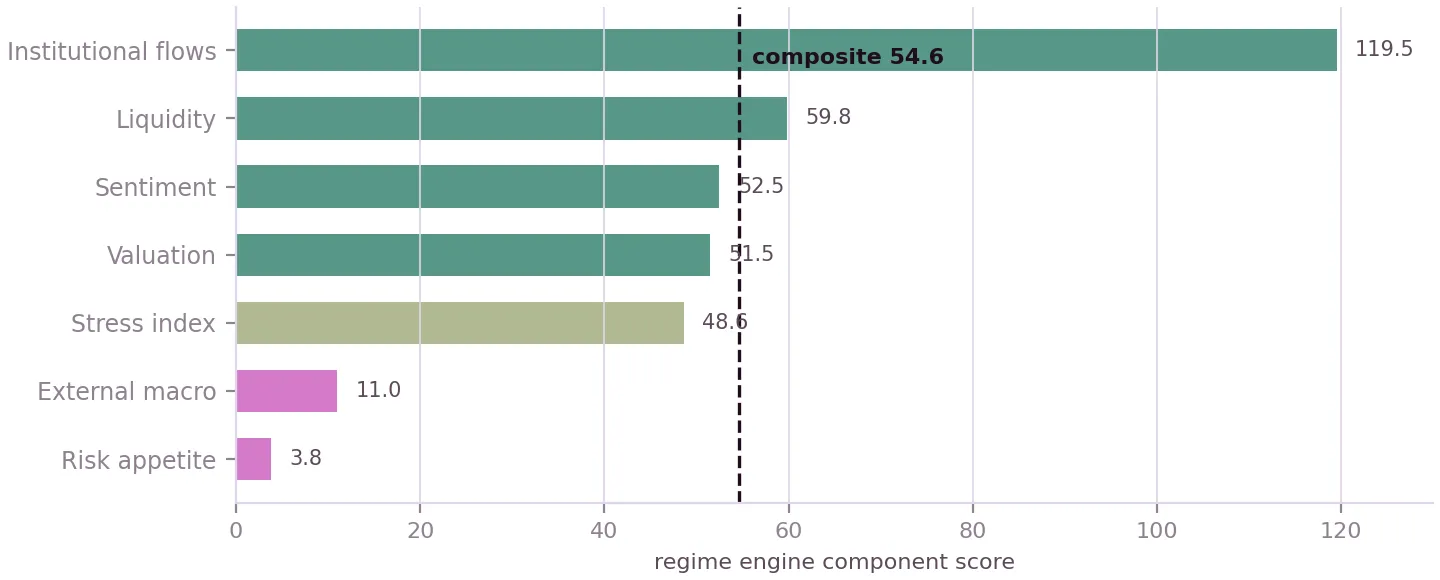
Regime engine, component scores. Composite 54.6. Every day since around 20 July has printed risk-on.
The composite reads 54.6, which our engine classes as a bull. But look at what is driving it. Institutional flows at 119.5 and liquidity at 59.8 are carrying the whole thing, while risk appetite sits at 3.8 and external macro at 11.0. That is a liquidity-driven bull, not a euphoric one, and the distinction matters for how much you should trust it.
Our Fear and Greed index reads 0.4, firmly in greed, after deep fear in May and sustained greed since mid-June. Constructive for risk assets. But from here, crowding replaces panic as the thing to manage, and that is when discipline on entries and sizing matters most.
Factor dispersion is unusually rich
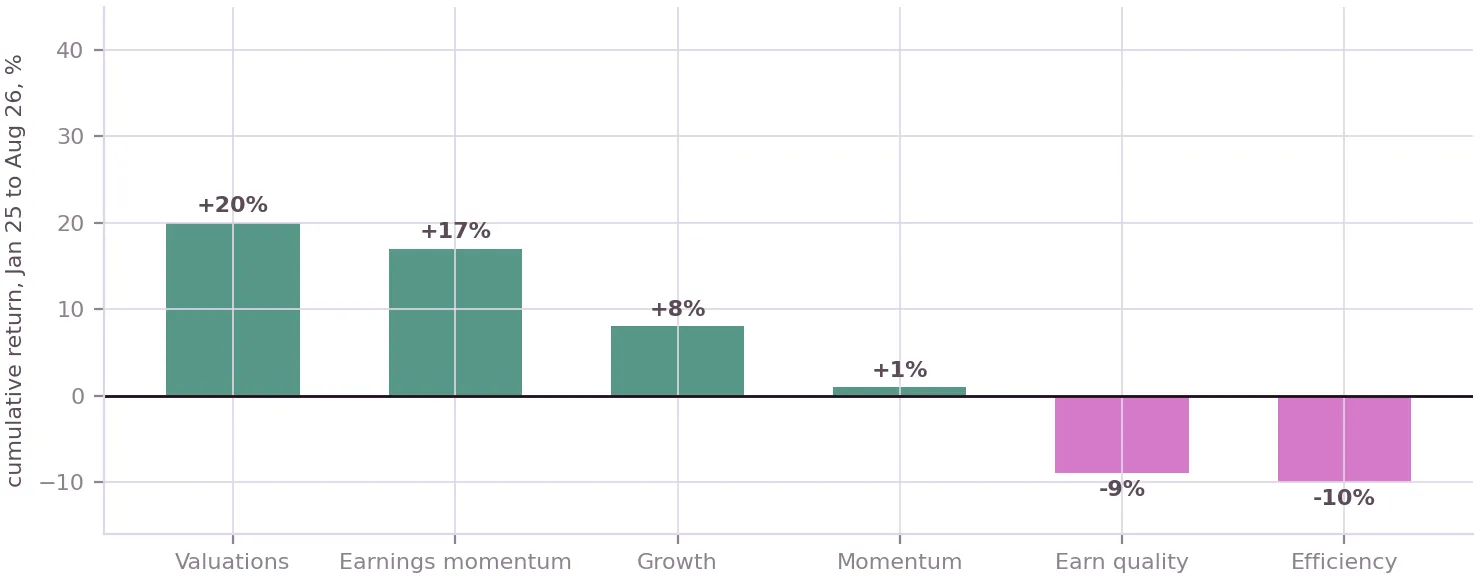
What the factors have paid. Cumulative factor returns, January 2025 to August 2026.
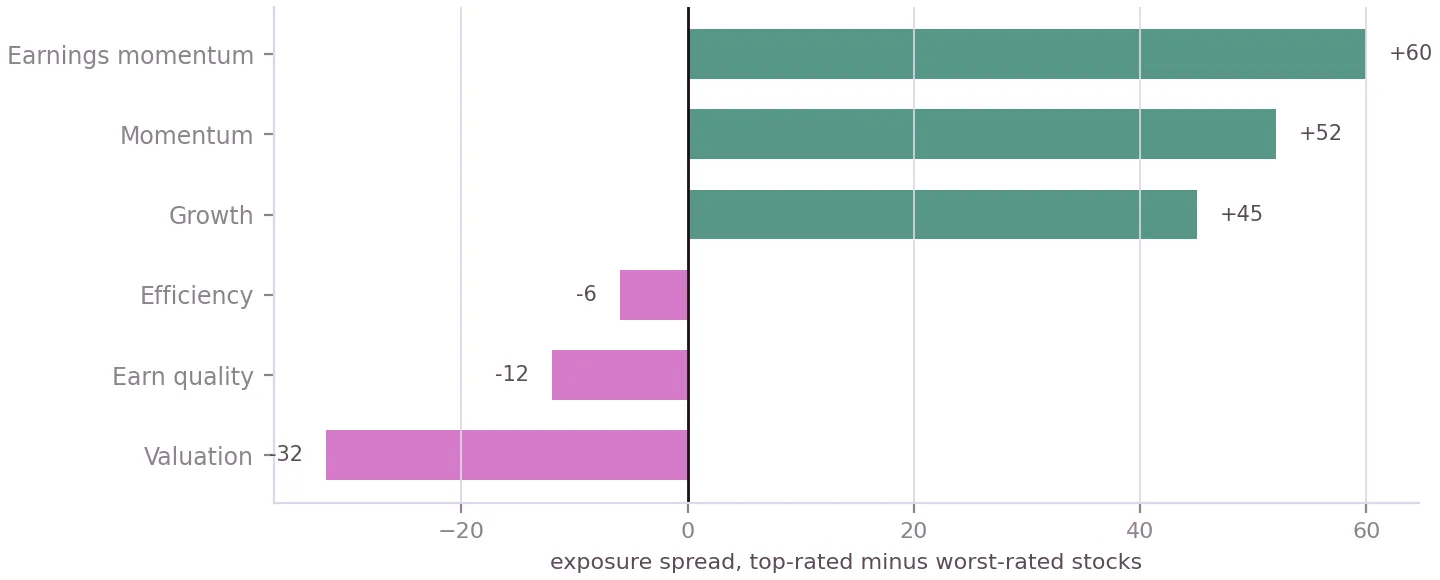
Spread between our top-rated and worst-rated stocks. The wider the spread, the more a systematic stock-picker has to monetise.
Targets, revisions and momentum are being paid. Valuations and quality are not, yet. And the spread between our top-rated and worst-rated names is wide across almost every factor.
That spread is the raw material. It is also why the book leans towards revisions, momentum and targets while the spread pays them, and keeps valuation exposure light. The regime layer is what flips that mix when leadership rotates.
Where we lean in, and where we step aside
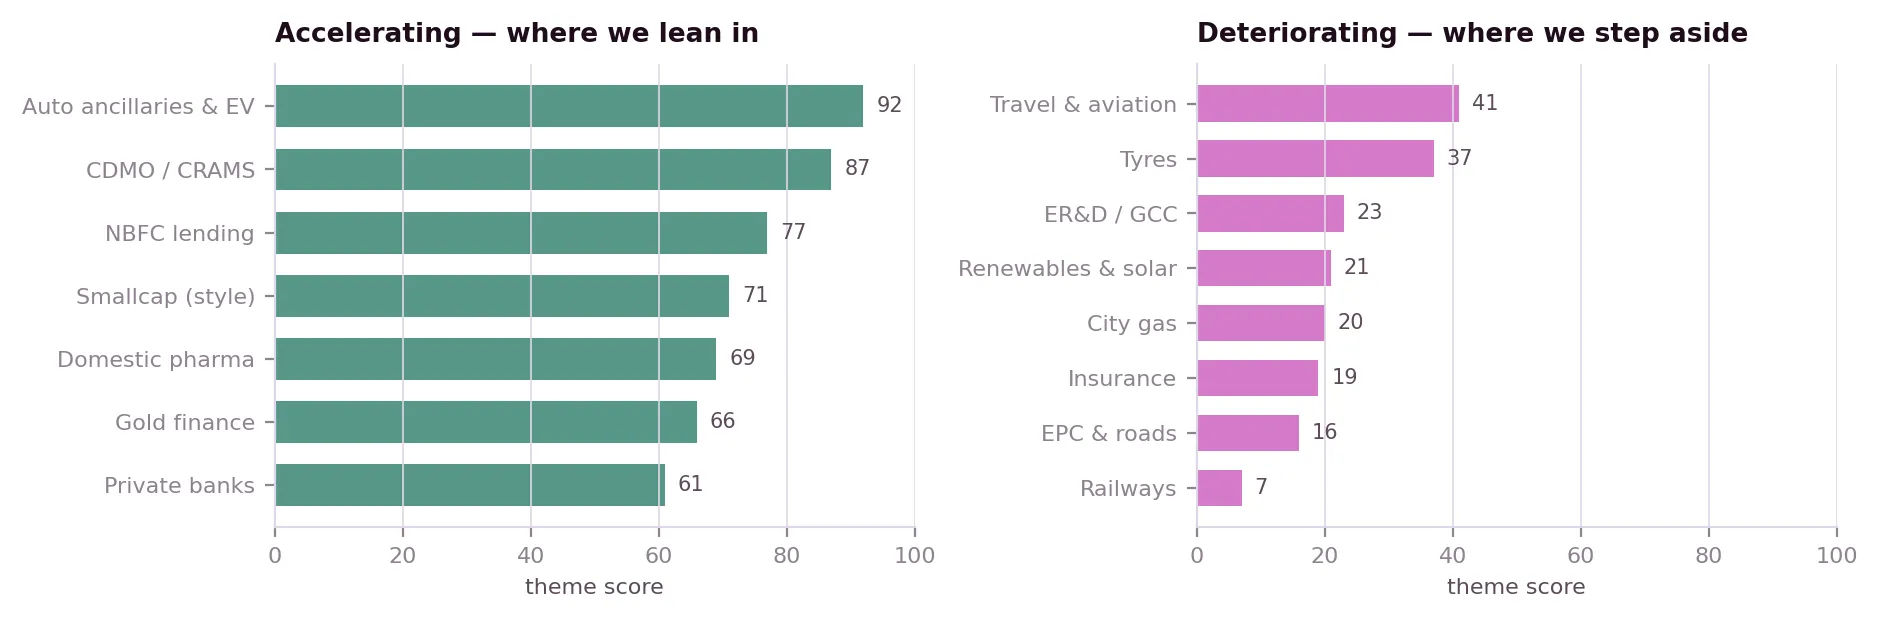
Wright theme monitor. Theme scores from our live monitor.
Auto ancillaries and the EV supply chain, CDMO and CRAMS, and NBFC lending are accelerating, mostly on structural stories with rising relative strength. Smallcap as a style is accelerating too.
Travel and aviation, tyres, ER&D, and the policy-hit pockets of renewables, city gas and railways are losing relative strength. Railways scores 7 out of 100. A passive allocation holds every one of them regardless.
And a third group is worth naming separately: data-centre power, hospitals and diagnostics, microfinance. All still strong, all late-stage. Positions to harvest and size with care, not to chase. That is the group July taught us about.
What would break this
Oil back above $100 with the rupee past 96, which is the March template: Brent hit 101 that month and our stress index went to 2.74. Or US real yields past 2.5%, which would pull the FII bid further away and test how much the domestic wall can absorb.
And one specific to us. A sharp low-quality, high-beta squeeze of the kind we saw between April and June, when breadth went from 16% to 83% in a quarter. Our below-market beta means we lag those. A deliberate choice, not an oversight, and the same choice that keeps our drawdowns shorter than they would otherwise be.
Track the factors behind this research
Momentum, value, quality and low-vol — updated factor performance for Indian markets.
In closing
Three years ago I thought the hard part of quant investing was building the models.
It is not. The models were right in January 2025, right in February, right through the whole of the drawdown. The hard part is the person sitting between the model and the trade, on the day the phone will not stop ringing.
I am still that person. I am just a much less confident one, and the numbers say that is an improvement.


