Blog home
Newsletter
News
Video
Podcast
Reading list
Wright Brief
Sign In

Three month performance update

We have completed 3 months since we started our multi asset tactical portfolios!

Listen to this article
Audio · ~2 min
Add as a preferred source on Google
Three month performance update

We have completed 3 months since we started our multi asset tactical portfolios! We’ll start this update with a big thanks to all the investors who have shown a trust in us. Your trust is our biggest asset.

Let’s look at the live performance, market allocations, cost concerns and the plan ahead in this post.

Live Performance
Three Months Performance
Live Performance of Multi Asset Tactical Portfolio

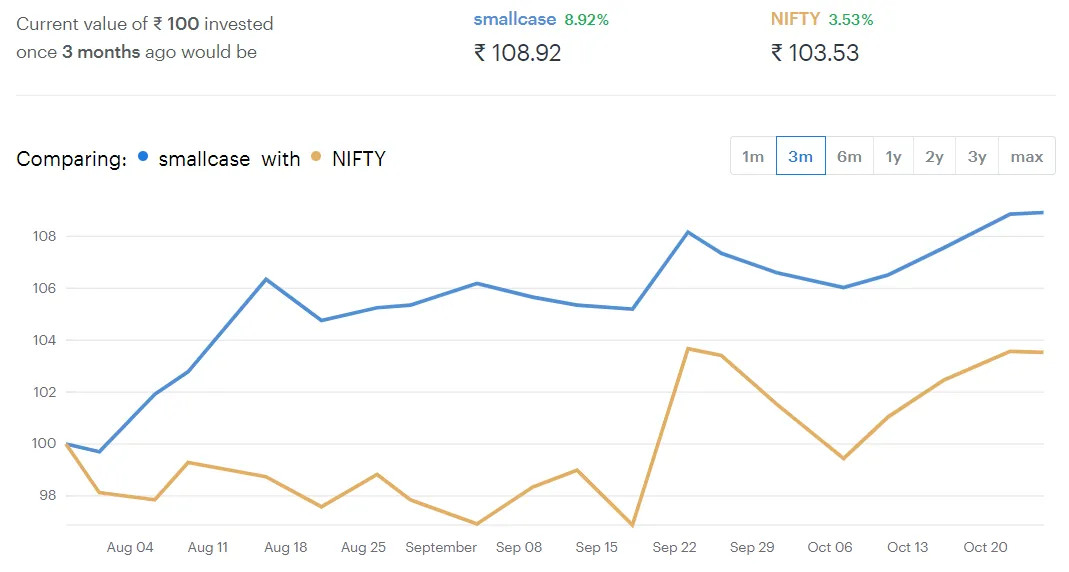
The live performance has been the most encouraging with the Multi Asset Tactical portfolio giving us 8.92% returns compared to 3.53% by the Nifty Index, which amounts to a an out performance of 5.39% in 3 months.

These are just the theoretical index returns, that do not consider the costs incurred when the portfolio is churned. We will look at costs later in the post.

Free tool

See what markets are pricing in

Live indices, sector moves and market breadth — the backdrop to every story we publish.

Open Market Tracker

Broad Market Allocations

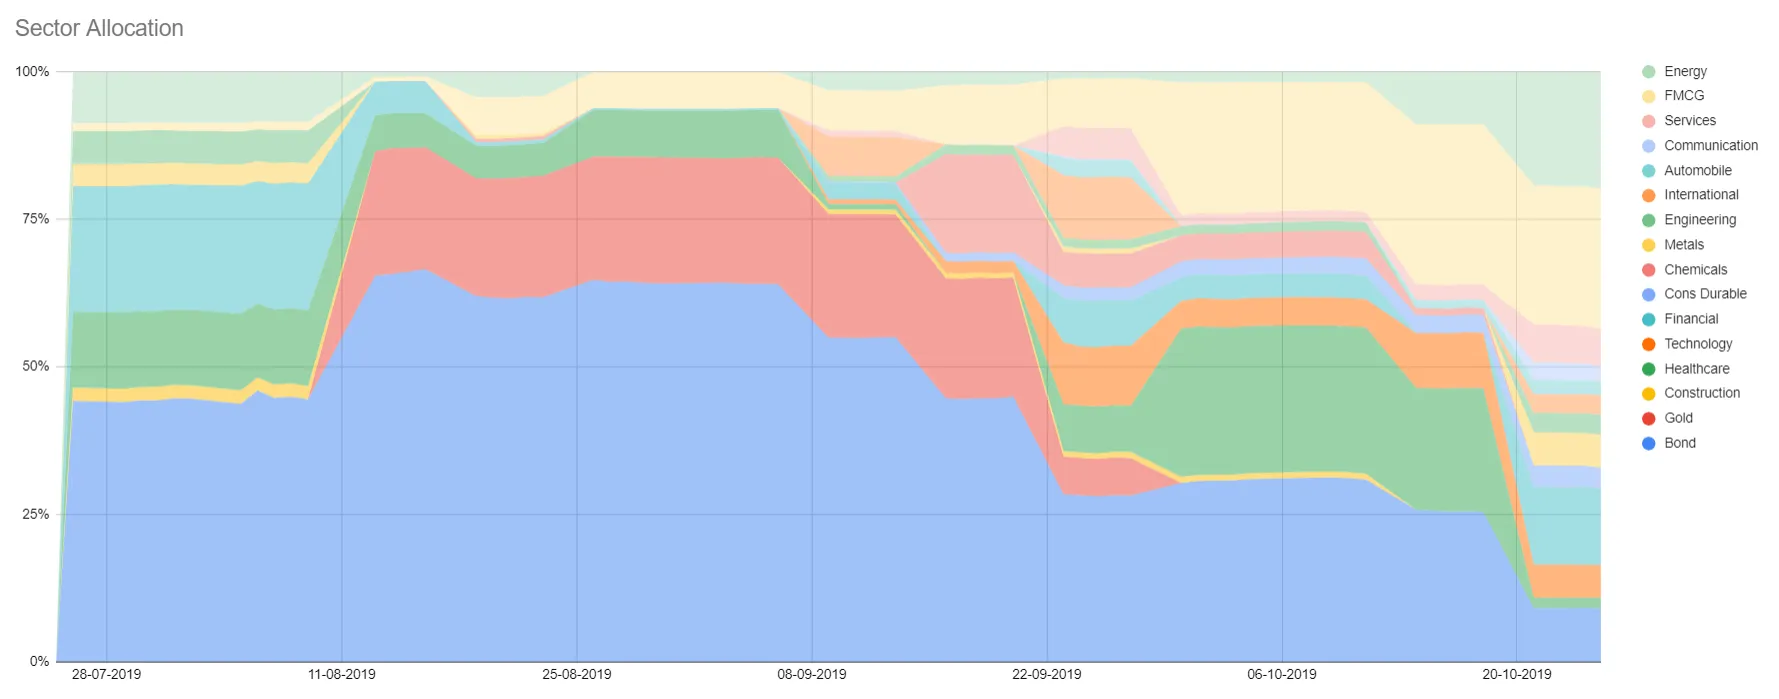
For an analysis on the source of returns, lets look at the sector allocation. We had ~ 50% allocation to bonds and 15% to Gold a month back. We have now moved to ~ 15% allocation to Bonds, 0% to Gold. Among equity we are most overweight on Energy and FMCG sectors.
Three Months Performance
Sector Allocations for the Multi Asset Tactical Portfolio
The Wright Brief · free weekly

Get research like this in your inbox

The week’s research that mattered, in five minutes. Joined by 1.6L+ investors.

Turnover and Cost Concerns

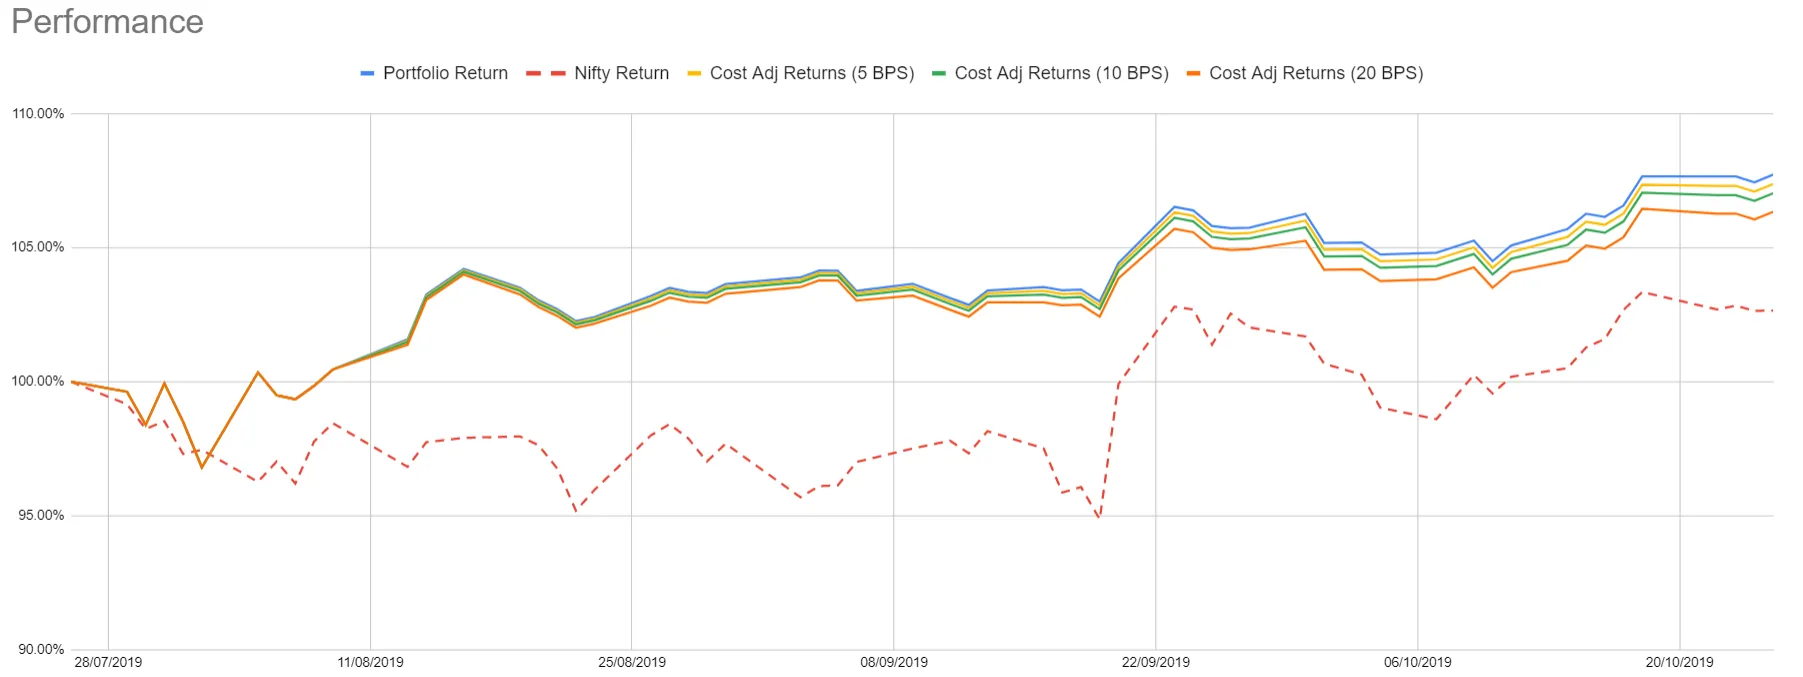
The portfolio has had a turnover of around 300% since we started. Initially we has some unwanted churn when we switched bond ETFs but now the portfolio is very stable with < 25% churn expected at each rebalance. The cost adjusted returns are:
Three Months Performance
Cost Adjusted Returns for the Portfolio

Here we see adjusted returns at various cost assumptions (5, 10, 20 basis points). Expected cost at most brokerages is 5 basis points and the most conservative case would be 20 basis points.

Having worked at a trading execution desk at Edelweiss for 4 years, I think that we can do much better on execution and I am exploring solutions around that.

Free tool

Track the factors behind this research

Momentum, value, quality and low-vol — updated factor performance for Indian markets.

Open Factor Updates

Plan Ahead

We get a lot of questions about what would happen in a 2008 like scenario and how would we handle it, so we want to create a macro-economic model for long term regime modelling. We are also looking at publishing a pure equity strategy which would carry a higher risk and higher return soon.

We have also been working on our websitewww.wrightresearch.inwe’d really appreciate if you could take some time out and give me a feedback on ithere.

Happy Diwali and Happy Investing!

Disclaimer: Investment in securities market are subject to market risks. Read all the related documents carefully before investing. Registration granted by SEBI, membership of a SEBI recognized supervisory body (if any) and certification from NISM in no way guarantee performance of the intermediary or provide any assurance of returns to investors.

The content in these posts/articles is for informational and educational purposes only and should not be construed as professional financial advice and nor to be construed as an offer to buy/sell or the solicitation of an offer to buy/sell any security or financial products. Users must make their own investment decisions based on their specific investment objective and financial position and using such independent advisors as they believe necessary.

Wryght Research & Capital Pvt (Brand name: Wright Research) is a SEBI Registered Portfolio Manager Reg No: INP000007979 (Validity: Apr 03, 2023 – Perpetual) and a SEBI Registered Research Analyst No: INH000017295 (Validity: Jul 03, 2024 – Perpetual), with its registered office at 103, Shagun Vatika Prag Narayan Road, Lucknow, UP, 226001 India and CIN: U67100UP2019PTC123244. Past performance may or may not be sustained in future. Performance provided there in is not verified by SEBI. Investment in securities is subject to market and other risks, and there is no assurance or guarantee that the objectives of any of the strategies of the Portfolio Management Services will be achieved. Registration granted by SEBI, enlistment as RA with Exchange and certification from National Institute of Securities Markets (NISM) in no way guarantee performance of the intermediary or provide any assurance of returns to investors. Please read the Disclosure document carefully before investing. Securities quoted are for illustration only and are not recommendatory. Charts shown are for illustration only. For more information and disclosures, visit our disclosures page here.

Found this useful? Share it.
Explore related topics
About the author
Team Wright
Wright Research
Wright PMS · Portfolio Management Service

Put this research to work

The same 300+ factor research engine behind this article — applied to a professionally managed portfolio, end to end.

300+
Factors tracked
1.6L+
Investors
₹1,300+ Cr
Invested
SEBI
Registered PMS