

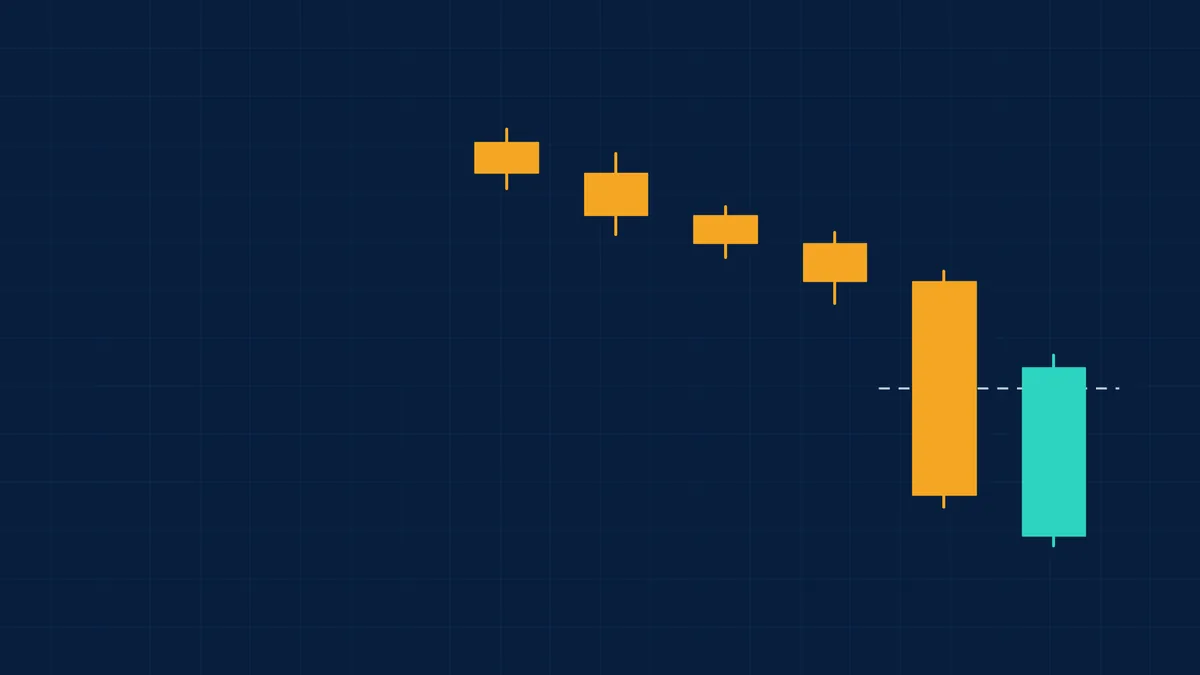
The piercing line is a two-candle bullish reversal pattern that appears after a downtrend. A long bearish candle is followed by a bullish candle that opens lower but closes above the midpoint of the first candle's body. It shows buyers returning with force.
How to recognise it
- A downtrend before the pattern.
- Candle 1: a long bearish candle.
- Candle 2: a bullish candle that opens below candle 1's low (a gap down), then closes above the midpoint of candle 1's body but below its open.
- On markets and timeframes where gaps are rare, many traders accept an open at or below candle 1's close.
See what markets are pricing in
Live indices, sector moves and market breadth — the backdrop to every story we publish.
A worked example
Candle 2 closes above the midpoint of candle 1 (105) but below its open (110). The prices are illustrative.
| Candle | Open | High | Low | Close |
|---|---|---|---|---|
| 1 (bearish) | 110 | 110.5 | 99.5 | 100 |
| 2 (bullish) | 98 | 107 | 97.5 | 106 |
Get research like this in your inbox
The week’s research that mattered, in five minutes. Joined by 2L+ investors.
How traders read it
- The new low at the open attracted buyers who pushed price most of the way back up, which suggests selling pressure is weakening.
- The deeper the close into candle 1's body, the stronger the signal. A close above candle 1's open would instead form a bullish engulfing pattern.
- A stop is often placed below candle 2's low (97.5).
Before relying on it
- Context decides the meaning. The same shape means different things after a rally, after a fall, or in a sideways market. See trend analysis.
- Wait for confirmation. Many traders want the next candle to move in the expected direction before acting. A pattern on its own is not a signal.
- Check volume and levels. A pattern at a known support or resistance level, with higher volume , is read as stronger.
- Expect failures. Tests of candlestick patterns have generally found modest and inconsistent predictive power, so risk should be limited with a stop-loss. See risk management with candlestick patterns.
Related: the dark cloud cover , its bearish mirror. See the full candlestick patterns guide.
Large caps or small caps: who is winning?
Nifty, midcap and smallcap returns from one day to ten years, with the spread and valuation by segment.
Frequently Asked Questions
What is a piercing line pattern?
A two-candle bullish reversal after a downtrend, where a green candle opens lower and closes above the midpoint of the previous long red candle.
What is the difference between a piercing line and a bullish engulfing pattern?
A piercing line closes only above the midpoint of the first candle. A bullish engulfing closes above the first candle's open.
What is the opposite of a piercing line?
The dark cloud cover, a bearish reversal after an uptrend.
Does the piercing line need a gap?
Classically yes, but where gaps are rare, an open near the prior close is often accepted.
This article is for education only and is not investment advice. Indicator readings describe past price behaviour and do not predict future returns.



