

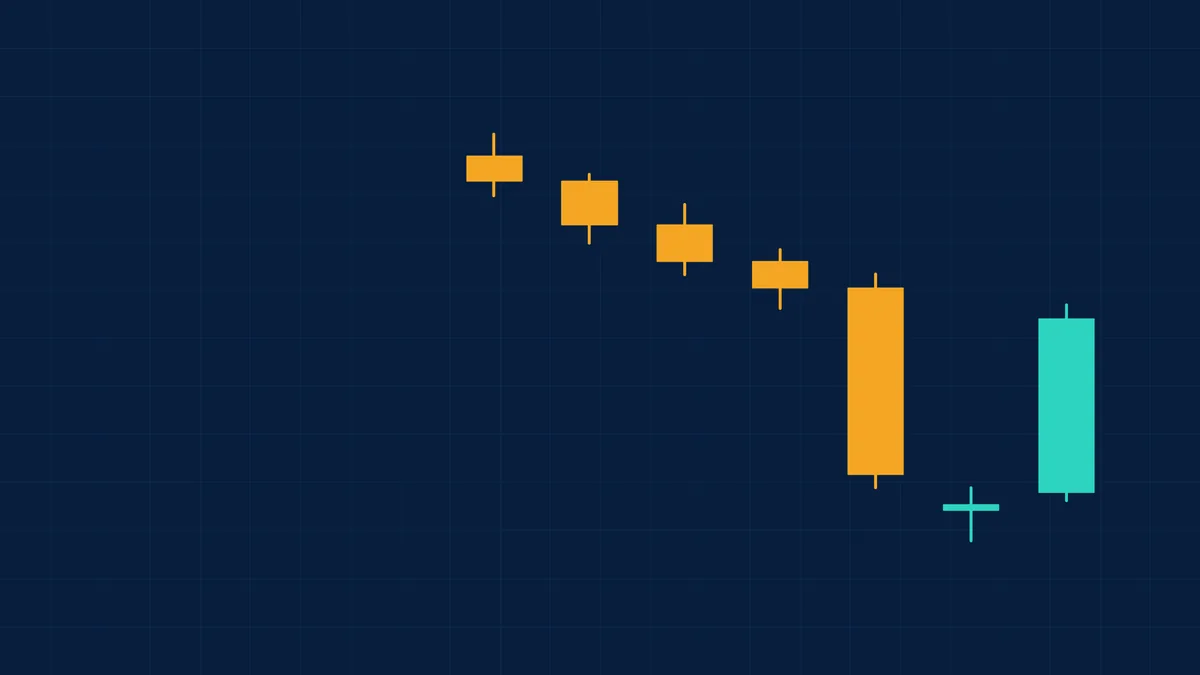
The morning star is a three-candle pattern that appears after a downtrend and is read as a possible bottom. It shows selling pressure first, then indecision, then buyers taking control. The name suggests the dawn that follows the night.
How to recognise it
- Candle 1: a long bearish candle in a downtrend.
- Candle 2: a small-bodied candle (the star), of either colour, that gaps or trades below candle 1's close.
- Candle 3: a long bullish candle that closes above the midpoint of candle 1's body.
See what markets are pricing in
Live indices, sector moves and market breadth — the backdrop to every story we publish.
A worked example
Candle 3 closes above the midpoint of candle 1 (105). The prices are illustrative.
| Candle | Open | High | Low | Close |
|---|---|---|---|---|
| 1 (bearish) | 110 | 110.5 | 99.5 | 100 |
| 2 (star) | 98 | 99.5 | 97 | 99 |
| 3 (bullish) | 100 | 108 | 99.5 | 107 |
Get research like this in your inbox
The week’s research that mattered, in five minutes. Joined by 2L+ investors.
How traders read it
- The star shows selling has stalled, and the third candle shows buyers pushing price back up into the first candle's range.
- A close above the midpoint is the minimum, and a close above candle 1's open makes it stronger.
- A stop is often placed below the star's low (97).
Before relying on it
- Context decides the meaning. The same shape means different things after a rally, after a fall, or in a sideways market. See trend analysis.
- Wait for confirmation. Many traders want the next candle to move in the expected direction before acting. A pattern on its own is not a signal.
- Check volume and levels. A pattern at a known support or resistance level, with higher volume , is read as stronger.
- Expect failures. Tests of candlestick patterns have generally found modest and inconsistent predictive power, so risk should be limited with a stop-loss. See risk management with candlestick patterns.
Related: the evening star , its bearish mirror, and the harami. See the full candlestick patterns guide.
Large caps or small caps: who is winning?
Nifty, midcap and smallcap returns from one day to ten years, with the spread and valuation by segment.
Frequently Asked Questions
What is a morning star pattern?
A three-candle bullish reversal pattern after a downtrend: a long bearish candle, a small star candle and a long bullish candle.
What does the morning star indicate?
A possible end of a downtrend as selling pressure fades and buyers take over, which should be confirmed.
What is a morning doji star?
A morning star in which the middle candle is a doji. It shows stronger indecision.
What is the opposite of a morning star?
The evening star, a three-candle bearish reversal after an uptrend.
This article is for education only and is not investment advice. Indicator readings describe past price behaviour and do not predict future returns.



