by Sonam Srivastava
Published On Aug. 2, 2025
For much of the past decade, momentum investing—the disciplined pursuit of stocks showing strong, sustained price trends—has been a winning strategy in Indian equities. Indices and funds using momentum as their guiding star have delivered robust outperformance versus many other factor styles, attracting widespread attention from both retail and institutional investors.
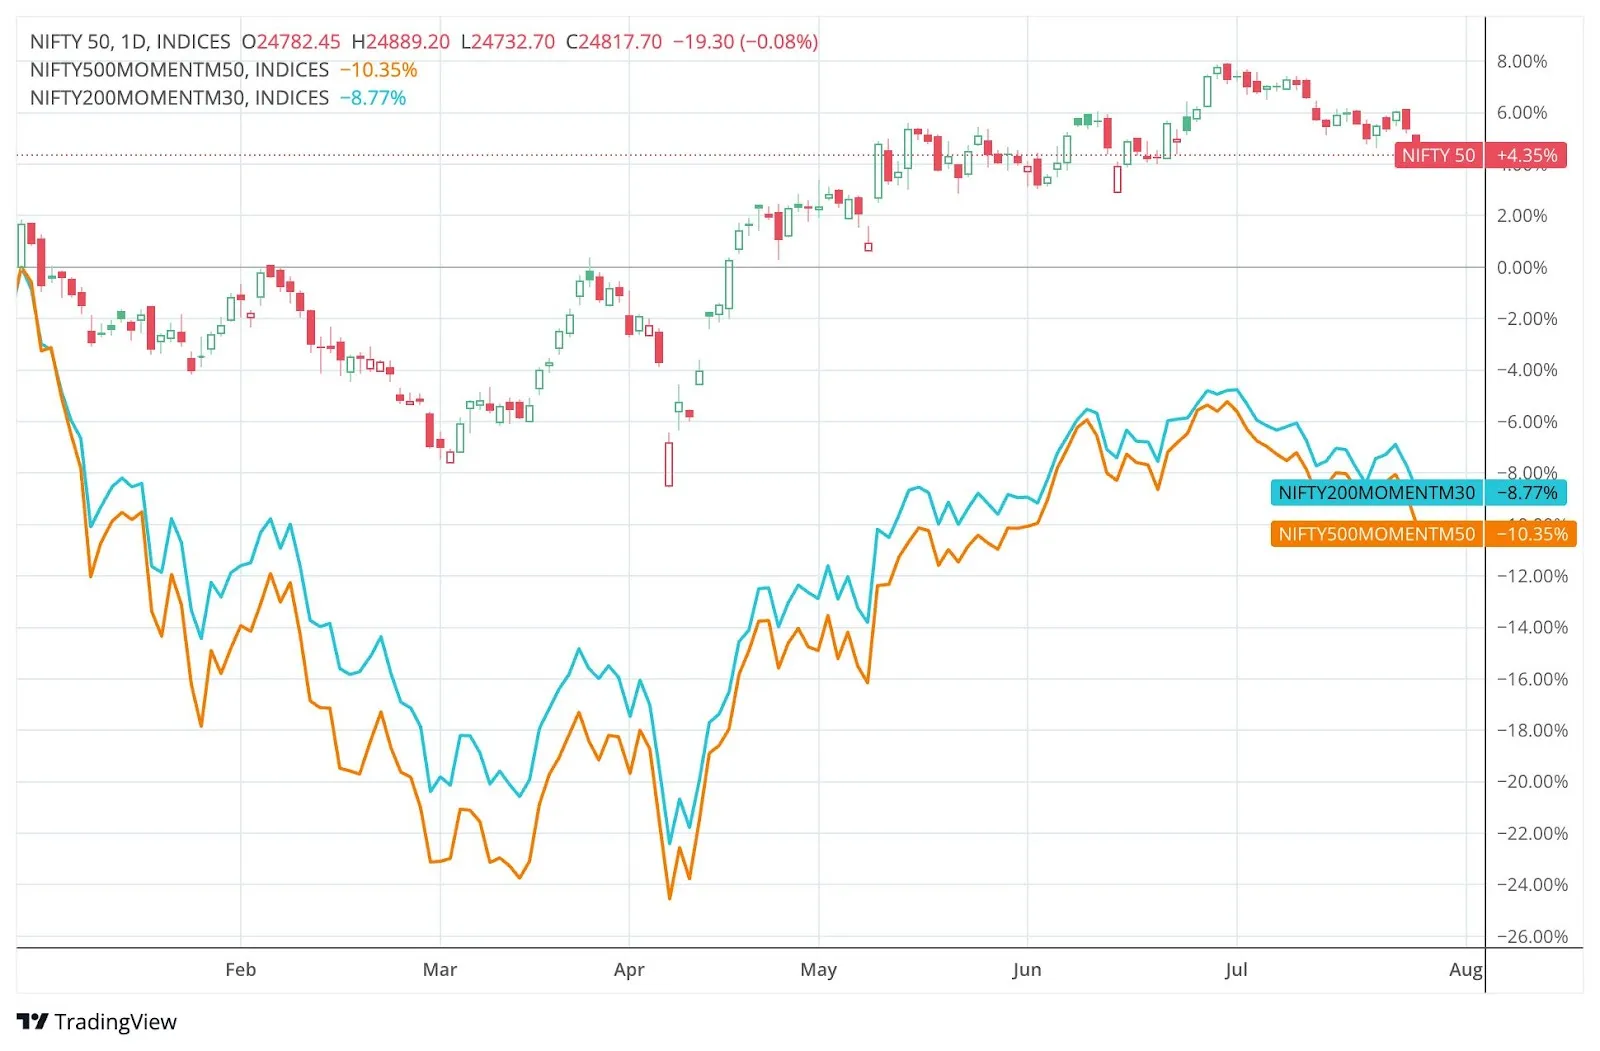
Yet, into 2025, momentum seems to have stalled. The once-unflappable factor has significantly underperformed, prompting an anxious question: Is something fundamentally broken with momentum? Do these drawdowns represent the end of its edge, or just its latest test?
The short answer: momentum is working exactly as designed, but is experiencing a severe—though not unprecedented—painful phase. Let’s unpack the causes of this underperformance, integrate long-term quantitative data on Momentum 200 Index drawdowns, and examine why the discipline to stay the course is most crucial when the going gets tough.
Three critical themes have combined to disrupt momentum’s normally smooth run:
Momentum relies on clear and persistent trends—where winners keep winning and laggards keep falling behind. But 2025 has seen a parade of sector rotations and briefly-lived leadership episodes:
Defensive sectors like FMCG and pharma topped returns early in the year as uncertainty loomed in January–February.
Cyclicals—such as banks and capital goods—took the baton from March–April thanks to post-election optimism.
Mid- and small-caps experienced a turbocharged yet fleeting rally in May–June, only to reverse sharply as risk appetite vanished.
This stop-start pattern produces whipsaws and “false positives” for systematic trend-following models, forcing them to sell recent laggards and buy recent winners—just as the market reverses course. For rule-based strategies, this environment is uniquely punishing.
By design, momentum strategies frequently overweight:
High-beta names—stocks prone to larger swings.
Richly valued, fast-moving sectors—often mid- and small-caps, or thematic plays with recent strong performance.
When volatility spikes or sentiment quickly sours—as it did around the May-June reversal—these stocks are often the first to tumble, deepening drawdowns. Such risk is inextricably linked to momentum; chasing returns comes with the cost of steeper, faster drops during market turbulence.
The first half of 2025 has been defined by “macro noise”:
Election volatility and coalition uncertainty shook confidence and decoupled moves from underlying business fundamentals.
Central bank surprises in both the US and India sparked abrupt interest rate adjustments, rattling risk-taking sentiment across global markets.
Global events—geopolitical flare-ups, commodities volatility—have added a constant undertone of unpredictability.
When markets are whipped around by headlines instead of lasting company or industry trends, momentum signals lose clarity and conviction.

To better understand if today’s downturn is truly an outlier (or just part of an established rhythm), let’s examine the major historical drawdowns in the Nifty 200 Momentum 30 Index since 2010.
Start | Trough | ENd | Drawdown | Days to Trough | Recovery Time | Recovery/Drawdown |
2020-02-19 | 2020-03-23 | 2020-09-17 | -34.21% | 33 | 178 | 5.4 |
2024-09-27 | 2025-04-07 | - | -31.79% | 192 | ||
2021-10-18 | 2022-06-20 | 2023-08-29 | -28.39% | 245 | 435 | 1.8 |
2010-11-10 | 2011-12-20 | 2012-11-09 | -26.34% | 405 | 325 | 0.8 |
2015-08-06 | 2016-02-25 | 2016-07-28 | -22.74% | 203 | 154 | 0.8 |
2018-08-29 | 2018-10-26 | 2020-01-10 | -16.76% | 58 | 441 | 7.6 |
2013-07-15 | 2013-08-28 | 2013-10-08 | -14.05% | 44 | 41 | 0.9 |
2016-10-10 | 2016-12-26 | 2017-01-23 | -13.59% | 77 | 28 | 0.4 |
2015-04-13 | 2015-05-07 | 2015-07-10 | -10.86% | 24 | 64 | 2.7 |
2010-01-18 | 2010-05-25 | 2010-07-20 | -10.50% | 127 | 56 | 0.4 |
Average | 141 | 191 | 2.3 |
What Does the Data Reveal?
Is a longer fall followed by a faster recovery? Or does it take even longer to climb back? Here’s what history says:
Sharp drops, slow climbs:The COVID crash (“2020–03”) saw a lightning-fast 34% drawdown in just a month, but required more than 5 times as long (178 days) to reclaim old highs—a Recovery/Drawdown Ratio of 5.4.
Extended pain, sometimes quicker healing:In 2010–2011, markets took 405 days to bottom out but recovered in only 325—a ratio of 0.8. This suggests that once a lasting new market leadership emerges after a long, grinding fall, the snapback can be abrupt.
Current drawdown is already long and deep:The 2024–2025 slump, at 192 days and -31.8%, remains unrecovered as of August 2025. While this trajectory is severe, history says recovery is likely, though timing is uncertain.
No clear “rule”—market context matters:Some modest drawdowns (2018–19) took years to recover due to persistent choppiness and absence of clear new trends, while some steeper ones healed faster.
Averages for the top ten drawdowns:
Days to trough: 141
Recovery time: 191
Recovery/Drawdown Ratio: about 2.3
The key insight: The process of recovering can take as long—or much longer—than the fall itself, especially when new trends take time to assert themselves. Patience pays, but sometimes over frustratingly long periods.
Momentum isn’t broken. In fact, it’s “failing” in exactly the manner history and the math says it should—during times of fleeting trends, macro shocks, and crosscurrents. The factor’s long-term edge is a payoff for those willing to accept extended periods of underperformance in exchange for sharp catch-ups when the market finds new, durable winners.
Consider:
2009, 2016, 2020, and now 2024–25: Each episode of acute drawdown was followed by periods of robust outperformance. The latest drawdown is part of this cyclicality.
Other strategies have their seasons of pain too: value underperforms when growth explodes, low-vol suffers during risk-seeking bull runs.
Momentum’s edge is earned precisely for enduring these tough stretches—not by avoiding them.
Systematic investing means following the rules—especially when they feel wrong. The worst returns for trend-followers typically precede strong rebounds as new leadership takes shape. Jumping ship risks missing that crucial turnaround.
The data proves: Big drawdowns happen. So do big recoveries. Investors who quit at the trough rarely benefit from the subsequent rally.
Diversify factor exposures, position size conservatively, and rebalance per your plan. Don’t overreact to headlines or predictions—let the data and process drive decisions.
Blending momentum with other factors (value, low-volatility, quality) smooths the ride during momentum’s dry spells. But history says momentum’s pain is the price for its long-term outperformance.
The persistent, rules-based nature of momentum remains unchanged. What we see in 2025 is not the end of momentum as a strategy—it is a vivid reminder that every long-term edge comes with hard stretches where faith and patience are tested.
“Momentum doesn’t promise smooth sailing—it promises long-term reward for those who stay the course.”
For the disciplined and data-driven investor, these episodes are not reasons to abandon momentum—but rather the moments that ultimately create its return premium. As trends inevitably return, those holding steady will be positioned to reap the benefits.
Stay systematic. Stay diversified. Stay the course. The next trend is always closer than it seems.
Discover investment portfolios that are designed for maximum returns at low risk.
Learn how we choose the right asset mix for your risk profile across all market conditions.
Get weekly market insights and facts right in your inbox

It depicts the actual and verifiable returns generated by the portfolios of SEBI registered entities. Live performance does not include any backtested data or claim and does not guarantee future returns.
By proceeding, you understand that investments are subjected to market risks and agree that returns shown on the platform were not used as an advertisement or promotion to influence your investment decisions.
"I was drawn to Wright Research due to its multi-factor approach. Their Balanced MFT is an excellent product."

By Prashant Sharma
CTO, Zydus
By signing up, you agree to our Terms and Privacy Policy
"I was drawn to Wright Research due to its multi-factor approach. Their Balanced MFT is an excellent product."
By Prashant Sharma
CTO, Zydus
Skip Password
By signing up, you agree to our Terms and Privacy Policy
"I was drawn to Wright Research due to its multi-factor approach. Their Balanced MFT is an excellent product."
By Prashant Sharma
CTO, Zydus
"I was drawn to Wright Research due to its multi-factor approach. Their Balanced MFT is an excellent product."
By Prashant Sharma
CTO, Zydus
Log in with Password →
By logging in, you agree to our Terms and Privacy Policy
"I was drawn to Wright Research due to its multi-factor approach. Their Balanced MFT is an excellent product."
By Prashant Sharma
CTO, Zydus
Log in with OTP →
By logging in, you agree to our Terms and Privacy Policy
"I was drawn to Wright Research due to its multi-factor approach. Their Balanced MFT is an excellent product."
By Prashant Sharma
CTO, Zydus
Answer these questions to get a personalized portfolio or skip to see trending portfolios.
Answer these questions to get a personalized portfolio or skip to see trending portfolios.
(You can choose multiple options)
Answer these questions to get a personalized portfolio or skip to see trending portfolios.
Answer these questions to get a personalized portfolio or skip to see trending portfolios.
Answer these questions to get a personalized portfolio or skip to see trending portfolios.
(You can choose multiple options)
Investor Profile Score
We've tailored Portfolio Management services for your profile.
View Recommended Portfolios Restart


