
Macro-economic factors such as GDP, trade balance and unemployment often move stock markets. Strong numbers for these factors usually signal economic growth which generally translates to more profits for companies, and more profits tend to grow the value of stocks. If you are investing in stocks, it is important to keep an eye on these numbers as they can often predict whether the market as a whole will go up or down. We have built our model based on machine learning to draw on this relationship and predict the monthly and quarterly Nifty index risk and return, on the basis of which to decide our portfolio allocations.
Economic Rationale
The relevance of a few of the selected macroeconomic variables and their effect on the stock market is discussed below.
Inflation - Inflation is measured by changes in the Consumer Price Index (CPI) and a high rate of inflation increases the cost of living. It exhibits a negative relationship with stock markets as consumer spending decreases, ruining corporate profits.
Industrial Production -Industrial production presents a measure of overall economic activity in the economy. An increase in IIP signifies an increase in production of the industrial sector, influencing expected future cash flows, that leads to increase in the profit of industries and corporations.
Dollar Price - The entire import and export process of any country depends upon the exchange rate of its currency. On average, export-oriented companies are adversely affected by a stronger domestic currency while import-oriented firms benefit from it.
Foreign Investment - FIIs plays an important role for an emerging economy such as India, as FII exerts a larger impact on the domestic financial markets in the short run and a real impact in the long run. It has been observed that Sensex increases when there are positive inflows of FIIs & vice versa.
Experiment
In this experiment we try to build an asset allocation using the macro economic model to predict future risk and returns. We start with a base case of standard 60/40 allocations and then try to better the model using prediction of market regimes using macroeconomic signals. We try a simple linear regression and a boosted tree based classification.
Base Case
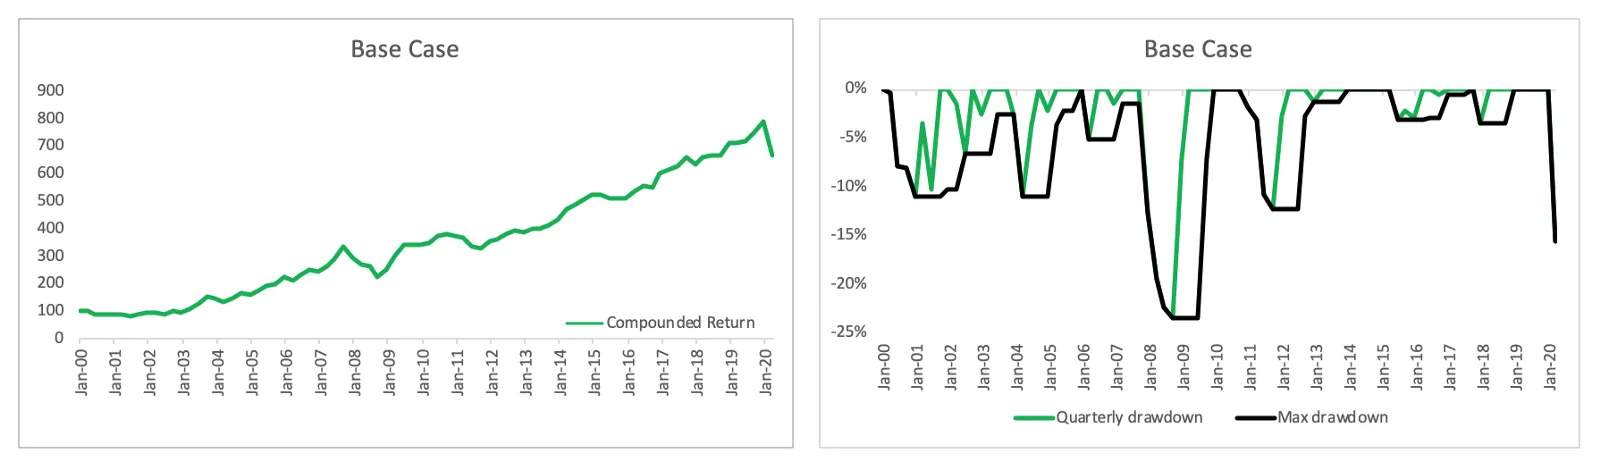
As a base case, we consider a portfolio that invested 60% in equities and 40% in bonds at the beginning of the year 2000 and made no changes to the portfolio allocation thereafter. The compounded return and the maximum drawdown for the portfolio are shown below.
Linear Regression
Having collected reliable data going back twenty plus years we initially explored the correlations between various features and ran a preliminary Linear Regression Analysis.
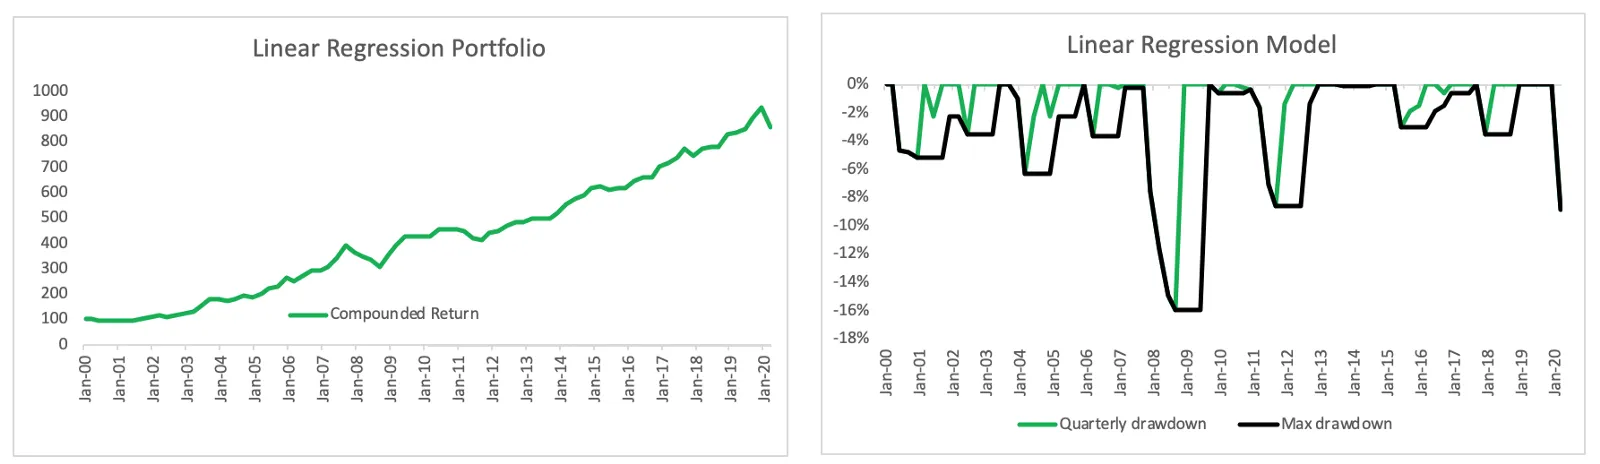
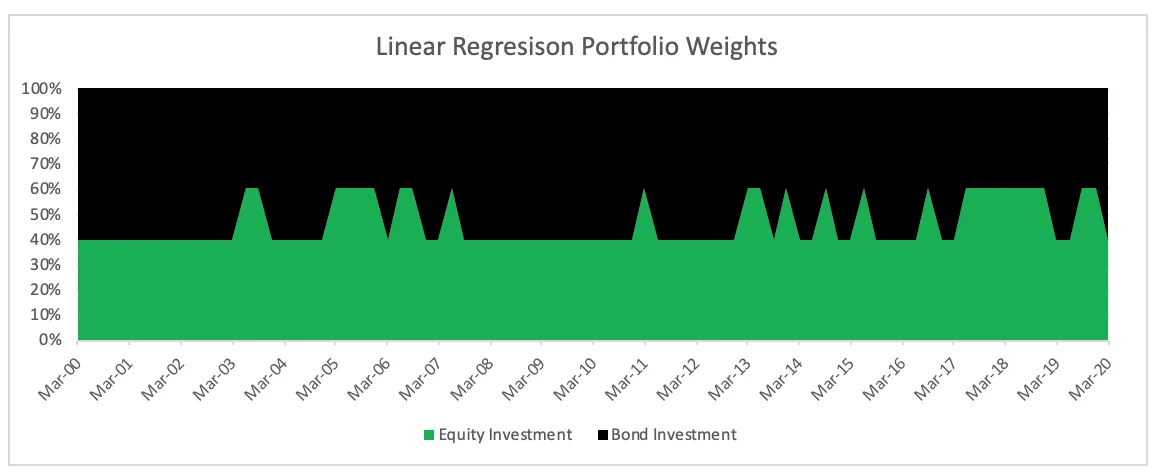
Using the values of coefficients obtained from the regression we forecasted the nifty risk and return for the next month and quarter. Based on our forecasted values for nifty return and risk, we found an optimal threshold value on the basis of which to divide our portfolio allocation between equities and bonds. 60% allocation of the portfolio was done to equities and the rest to bonds when the forecasted values showed high nifty return or low risk and vice versa.
Shown below is the performance of the portfolio that alternated between the allocation of equity and bond based on the predicted nifty risk. The strong numbers for the various features such as the Sharpe ratio and drawdown gave us confidence in the methodology and a basis to build on.
In the graph below we see how and when the portfolio allocation interchanged between the two assets.
Boosted Classification
For the next set of models, we converted the continuous returns of Nifty into categorical values on the basis of periods of high returns, moderate returns, and low returns.
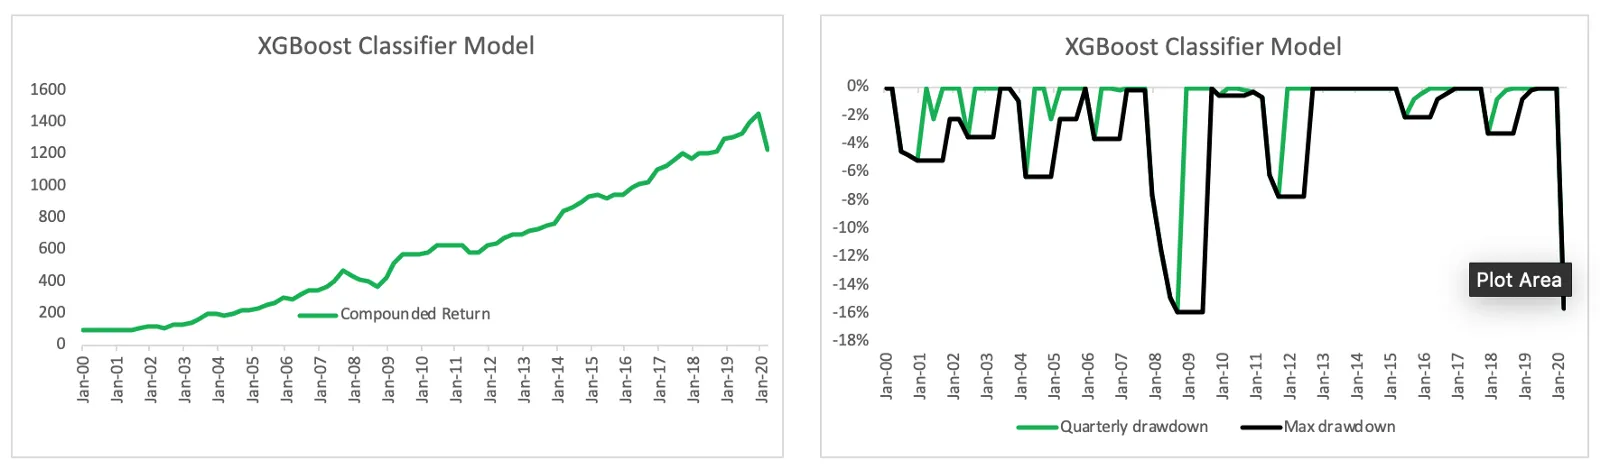
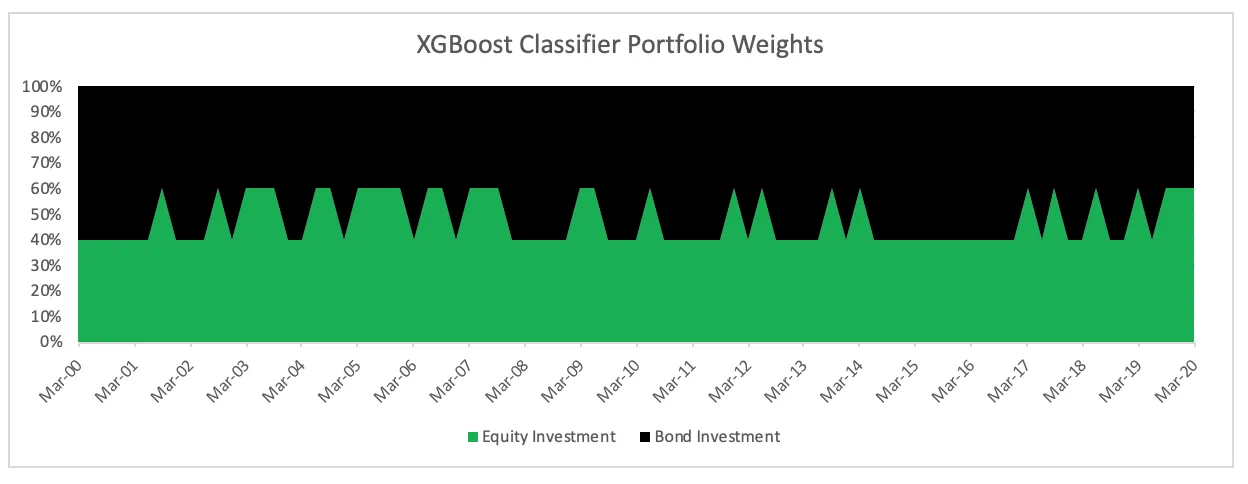
We ran various classification models such as the Random Boost Classifier and the XGBoost classifier using Python and observed the accuracy of our model on test sets while improving its accuracy by tuning the parameter values for better results. We used the classifiers to forecast whether the next period will be one of high returns or low returns and used those forecasted values as a basis for the allocation of portfolio funds into equities and bonds in the same 60–40 ratio as stated earlier.
The performance of the portfolio that alternated assets allocation on the basis of predictions for nifty return by the XGBoost classifier model is illustrated below.
In the graph below we see how and when the portfolio allocation interchanged between the two assets.
Conclusion
The Sharpe ratio and the maximum drawdown for the three portfolios are displayed in the table below and we can see that the regime models offered better returns per unit of risk, with the gradient boosted tree model giving the best Sharpe ratio.

This is a basic model of the regime model that we use to govern asset allocation in our portfolio construction at Wright Research — Multi Factor Tactical portfolio. The effectiveness of the model is specially seen in risk scenarios like March 2020, where it saves the portfolio from market risk by moving away from high equity allocation.