India’s capital-expenditure (capex) cycle is transitioning from a sharp, policy-led acceleration to a steadier consolidation - still running at elevated levels and increasingly shaped by a handful of powerful themes. Balance sheets are healthier than a decade ago, order books are robust in policy-aligned pockets, and operating margins for execution leaders have expanded. Valuations across capital goods are still rich, which means bottom-up stock picking and patience matter.
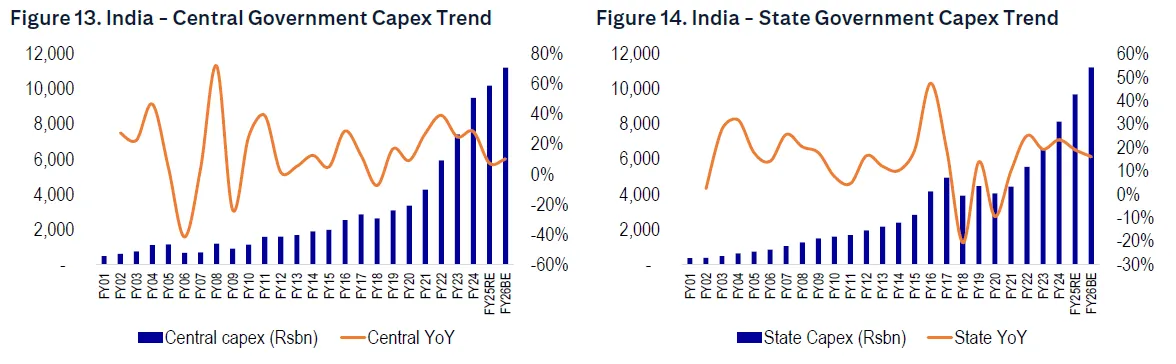
After 3 strong years of central capex acceleration, capex while high, appears to be consolidating. The Centre’s FY26 Budget Estimate keeps capital outlay broadly flat on the FY25 BE surge, with Railways and Roads steady at large, programmatic run rates. One bright spot is Urban Affairs: FY26 allocation jumps 31% YoY to ₹376 billion, supporting metros/MRTS, AMRUT, and e-bus programs - good for electrification, T&D, automation, and building-tech ecosystems. The government is holding the capex line on a high base to lock in multiplier effects across logistics, mobility, and energy infrastructure. There is fiscal headroom and phasing can introduce periodic slow patches. Capex momentum on a monthly basis is varying by ministry - Roads and Railways are tracking close to plan, while Communications is adjusting from a very low prior base. Total central capex YTD shows a double-digit rebound versus last year’s dip.
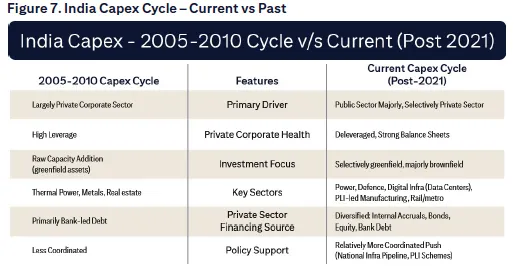
The last big capex wave (pre-GFC) was a debt-heavy, private-sector boom, concentrated in commodity and real-estate capacity. It ended with deleveraging and a long investment drought. The post-2021 cycle is different: it began with public capex doing the heavy lifting—providing visible demand while corporate balance sheets healed—and it is moving into higher-tech, productivity-enhancing assets (smart grids, high-speed and urban transit, electronics, defence electronics, digital infrastructure). Today, the state leads with infrastructure capex, corporate balance sheets are healthier, and spending is skewed toward productivity and tech content—smart grids over just transformers; high-speed systems over basic rail. That shift supports both margins and export competitiveness over time, as local supply chains climb the value curve.
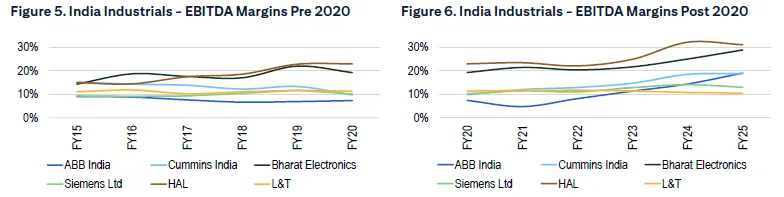
That shift has already shown up in capital goods margins—leaders have expanded EBITDA through mix upgrades (data-centre power, automation), localisation, export scale from Indian plants, and operating leverage on multi-year volume growth.
A “steady-high” government capex profile keeps EPC order pipelines visible, sustains tender activity in rail/metro electrification, signalling, and rolling stock, and supports civil/electrical packages in highways and urban infra. For suppliers, it translates into healthier working capital cycles than the last downturn, but also tighter competition and stronger qualification filters.
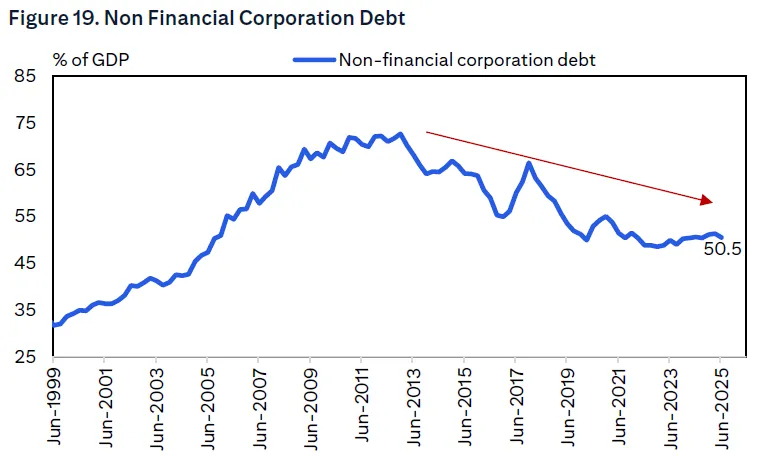
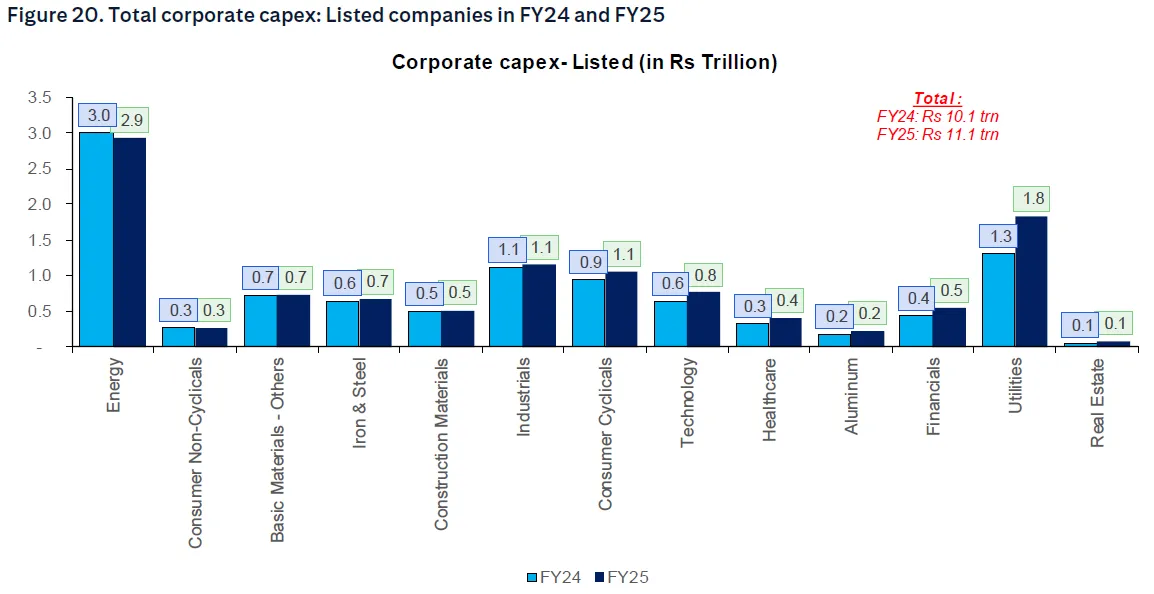
Corporate balance sheets today are cleaner than in the 2005 to 2010 boom - deleveraged, with better cash flows and lower legacy stress. Post-COVID, corporate capex has rebounded strongly (listed +24% in FY24), then cooled to +10% in FY25 - energy, consumer, and basic materials slowed, while utilities and real estate held up.
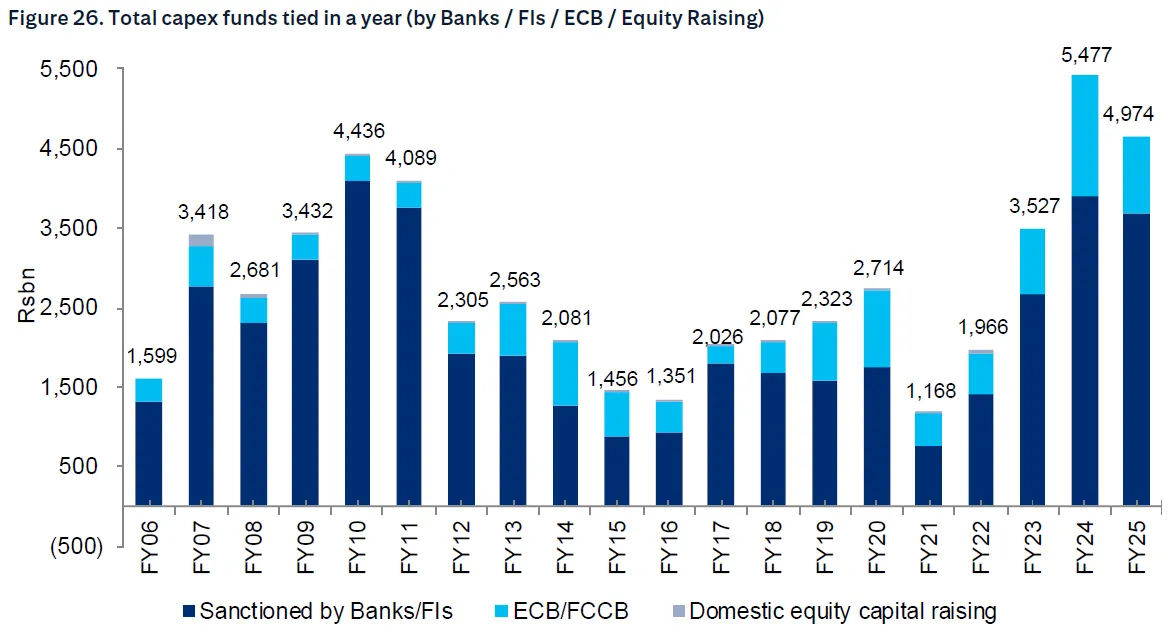
On the private side, the broad revival remains selective. RBI’s capex-intent indicator shows funds tied up by companies declined 9% in FY25 to ₹4.97 trillion across 1,584 projects (vs ₹5.48 trillion/1,500 projects in FY24). Within that mix, power leapt to 40% of bank/FI sanctions while roads fell to 9% from last year’s 25%. . Average sanctioned project size also moderated to ~₹4.0 billion (from ~₹4.9 billion in FY23), reflecting more granular, distributed projects alongside a few marquee programs. While this suggests normalization after a strong FY24, it remains well above trough years and shows the breadth of projects in the pipeline.
The composition pivot is striking: the power sector accounted for 40% of bank/FI sanctions in FY25, up from 24% in FY24 and 20% in FY23, pointing to a clear energy-security and grid-modernisation upcycle. Roads & bridges fell to 9% (from 25%/37% in FY24/FY23), unsurprising given the Centre’s already front-loaded highway buildout and greater PPP selectivity.
With power’s share in sanctions jumping to 40%, the next leg of the energy build is in plain view. The drivers are multi-fold: rising peak demand, renewable targets needing evacuation capacity, grid stability investments, smart metering, storage, and a measured thermal catch-up to bridge intermittency. This shift is visible in both sanctions and listed capex outlays, and it will likely stay elevated through 2030 as demand and electrification intensify.
Between 2015 and 2025, defence policy has been overhauled to prioritise “Buy Indian/IDDM,” expand Positive Indigenisation Lists, seed innovation in defence, and cluster capabilities in dedicated defence corridors. The tangible outcome: a predictable multi-year demand corridor that justifies R&D and localisation capex, complemented by export pipelines. This is doctrinal, not episodic, and points to sustained orders in radars, sensors, electronic warfare, autonomous platforms, and network-centric integration over the next decade.
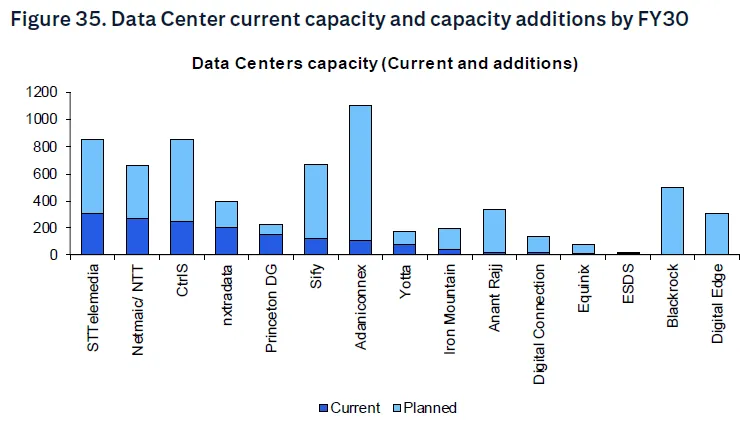
India’s data center (DC) capacity was ~1,350 MW as of April 2025, with >3,500 MW expected to be added by FY30—pushing total capacity beyond 5 GW. Mumbai (53%), Chennai (15%), and Delhi-NCR (11%) are the main clusters today. Announced projects imply $20–25 billion of DC capex by FY30, and crucially, roughly ~70% of DC capex sits in equipment and fit-outs for power, cooling, and white space—an addressable TAM of ~$15–17 billion for capital goods by 2030.
Policy tailwinds include the DPDP Act and the pending National Data Center Policy (infrastructure status, dedicated DC zones, reliable power/connectivity, FDI facilitation). India’s per-smartphone data usage is already among the world’s highest and is estimated to rise further, while AI workloads amplify compute intensity. Put together, localization, latency, and AI create durable demand for hyperscale and edge capacity.
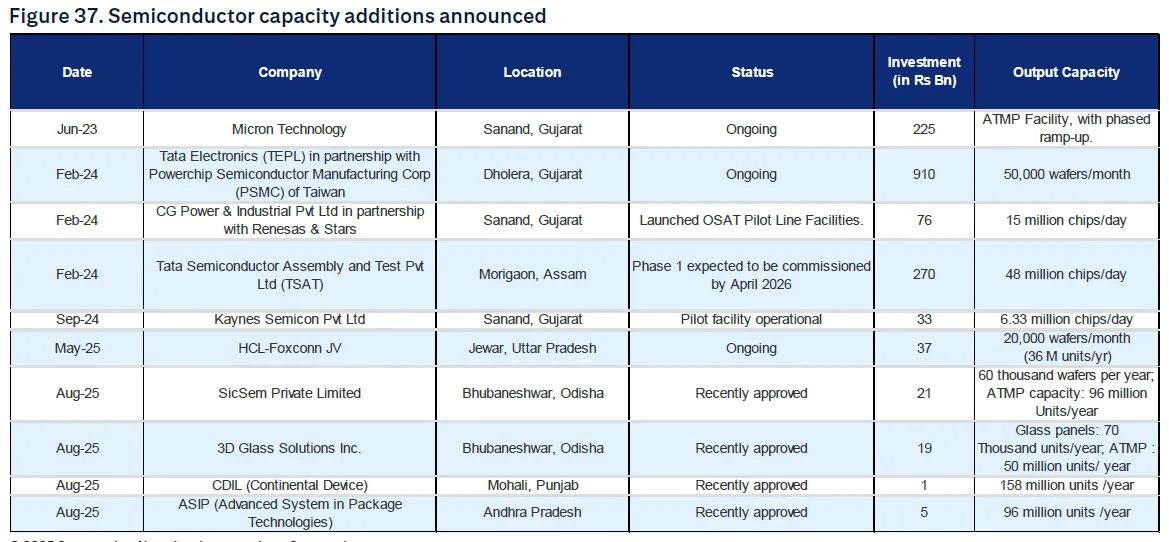
Since the launch of the India Semiconductor Mission (₹760 billion PLI envelope), approvals have accelerated. As of August 2025, 10 semiconductor projects have been approved, with an expected capital outlay of ~₹1.6 trillion spanning a mix of fabs, OSAT/ATMP, and component ecosystems.
Electronics manufacturing is also broadening beyond final assembly into components, supported by the Electronics Component Manufacturing Scheme that offers turnover-linked and capex-linked incentives (25% of eligible incremental capex), including hybrid options with employment linkages - substantial catalysts for upstream tooling, test, and materials capex.
Historic series show a transformation: Railway capex up from ~₹678 billion (FY20) to ₹2.4 trillion (FY24) and steady at ₹2.52 trillion (FY25/26), while Roads climbed from ~₹684 billion (FY20) to ~₹2.64–2.72 trillion (FY24–26). These programs underpin multi-year opportunities in electrification, signalling, rolling stock (Vande Bharat variants, locomotives), bridges, and highways again, not accelerating from the FY24 surge but retaining a strong pipeline.
Urban metro systems are in an upcycle with new corridors, extensions, and multi-modal integration which are being supported by higher urban affairs allocations and multilateral funding. Margins hinge on bid discipline and localisation depth (doors, bogies, propulsion, SCADA).
Fiscal headroom and phasing: If revenue streams underperform or priorities shift, central/state capex could be re-profiled within the year. The FY26 BE shows consolidation—not renewed acceleration—so the mix matters more than the absolute print.
Commodity/supply-chain volatility that squeezes fixed-price EPC margins.
Execution capacity: A higher number of smaller projects requires more concurrent execution bandwidth at EPCs, OEMs, and utilities; supply-chain or permitting bottlenecks can slow drawdowns.
Global demand and trade uncertainty: Export-linked private capex remains sensitive to external cycles; that partly explains the unevenness in energy/consumer/basic materials in FY25.
Institutionalized programs: Railways, roads, and urban allocations are embedded in multi-year plans and backed by institutional execution capacity.
Policy-linked themes: Defence, DCs, semiconductors, and components have clear policy scaffolding and dedicated incentives; these are strategic, not purely cyclical.
Healthier corporates: Listed-company capex rose in FY25 and leverage is lower than a decade ago; when utilization tightens, the private upcycle can broaden from a position of strength.
India’s capex engine is maturing. The Centre is keeping capex high on a bigger base; states and PSUs are steadying the flow; private capex is real but concentrated in policy-backed pools and utility-grade assets. This is a “fewer, bigger, better” cycle potentially. The capex beta has migrated from “everything infra” to well-placed thematics and execution leaders. Order books in power T&D, automation, defence electronics, and DC infrastructure should compound steadily, but dispersion will be high.
India’s capex story in FY26 is less about re-accelerating aggregates and more about where and how the money is being spent. The Centre remains the flywheel; Railways, Roads, and Urban keep the pipeline thick; power and grid-tech are becoming the private-capex fulcrum; defence has doctrinal tailwinds; DCs and semiconductors give India a credible shot at higher-tech manufacturing and export relevance. The data show a consolidation at high levels, not a cliff. With healthier corporate balance sheets and policy-anchored thematics, the medium-term setup remains constructive—even if the near-term private upturn stays selective and execution-intensive.
Discover investment portfolios that are designed for maximum returns at low risk.
Learn how we choose the right asset mix for your risk profile across all market conditions.
Get weekly market insights and facts right in your inbox

It depicts the actual and verifiable returns generated by the portfolios of SEBI registered entities. Live performance does not include any backtested data or claim and does not guarantee future returns.
By proceeding, you understand that investments are subjected to market risks and agree that returns shown on the platform were not used as an advertisement or promotion to influence your investment decisions.
"I was drawn to Wright Research due to its multi-factor approach. Their Balanced MFT is an excellent product."

By Prashant Sharma
CTO, Zydus
By signing up, you agree to our Terms and Privacy Policy
"I was drawn to Wright Research due to its multi-factor approach. Their Balanced MFT is an excellent product."
By Prashant Sharma
CTO, Zydus
Skip Password
By signing up, you agree to our Terms and Privacy Policy
"I was drawn to Wright Research due to its multi-factor approach. Their Balanced MFT is an excellent product."
By Prashant Sharma
CTO, Zydus
"I was drawn to Wright Research due to its multi-factor approach. Their Balanced MFT is an excellent product."
By Prashant Sharma
CTO, Zydus
Log in with Password →
By logging in, you agree to our Terms and Privacy Policy
"I was drawn to Wright Research due to its multi-factor approach. Their Balanced MFT is an excellent product."
By Prashant Sharma
CTO, Zydus
Log in with OTP →
By logging in, you agree to our Terms and Privacy Policy
"I was drawn to Wright Research due to its multi-factor approach. Their Balanced MFT is an excellent product."
By Prashant Sharma
CTO, Zydus
Answer these questions to get a personalized portfolio or skip to see trending portfolios.
Answer these questions to get a personalized portfolio or skip to see trending portfolios.
(You can choose multiple options)
Answer these questions to get a personalized portfolio or skip to see trending portfolios.
Answer these questions to get a personalized portfolio or skip to see trending portfolios.
Answer these questions to get a personalized portfolio or skip to see trending portfolios.
(You can choose multiple options)
Investor Profile Score
We've tailored Portfolio Management services for your profile.
View Recommended Portfolios Restart


