


India's market leadership is rotating across market caps, sectors and factors while the headline index stays range-bound. The clearest evidence sits in earnings breadth, the dominance of domestic flows, and the sharp first-half lead of the value factor. A systematic portfolio can respond through gradual, rules-based shifts rather than a fixed bet on the recent winner.
What is actually changing in India's market in 2026?
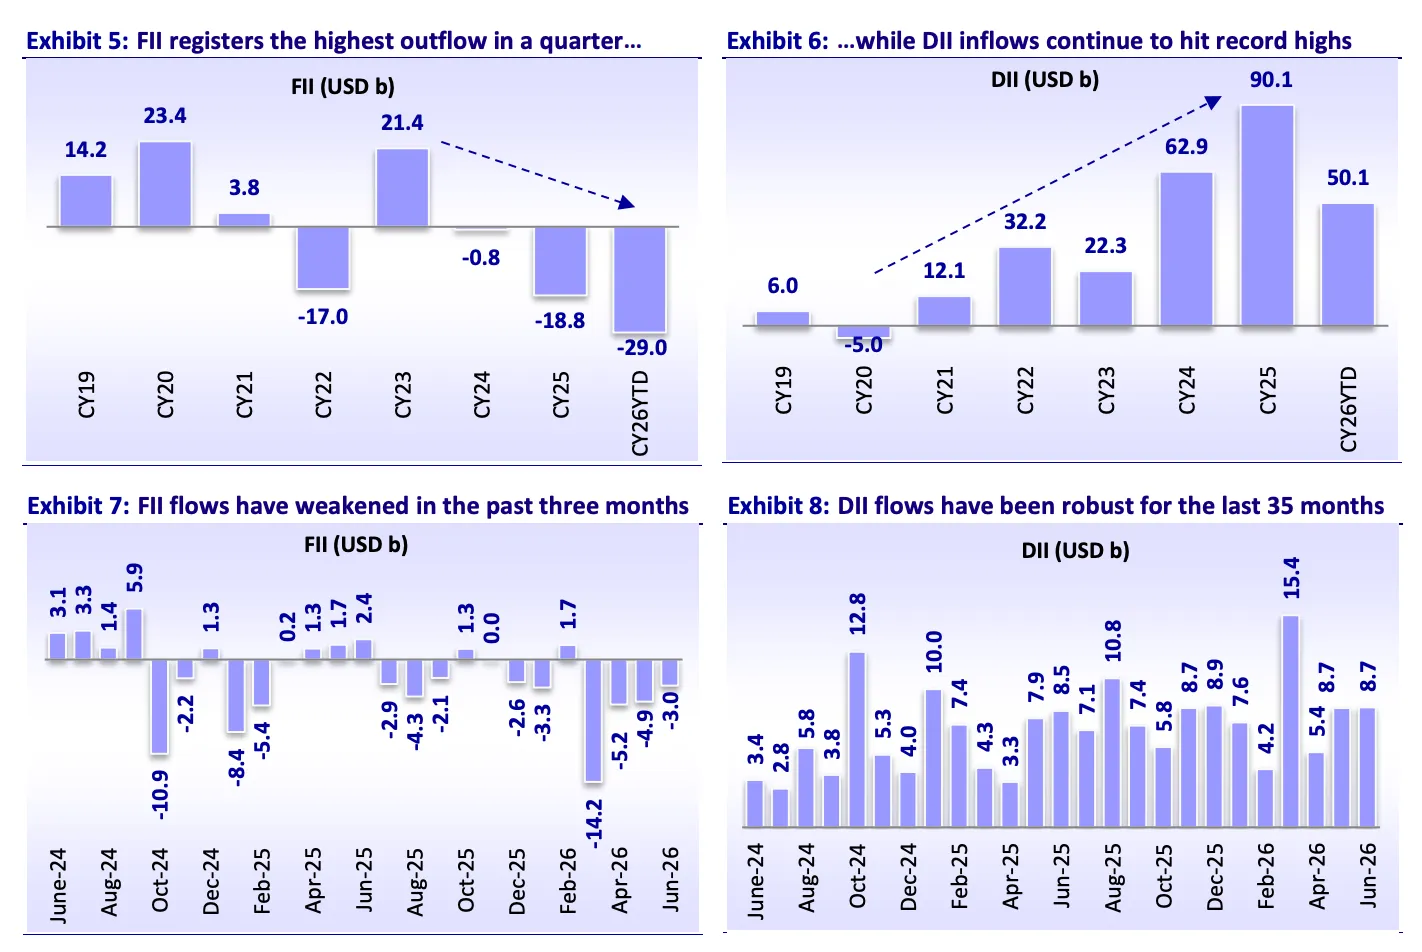
India entered 2026 after nearly two years of consolidation. The Nifty 50 gained about 10% in 2025 and lagged emerging markets, which rose around 30% over the same period. Foreign investors have withdrawn roughly USD 60 billion over the past 21 months, one of the longest selling stretches on record. Domestic institutions absorbed that supply. Mutual funds, insurers and pension funds invested a record USD 90 billion in 2025, and monthly systematic investment plan contributions reached a record Rs 31,781 crore in June 2026.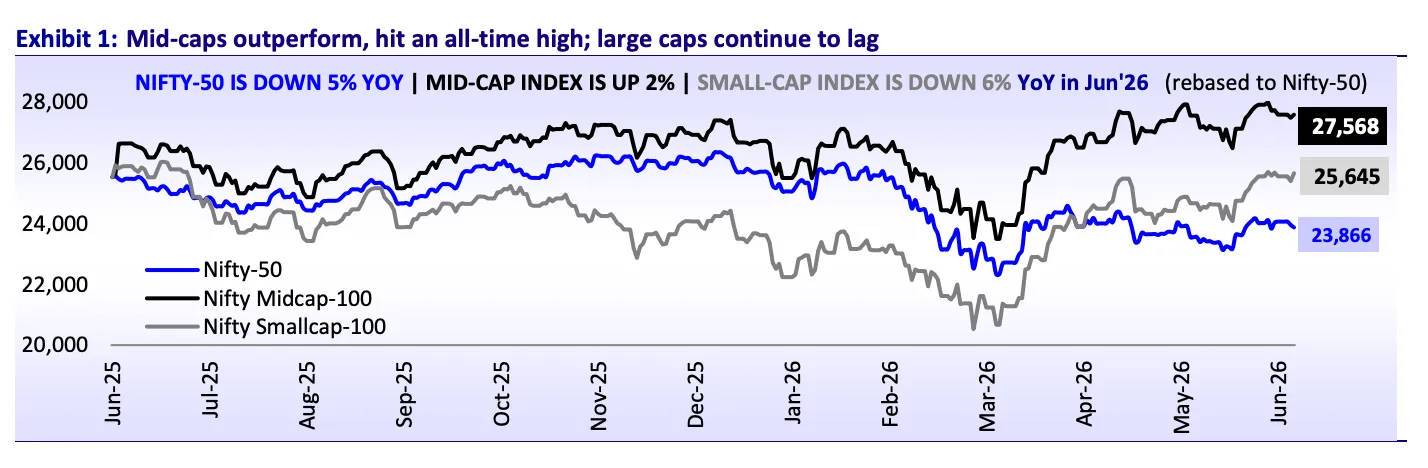
There is a change in market leadership with India's wide performance gap versus global equities, a correction in large-cap valuations, improving earnings expectations for FY27 and FY28, and a recovery led by selected mid-cap and small-cap companies.
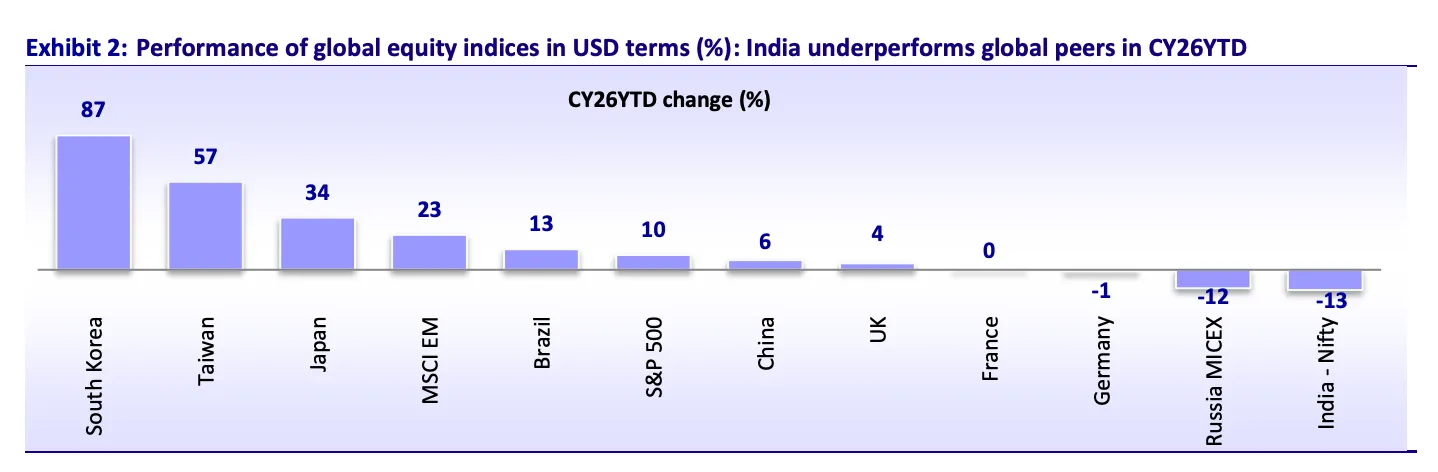
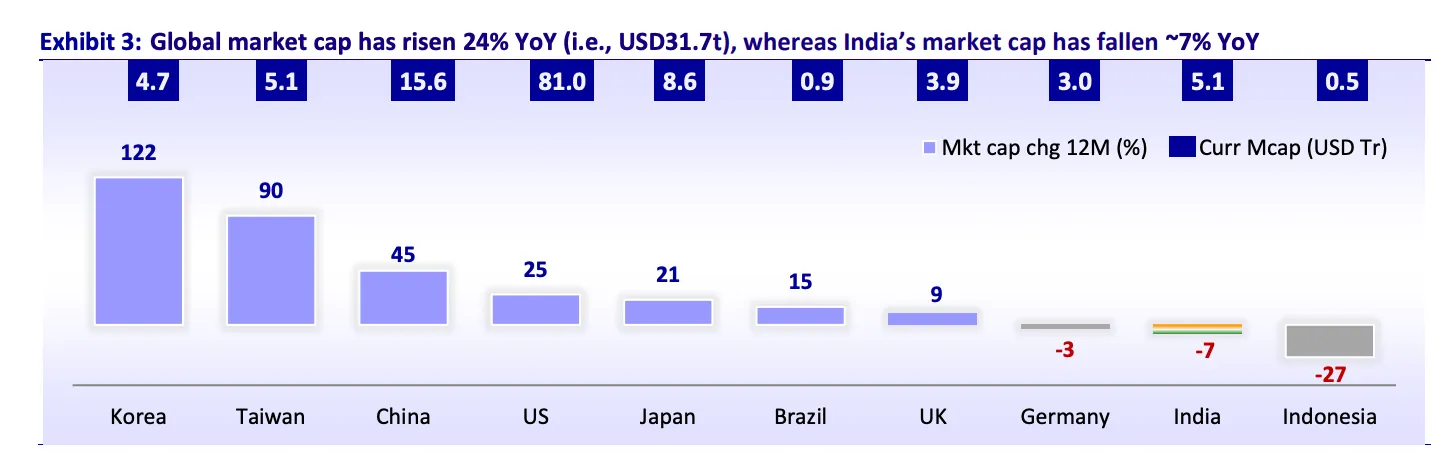
Global market cap has continued to rise, while India’s market cap has fallen to around 7%.
 During April to June 2026, domestic institutions bought about USD 23 billion of equities while foreign investors sold about USD 13 billion. This flow structure has reduced the market's daily dependence on foreign capital.
The central point is direct. The index can stay range-bound while leadership changes underneath it. An investor who treats the market as a single directional call can miss the more important movement across sectors, factors and company types.
See what markets are pricing in
Live indices, sector moves and market breadth — the backdrop to every story we publish.
Why does market-cap rotation matter now?
Large caps carried the heaviest foreign selling and the weakest earnings momentum in several index heavyweights. Through June 2026, the Nifty 50 fell about 9%, while the Nifty Midcap 100 rose 2% and the Nifty Smallcap 100 rose 6%. That short-term picture sits on top of stronger three-year annualised returns of about 20% for mid caps and 18% for small caps, against 6% for the Nifty 50.
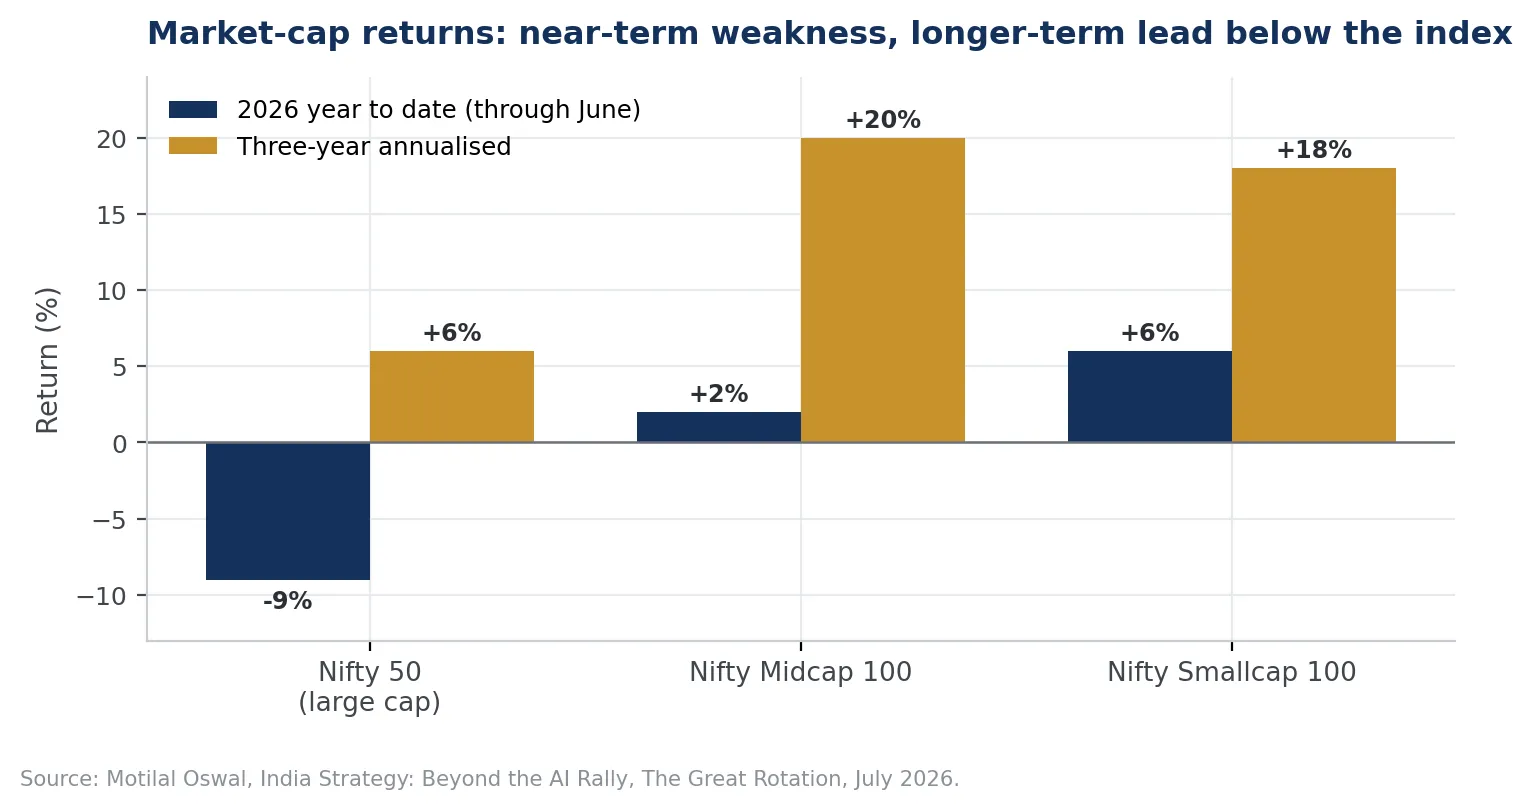
This divergence does not justify a blanket move into every smaller company. Valuations across many mid-cap and small-cap segments remain above their long-term averages. The stronger signal comes from earnings breadth. Smaller companies with visible capacity expansion, market-share gains, improving margins or formalisation-led growth can climb through the market-cap ranks. Companies with weak balance sheets or narrative-driven valuations stay exposed.
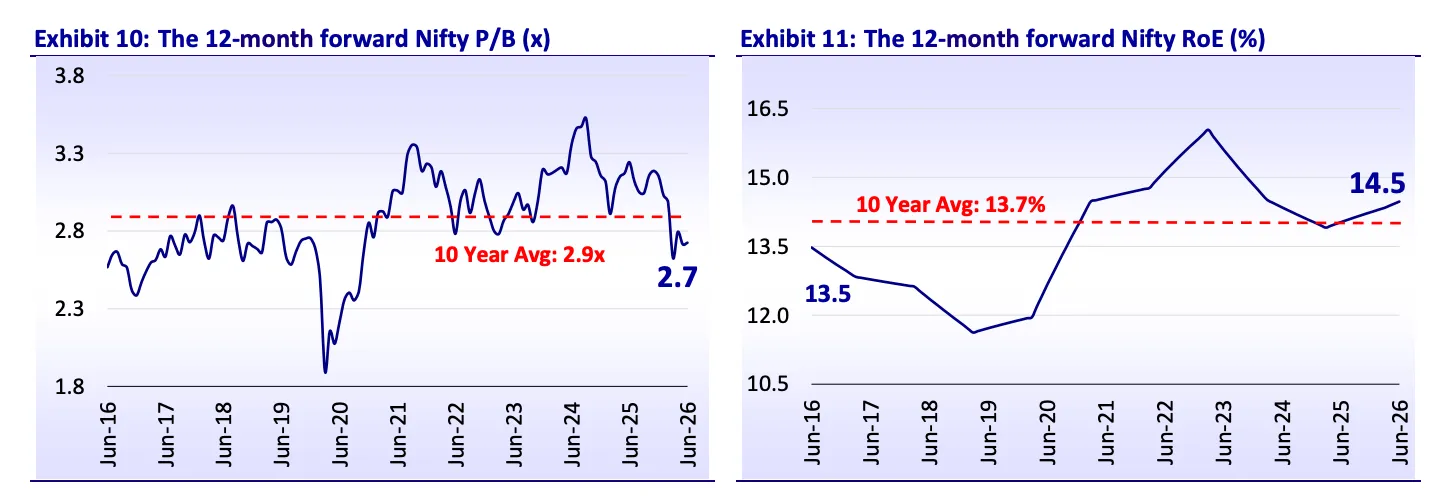
A systematic strategy therefore needs two separate decisions. The first is the split across large, mid and small caps. The second is stock selection inside each segment. A fixed market-cap allocation lags when earnings leadership moves. A fully discretionary shift introduces timing risk. A rules-based allocation that reads earnings revisions, trend strength, volatility and valuation spreads gives a more controlled middle path.
Which factors are leading in 2026, and will it last?
Factor returns through June 2026 show a clear change in leadership. The Nifty500 Value 50 Total Return Index gained about 14% in the first half of the year, while the broad Nifty 500 fell about 2%. Quality, momentum and multifactor indices were modestly negative over the same period, and low volatility was close to flat.
Value leadership reflects the recovery in financials, metals, energy-linked businesses and selected public-sector names. These sectors entered the year with lower valuation multiples and higher sensitivity to improving earnings. Value also gained from a reduced market appetite for expensive growth.
The longer record stays balanced. Over five years, the Nifty500 Momentum 50 delivered about 21.7% annualised, the multifactor index about 19.6%, low volatility about 17.3%, quality about 16.9% and value about 16.8%. A single half-year of value leadership describes the present regime rather than a permanent one.
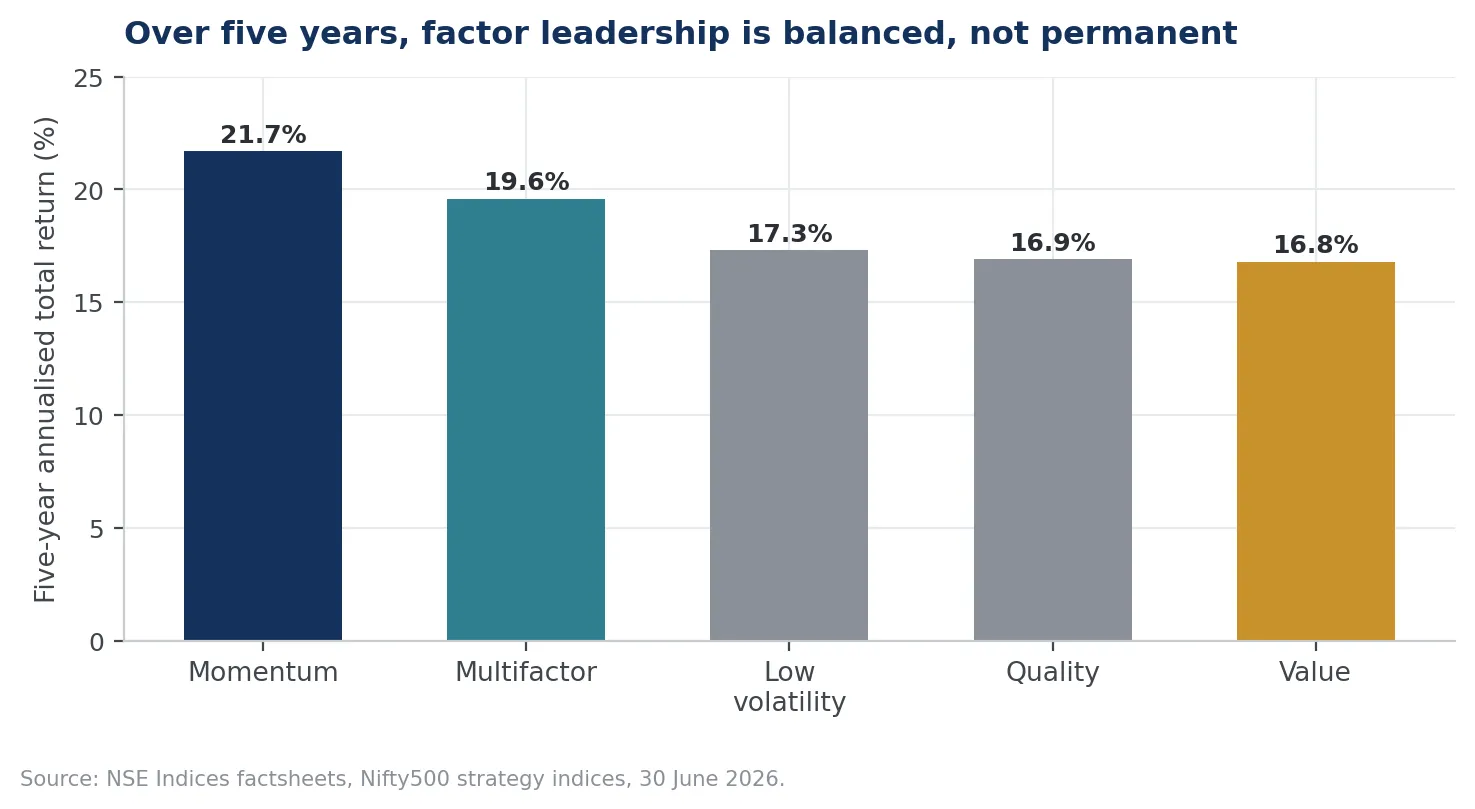
Factor performance is cyclical because each factor carries distinct sector, market-cap and macro exposures. Momentum captures persistent trends and can reverse quickly when leadership changes. Value benefits when earnings recover from depressed expectations. Quality holds up when balance-sheet strength matters more. Low volatility protects capital during stress and can lag in fast recoveries. Multifactor strategies blend these signals to reduce dependence on any single regime.
How do the major factors differ?
The table below sets out what each factor rewards, where it stands in 2026, and the main risk it carries inside a portfolio.
Factor | What it rewards | 2026 signal | Main portfolio risk |
|---|---|---|---|
Value | Low price relative to earnings, book value, sales and dividends | Strongest factor in the first half of 2026 | Concentration in financials and commodities |
Momentum | Persistent, volatility-adjusted price trends | Positive recent quarter, weak year to date | Sharp reversals when leadership shifts |
Quality | Profitability, low leverage and stable earnings | Lagging value during the cyclical recovery | Higher valuation and sector concentration |
Low volatility | More stable historical return patterns | Close to flat year to date | Can lag during sharp rebounds |
Multifactor | Balanced exposure across several signals | Moderate short-term performance | Complexity and hidden factor overlap |
Get research like this in your inbox
The week’s research that mattered, in five minutes. Joined by 2L+ investors.
Which sectors carry the earnings support?
The 2026 rotation has a clear earnings component. expects Nifty 50 profit growth of about 10% year on year in the June 2026 quarter, with financials, metals, telecom, technology, capital goods, retail and consumer durables providing support. Financials alone account for about 44% of profits.
There are 4 key variables: earnings revisions, valuation relative to history, price trend and balance-sheet quality.
A sector becomes more attractive when earnings expectations improve, valuations stay reasonable, and market breadth confirms the move.
A strong price move without earnings support gives a weaker signal.
Low valuations paired with continued downgrades can stay cheap for a long time.
How should a systematic strategy respond to the rotation?
A rotation framework should avoid binary calls. The practical goal is to adjust exposure as evidence builds. This can run through a composite score that blends momentum, quality, value and low volatility, with sector and market-cap constraints applied on top.
Momentum should read six-month and twelve-month trends after adjusting for volatility.
Quality should include profitability, leverage and earnings stability.
Value should compare earnings, book value, sales and dividends against price.
Low volatility should trim exposure to stocks with unstable return patterns.
Earnings revisions add a forward-looking layer, since analyst upgrades and downgrades often lead reported growth.
Portfolio construction matters as much as stock ranking. Factor portfolios can build quiet concentration in a handful of sectors. The Nifty500 Momentum 50 held about 1/3rd of its weight in capital goods at the end of June 2026. The Nifty500 Value 50 carried heavy exposure to financial services, oil and gas, metals and power. A strategy that adds factors without concentration limits can recreate a sector bet under a factor investing strategy.
A robust process caps stock and sector weights, limits turnover, applies liquidity filters and rebalances on a set schedule. It can layer a regime overlay that shifts factor weights gradually. Rising earnings breadth and improving cyclicals can lift value and momentum exposure. Falling breadth and higher volatility can lift quality and low-volatility weights. The portfolio stays diversified while it responds to changing evidence.
What should investors monitor through the rest of 2026?
Five signals will show whether this rotation broadens or fades.
Earnings delivery comes first. FY27 estimates assume a recovery after subdued FY26 growth. Revisions after quarterly results will show whether the recovery spreads across companies or stays concentrated in financials and commodities.
Foreign flow intensity comes second. India can perform with neutral foreign flows because domestic assets have grown so large. Industry mutual fund assets reached Rs 82.22 lakh crore at the end of June 2026. A slowdown in foreign selling can still lift large caps, since foreign portfolios cluster in index heavyweights.
Market breadth comes third. A healthy rotation shows a rising share of stocks above medium-term moving averages, improving revisions across several sectors, and reduced reliance on a small group of winners.
Valuation dispersion comes fourth. The opportunity improves when companies with similar growth prospects trade at very different multiples. Systematic strategies can use that gap to shift toward better combinations of growth, quality and price.
Primary market supply comes fifth. Large public issues and capital raises can absorb secondary-market liquidity. The effect depends on the pace of issuance, investor participation and the quality of new listings.
How can a portfolio avoid reacting too late?
Rotation signals often appear after a factor has already delivered strong returns. A disciplined process should therefore set thresholds before it changes allocations. These can include the share of stocks with positive earnings revisions, the relative trend of factor indices, valuation spreads between the cheapest and most expensive groups, and shifts in realised volatility. The aim is to confirm a persistent change rather than react to one month of performance.
Rebalancing frequency should match the speed of the underlying signals. Price momentum moves faster than profitability or balance-sheet quality. Earnings revisions usually sit between the two. A practical model can update signals monthly while capping portfolio changes through turnover bands. Existing holdings stay until their scores fall below an exit threshold. New stocks enter only when their combined score clears a higher inclusion threshold. This reduces unnecessary trading and improves stability.
Investors should also separate portfolio review from outcome review. A factor can underperform over a short window while the process stays valid. The relevant questions are whether the portfolio still follows its stated rules, whether risks sit within limits, and whether the regime indicators have moved. That distinction keeps recent returns from becoming the only trigger for change.
Track the factors behind this research
Momentum, value, quality and low-vol — updated factor performance for Indian markets.
What is the takeaway for portfolio construction?
India's 2026 market is moving from a broad index story toward a differentiated earnings and factor cycle. Large-cap indices can recover as foreign selling eases, while selected mid-cap and small-cap companies keep gaining from stronger earnings. Value has led the first half, while momentum and multifactor approaches hold stronger five-year records.
The appropriate response is a structured rotation process. Portfolios should weigh market-cap exposure, sector earnings, factor strength and valuation together, and avoid permanent allocations built on a single recent winner. A diversified factor model with disciplined rebalancing can take part in changing leadership while it controls concentration and turnover. The market's direction still matters. The distribution of returns across companies now carries more information, which puts strategy selection and portfolio construction close to the centre of returns.


