Indian money flows show a market driven by three forces: foreign investor selling, domestic mutual fund resilience, and sector rotation toward cyclicals in equity recoveries. April 2026 shows that Nifty’s current correction of about 14.8% is slightly deeper than the historical average correction of 13.7% during continuous three-month declines since 2008. The report also shows that Nifty has historically delivered average returns of 8.0% over three months and 17.4% over six months after such corrections.
This makes the flow picture mixed. Foreign portfolio investors are reducing Indian equity and debt exposure, while domestic investors continue to allocate through mutual funds and SIPs. The equity market has recovered unevenly, with metal, realty, financials, and construction-linked sectors showing stronger leadership than defensives.
How Deep was the Nifty Correction, and What Does History Say About Recovery?
The Nifty has fallen approximately 14.8% during its current correction cycle, which has lasted 4 consecutive months through March 2026. This decline slightly exceeds the historical average drawdown of 13.7% recorded across similar episodes since 2008, where the index fell continuously for at least three months.
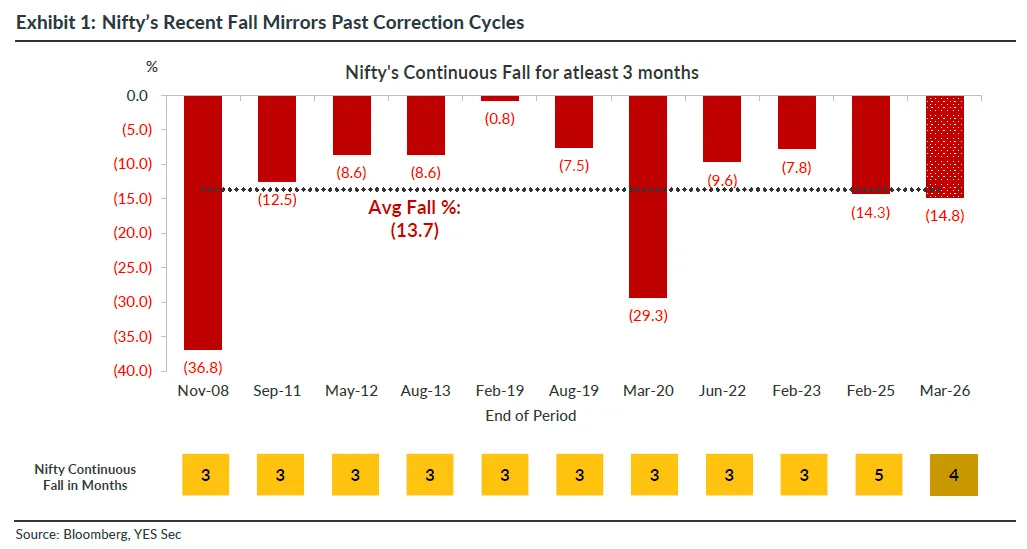
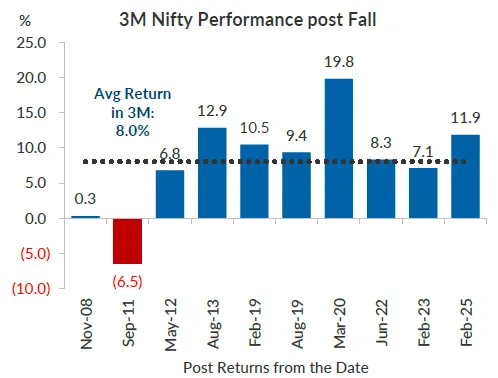
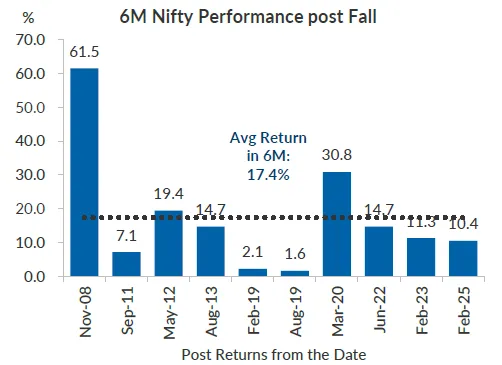
In an analysis of 10 such correction episodes since November 2008, the Nifty has delivered an average return of 8% over the subsequent three months and 17.4% over six months following a correction. The distribution of outcomes is positively skewed: post-2008, the three-month return was 0.3%, while post-March 2020, it was 19.8%. On the six-month horizon, the November 2008 correction was followed by a 61.5% rally, and the March 2020 correction produced a 30.8% gain.
Once a correction extends beyond 3 months, forward return probabilities improve meaningfully. Time in the market matters more than timing the bottom.
Which Sectors Lead During Market Recoveries?
Three-Month Recovery: Cyclicals Dominate
Sectoral analysis of past corrections reveals that cyclical sectors consistently lead in the first three months of a rebound. Construction Materials have the highest consistency rate, outperforming the Nifty in 9 out of 10 instances. Financial Services follow at 8 out of 10, and Automobiles also register 8 out of 10. Capital Goods, Chemicals, Construction, Metals and Mining, and Services each show outperformance in 7 out of 10 instances.
These are domestic growth proxies and operating leverage plays. The early recovery is driven by sectors tied to India's investment cycle and credit expansion.
Six-Month Recovery: Construction Materials Stay on Top
Over a six-month horizon, leadership broadens but remains anchored in the same cyclical core. Construction Materials have a perfect track record, outperforming in 10 out of 10 occasions. Banks and Financial Services show strong persistence at 9 out of 10. Capital Goods, Chemicals, Healthcare, and Services each register 7 out of 10.
Defensives Lag in Rebounds
IT stands out with the weakest hit rate, outperforming in only 1 out of 10 instances over three months. Consumer Durables (3/10) and FMCG (5/10) also underperform. The logic is straightforward: defensive sectors decline less during sell-offs, which limits their scope for sharp rebounds. IT's underperformance also reflects its sensitivity to global cycles rather than domestic recovery dynamics.
Area | Latest signal | Figure |
Nifty correction | Current fall | 14.8% |
Historical three-month correction average | Since 2008 | 13.7% |
Nifty average return after correction | Three months | 8.0% |
Nifty average return after correction | Six months | 17.4% |
FII equity flow | March 2026 | USD -12.7 billion |
FII equity flow | April 2026 to report date | USD -4.4 billion |
Equity mutual fund inflow | March 2026 | INR 405 billion |
SIP collection | March 2026 | INR 32,087 crore |
Equity-oriented MF AUM | March 2026 | INR 32.0 trillion |
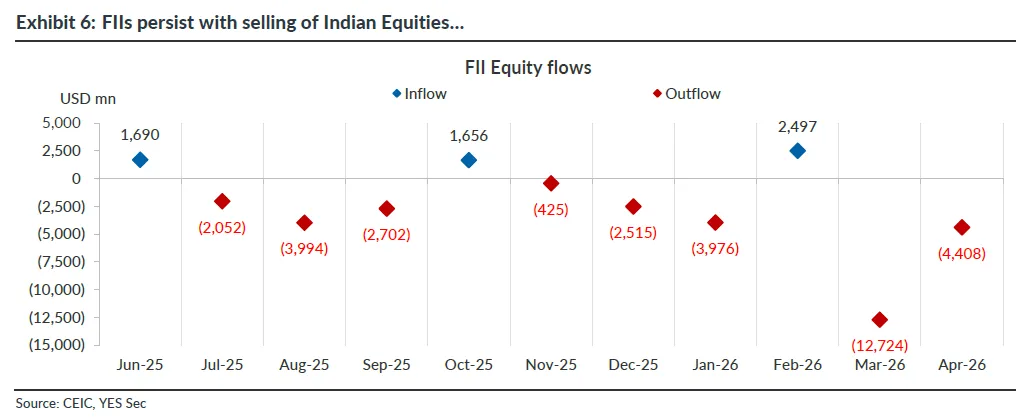
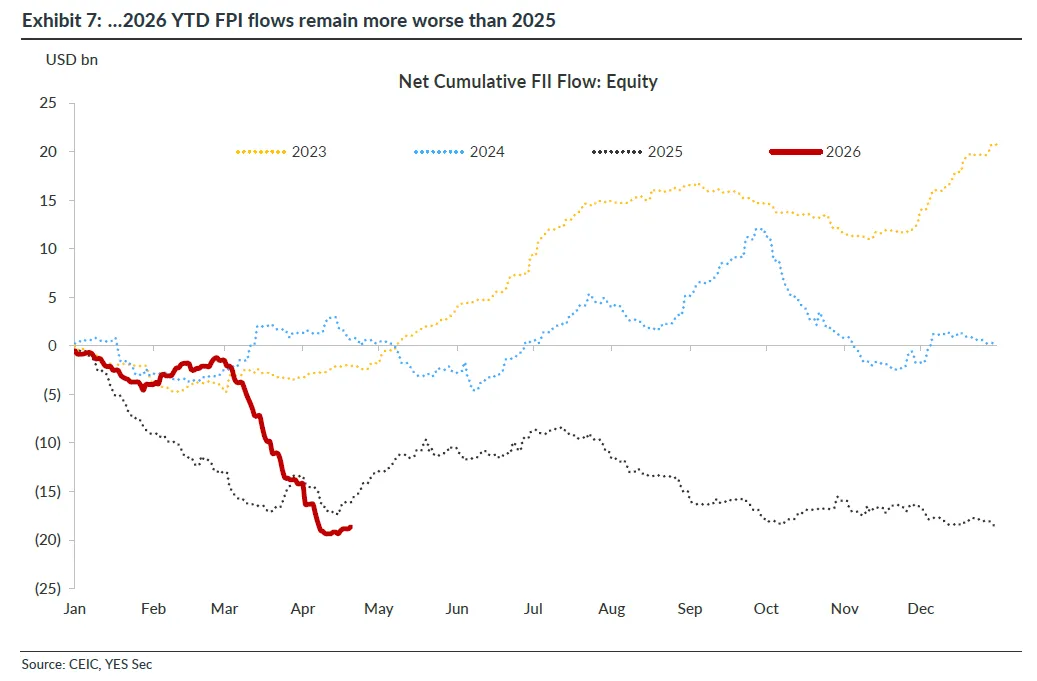
What Are FIIs Doing With Indian Equities?
Foreign institutional investors have been persistent net sellers of Indian equities. In April 2026 (through April 21), FII equity outflows totalled $4,408 million. This follows outflows of $12,724 million in March 2026 and $3,976 million in February 2026. The cumulative 2026 year-to-date FPI flow trajectory is tracking worse than the already negative 2025 pattern.
How are foreign investors moving money in Indian equities?
Foreign institutional investors have continued to sell Indian equities. In April 2026 (through April 21), FII equity outflows totalled $4,408 million. This follows outflows of $12,724 million in March 2026 and $3,976 million in February 2026. The cumulative 2026 year-to-date FPI flow trajectory is tracking worse than the already negative 2025 pattern. The month-over-month decline in the value of FPI Indian equity holdings hit $129 billion in March 2026, one of the steepest erosions on record, comparable only to the $119 billion drop during March 2020.
Where Are FPIs Selling?
Financial Services bore the brunt of FPI selling across the last five fortnights. During the fortnight ending April 15, 2026, Financial Services saw outflows of $2,051 million, followed by Consumer Services ($571 million), Healthcare ($480 million), Automobiles ($397 million), and Oil, Gas and Consumable Fuels ($359 million).
Despite the selling, the weight of Financial Services in FPI holdings has actually increased by 0.57% in FY27 (through April 2026), driven by price appreciation in underlying stocks. Capital Goods weight rose by 0.29%, Metals and Mining by 0.13%, Power by 0.12%, and Construction by 0.11%. On the other side, Oil, Gas and Consumable Fuels saw the largest weight decrease at 0.57%, followed by Healthcare (0.48%), Telecommunication (0.29%), FMCG (0.16%), and IT (0.08%).
Why Is Foreign Capital Leaving Asia?
Foreign capital outflows from Asian equities (excluding Japan and China) have reached their steepest levels in several years. Rising US inflation swap rates, the Iran conflict, and reduced odds of Fed easing are all contributing factors. US 1-year and 2-year inflation swaps have climbed sharply since January 2026, reducing the attractiveness of emerging market assets relative to US fixed income.
After nearly seven consecutive weeks of outflows, India saw a modest net inflow of $106 million in the week ending April 24, 2026, per Elara Capital's Global Liquidity Tracker. Weekly outflows from India-focused funds have dropped from a peak of $1.2 billion to around $180 million. This stabilisation does not yet signal a strong recovery in foreign investor confidence.
How Are Domestic Mutual Funds Responding?
Domestic mutual fund flows remain a stabilising force. Net inflows into growth/equity-oriented mutual fund schemes totalled INR 405 billion in March 2026, the highest since July 2025 (INR 427 billion). Equity AUM stood at INR 32 trillion in March 2026, down from a peak of INR 35.7 trillion in November-December 2025.
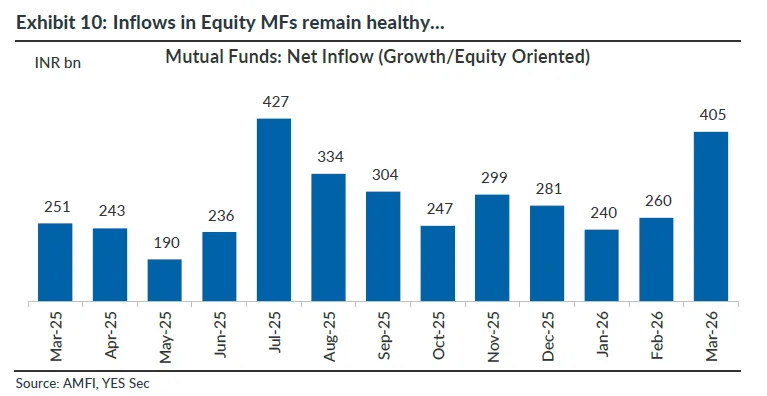
Flexi Cap funds dominated inflows at INR 100.5 billion in March, followed by Small Cap funds (INR 62.6 billion), Mid Cap funds (INR 60.6 billion), and Large and Mid Cap funds (INR 53.1 billion). Equity Linked Saving Schemes saw outflows of INR 4.4 billion.
AMFI’s March 2026 monthly note stated that total mutual fund industry AUM was INR 73.73 lakh crore, up 12.2% year on year, although down 10.1% month on month. SIP collections reached INR 32,087 crore in March 2026, according to AMFI data reported by Times of India.
This shows that retail and household-linked money is still entering market-linked products despite volatility. The flow is more visible through SIPs and diversified equity funds than direct equity purchases.
What Are Mutual Funds Buying and Selling?
Mutual funds rotated toward large-cap financials and telecom during March 2026. The top stocks where MFs increased holdings include HDFC Bank (INR 10,543 crore), Bharti Airtel (INR 8,700 crore), ICICI Bank (INR 5,148 crore), Eternal (INR 3,521 crore), and Reliance (INR 3,485 crore).
On the selling side, MFs reduced exposure to commodities, PSU/energy, and select midcaps. The largest decreases were in BPCL (INR 1,214 crore), MCX (INR 894 crore), GVT&D (INR 787 crore), IOC (INR 784 crore), and Federal Bank (INR 618 crore). This rotation signals a tilt toward stability over cyclical risk.
How Is Retail Participation Holding Up?
Retail net investment flows into Indian equities have dropped sharply. Year-to-date retail inflows (January through mid-April) stand at INR 29 billion in 2026, compared to INR 220 billion during the same period in 2025 and INR 558 billion in 2024. This marks the weakest retail participation in three years. This also means Indian households are still investing, but the channel has shifted toward mutual funds. SIPs are absorbing regular household savings, while direct retail market buying has slowed.
What Is Happening Across Global Asset Classes?
Risk assets outperformed in the month through April 21, 2026, as oil prices cooled. Silver led with a 14.5% gain, followed by gold at 8.7%. Brent crude fell 16%, and the Dollar Index dropped 1.6%, while EM currencies strengthened 1.9%.
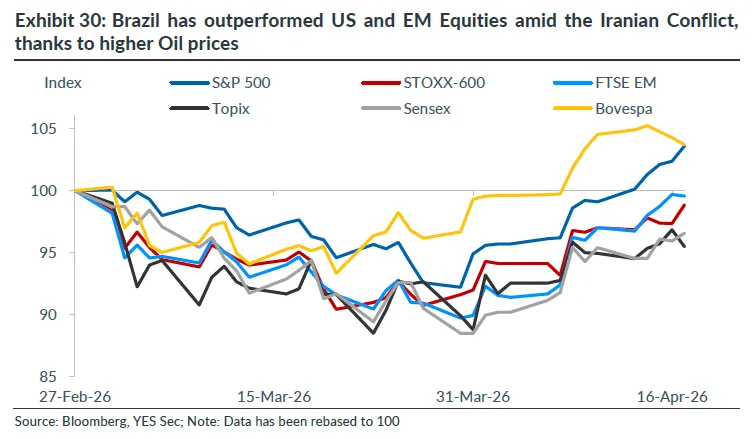
Among equity markets, Brazil (11.3%), Turkey (11%), and Korea (10.1%) led emerging market performance. India gained 6.1%. Among developed markets, the US gained 9.3%, Germany 9.1%, and France 8.7%.
The STOXX Europe 600 to S&P 500 P/E ratio has climbed above its long-term average, reflecting a repricing triggered by the Iran conflict. European equities are turning expensive relative to US stocks for the first time in several years.
What About Indian Debt Markets?
Foreign investors have also reduced Indian debt exposure. Annual net FII debt flow of USD -0.1 billion in 2026, after positive flows of USD 6.6 billion in 2025 and USD 13.1 billion in 2024. Monthly debt flows were negative at USD -0.9 billion in March 2026 and USD -1.9 billion in April 2026.
Debt mutual fund flows were also weak. Income and debt-oriented mutual funds saw net outflows of INR 2.95 trillion in March 2026. Liquid funds saw outflows of INR 1.35 trillion, overnight funds saw outflows of INR 402 billion, and money market funds saw outflows of INR 292 billion.
The debt market message is direct. Short-duration institutional liquidity was being pulled out, while longer-term appetite was selective. The report also shows mutual funds bought INR 124 billion of Indian government securities in April 2026, while public sector banks sold INR 13 billion after large purchases in the earlier months.
How do external flows affect India’s macro position?
India’s external account is supported by services exports and remittances. RBI data reported in March 2026 showed that India’s current account deficit was USD 13.2 billion, or 1.3% of GDP, in Q3 FY26. For April to December 2025, the current account deficit was USD 30.1 billion, or 1.0% of GDP, compared with USD 36.6 billion, or 1.3% of GDP, in the same period a year earlier. Net invisibles receipts rose to USD 221.5 billion from USD 191.0 billion, driven by services and personal transfers.
The Economic Survey 2024-25 said services export growth rose to 12.8% during April to November FY25, compared with 5.7% in FY24. It also stated that gross FDI inflows increased from USD 47.2 billion in the first eight months of FY24 to USD 55.6 billion in the same period of FY25, a 17.9% year-on-year rise.
Conclusion
Indian money flows point to a market where domestic money is more dependable than foreign money in the current phase. FPIs are selling equities and debt, debt funds are seeing large withdrawals from liquid categories, and direct retail equity flows are weak. At the same time, SIPs and equity mutual funds continue to receive large inflows.
The sector signal is also clear. During recovery phases after Nifty corrections, money has historically moved toward construction materials, banks, financial services, automobiles, capital goods, chemicals, construction, metals, and services. Defensive sectors have delivered lower relative leadership during early rebounds.
The broader macro picture remains manageable because services exports and remittances continue to support the current account. The main pressure points are foreign portfolio outflows, debt market withdrawals, and a slower direct retail bid. The main support points are SIPs, equity mutual fund inflows, services exports, and remittances.
About the author

Our Investment Philosophy
Learn how we choose the right asset mix for your risk profile across all market conditions.
Subscribe to our Newsletter
Get weekly market insights and facts right in your inbox