by Siddharth Singh Bhaisora
Published On May 11, 2025
Tensions between India and Pakistan have once again made global headlines. The April 22 attack in Pahalgam killed 26 people — 25 Indian nationals and one Nepali tourist — and marked one of the deadliest terror incidents in recent years. Public sentiment across India has been one of grief and anger, prompting a swift and multi-pronged response from the government. India’s countermeasures included:
Suspension of the Indus Waters Treaty
Closure of the Wagah-Attari Border
Airspace restrictions for Pakistani aircraft
A halt in bilateral trade
These steps, followed by the May 7 military offensive, Operation Sindoor, India launched a bold military response. Operation Sindoor started with striking terror camps across the border in Pakistan and Pakistan-occupied Kashmir (PoK). While this decisive action sent a strong geopolitical message, it has also stirred fresh concerns among citizens, investors, and policymakers alike.
Amidst these developments, it’s vital to pause and analyze what’s happening on the ground — beyond the headlines — and what it could mean for the broader economy, trade flows, and regional stability.
Looking at the impact of 11 major India-Pakistan conflict events from 1990 to 2020 on the BSE Sensex and Foreign Portfolio Investment (FPI) flows we find that the Sensex corrected negatively in 8 out of 11 episodes, with the mean correction being 7.5% and the median correction a milder 3.5%.
There are a few outlier events, such as the 2020 LoC ceasefire violations (which saw a massive -37% correction) which skew the average - this also happened during Covid years. Excluding such anomalies, most events, including major ones like the Kargil War, the Pulwama Attack, and Uri Strikes, caused corrections of less than 5%. This suggests that while markets do react to geopolitical tension, their responses are generally contained and often followed by recovery once clarity emerges.
Event | Year | From | To | Sensex Correction (%) | Sensex vs S&P500 (%) | FPI Equity Flow (Rs '000 cr) |
Insurgency in J&K | 1990 | 1-May-90 | 31-Dec-90 | -3.5 | 7.1 | N.A. |
Kargil War | 1999 | 3-May-99 | 26-Jul-99 | 1.6 | 5.6 | 3.5 |
Parliament Attack | 2001 | 13-Dec-01 | 1-Oct-02 | -13.5 | 16.3 | 3.3 |
Kaluchak Massacre | 2002 | 14-May-02 | 31-May-02 | -9.5 | -8.6 | -0.2 |
Mumbai Train Blast | 2006 | 11-Jul-06 | 31-Jul-06 | -6.3 | -3.7 | 0.4 |
26/11 Mumbai Attacks | 2008 | 26-Nov-08 | 31-Dec-08 | 0.5 | 5.3 | 1.3 |
Pathankot Attack | 2016 | 2-Jan-16 | 31-Jan-16 | -8.4 | 0.6 | -12.2 |
Uri Attack | 2016 | 18-Sep-16 | 29-Sep-16 | -2.7 | -2.7 | 4.9 |
Pulwama Attack & Balakot Airstrikes | 2019 | 14-Feb-19 | 1-Mar-19 | -1.9 | -1.6 | 11.2 |
Revocation of Article 370 | 2019 | 5-Aug-19 | 31-Aug-19 | -1.7 | 1.4 | -15.0 |
2020 LoC Ceasefire Violations | 2020 | 1-Jan-20 | 25-Feb-21 | -37.0 | -6.3 | 213.7 |
Mean | -7.5 | 1.2 | 21.1 | |||
Median | -3.5 | 0.6 | 2.3 |
Yet, when compared to the S&P 500, the Sensex often held up better — showing a mean relative outperformance of 1.2% and a median of 0.6%. This indicates that while domestic investors may have reacted with caution, global comparisons reflected relative investor confidence in Indian markets during these crises.
FPI flows show a more nuanced picture. While some events triggered capital outflows — notably the Revocation of Article 370 and the Pathankot Attack — others like the 2020 LoC Ceasefire Violations witnessed massive inflows (Rs 213.7k crore), possibly because of concurrent macroeconomic tailwinds or a broader risk-on global environment. The mean FPI flow of Rs 21.1k crore and a median of Rs 2.3k crore suggest that while tensions may cause brief hesitations, they don't typically lead to sustained capital flight — unless accompanied by larger macroeconomic instability.
Immediately after these high-impact events, Nifty's performance was mixed:
Negative reactions were observed after the Parliament attack (-0.8%), Uri surgical strikes (-1.2%), and even after the Pulwama-Balakot escalation (+6.3% but following a dip before the event).
The Kargil War, interestingly, saw a sharp +16.5% gain one month later, suggesting that markets may have rallied as uncertainty around the conflict resolution cleared.
26/11 Mumbai Attacks also had a surprising +3.8% gain, possibly reflecting global recovery signals after the 2008 financial crisis bottom.
These examples show that markets don't uniformly react negatively to security threats — much depends on broader macro trends and investor perception of escalation risk.
Event | Date | 1-month before | 1-M after | 3-M after | 6-M after | 12-M after |
Kargil War 1999 | May 3, 1999 | -8.3% | 16.50% | 34.50% | 31.60% | 29.40% |
Parliament Attack 2001 | Dec 13, 2001 | 10.10% | -0.8% | 5.30% | -0.8% | -1.3% |
Mumbai 26/11 Attacks 2008 | Nov 26, 2008 | 9.00% | 3.80% | -0.7% | 54.00% | 81.90% |
Uri Attack & Surgical Strikes 2016 | Sep 18, 2016 | 1.30% | -1.2% | -7.3% | 4.30% | 15.60% |
Pulwama Attack & Balakot 2019 | Feb 14, 2019 | -1.3% | 6.30% | 3.80% | 1.70% | 12.70% |
The medium-term outlook (3-6 months) again presents a mixed but generally resilient picture:
Kargil resulted in +34.5% and +31.6% gains over 3 and 6 months — a strong post-conflict rally.
Pulwama/Balakot shows modest growth — +3.8% at 3 months and +1.7% at 6 months — reflecting stabilization.
Uri attacks triggered a -7.3% dip at 3 months, possibly due to extended geopolitical uncertainty, before recovering to +4.3% at 6 months.
Markets appear to regain footing within 3-6 months once military operations conclude and diplomatic channels resume, showing a pattern of recovery following initial risk-off behavior.
Over a 1-year horizon, the market almost always absorbs the shock and often delivers solid returns:
Mumbai 26/11 attack led to a massive 81.9% gain, aided by the global bull run post-2008 crisis.
Kargil War also maintained a strong +29.4% gain after 1 year, reinforcing investor confidence post-conflict.
Pulwama (+12.7%) and Uri (+15.6%) also registered decent gains over a year.
The Parliament attack was the only major outlier with a -1.3% return over 12 months, likely influenced by the global slowdown and tech bust during that period.
In sharp contrast, Pakistan's KSE-100 index has historically suffered larger declines compared to Indian markets. After the Pulwama Attack, Pakistan's market fell 7% over 2 weeks, similar during Uri KSE-100 dropped by 4.5%.
Nifty 50’s performance underscores a classic investment principle: markets hate uncertainty, not conflict per se. Once direction becomes clear — even in the wake of military operations — risk sentiment tends to stabilize, and economic fundamentals take over
The contrasting performances of India’s Nifty 50 and Pakistan’s KSE 100 indices in the aftermath of the April 22 Pahalgam terror attack and the subsequent launch of Operation Sindoor highlight a sharp divergence in investor sentiment and market resilience.
On April 22, the day of the attack, both indices showed muted responses — Nifty closed up 0.17% while the KSE 100 edged up just 0.04%. However, by April 23, a clearer divergence emerged: the Nifty 50 rose by 0.67%, reflecting investor confidence despite geopolitical tension, while the KSE 100 fell by 1.02%, indicating growing anxiety in Pakistan’s markets.
Between April 23 and May 6 — the interim period before India's military response — Nifty dipped a modest 0.88%, whereas the KSE 100 dropped by a steeper 4.11%, suggesting sustained concern among Pakistani investors.
The starkest contrast occurred on May 7, the day Operation Sindoor was executed. Nifty opened lower but rebounded to close with a 0.14% gain, signaling market resilience and trust in India's strategic handling. Meanwhile, the KSE 100 plunged by 3.13%, shedding over 3,500 points, reflecting fears of escalation and instability. The following day, May 8, Pakistan’s benchmark index suffered an even sharper 5.89% fall, while Nifty dipped by just 0.58%. By May 9, the KSE 100 saw a partial recovery, gaining 3.52%, yet this wasn’t enough to offset the cumulative damage.

Between April 22 and May 9, Nifty 50 lost only 0.66% (about 159 points), whereas KSE 100 collapsed by approximately 9.5% (over 11,200 points). This sharp divergence underscores robust investor confidence in India’s economic and geopolitical stability, contrasted with heightened volatility and fragile sentiment in Pakistan.
Despite the political heat, direct trade between India and Pakistan remains limited in size:
In 2024, India exported $1.21 billion worth of goods to Pakistan.
Pakistan’s exports to India: just $0.48 million.
While these numbers are marginal (just 0.06% of India’s total trade), the symbolic and diplomatic weight of halting trade sends a clear message.
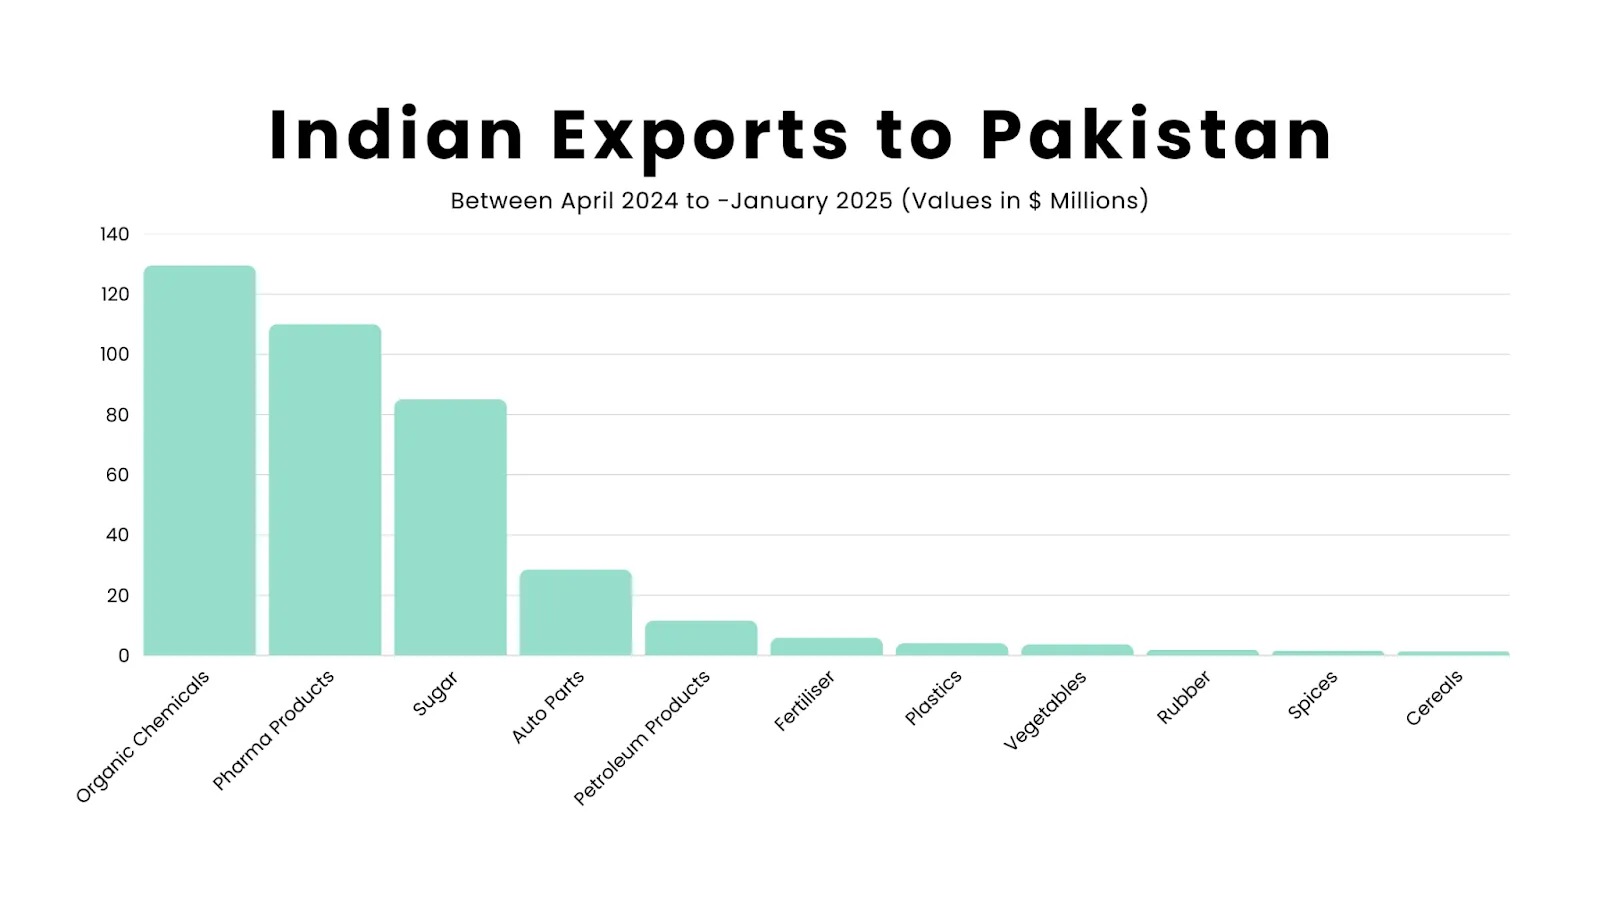
Yet, Pakistani goods haven’t entirely disappeared from Indian markets. Around $500 million worth of goods continue to enter via third countries such as UAE, Sri Lanka, and Singapore — highlighting the adaptability of informal trade channels.
The Attari border was a critical land port trade route, facilitating goods worth Rs 3,886.53 crore in 2023-24. Exports like soybean, poultry feed, and agricultural equipment — once key revenue generators for border towns like Amritsar — have now come to a standstill. Here is the historical trade that happened between India and Pakistan via Attari land port:
Year | Total Trade (₹ Crore) | Total Cargo Movement (Nos) |
2017–18 | 4,148.15 | 48,193 |
2018–19 | 4,370.78 | 49,102 |
2019–20 | 2,772.04 | 6,655 |
2020–21 | 2,639.95 | 5,250 |
2021–22 | 3,002.38 | 4,812 |
2022–23 | 2,257.55 | 3,827 |
2023–24 | 3,886.53 | 6,871 |
Trade peaked in 2018–19 at ₹4,370.78 crore with 49,102 consignments, representing the highest level of bilateral exchange during the recorded period. However, this was followed by a steep and abrupt decline:
By 2019–20, trade dropped to ₹2,772.04 crore (a ~37% decline).
Cargo movement also plummeted to just 6,655 consignments, an 86% drop from the previous year.
This sharp downturn aligns with the aftermath of the Pulwama terror attack in February 2019, which severely strained diplomatic ties. In response, India revoked Pakistan’s MFN (Most Favoured Nation) status and imposed 200% customs duties — effectively choking bilateral trade. Between 2020–21 and 2022–23, trade remained relatively subdued. In 2023–24 we see a significant rebound in trade. With the current freeze, the impact on Punjab’s local economy is stark, especially for those involved in logistics, warehousing, and cross-border goods manufacturing.
India-Pakistan tensions have triggered short-term market jitters, but history suggests these reactions are usually brief. Despite the recent Pahalgam attack and Operation Sindoor, India’s Nifty 50 has shown resilience, while Pakistan’s KSE 100 has suffered sharper declines — reflecting weaker economic fundamentals and investor confidence.
Past conflicts reveal a clear pattern: Indian markets may dip initially, but they typically recover within months as clarity returns and macro fundamentals remain strong. From an economic standpoint, India's macro indicators remain solid. Moreover, trade exposure between India and Pakistan is negligible in GDP terms. The symbolic weight of diplomatic actions — such as border closures and airspace restrictions — is high, but the actual economic impact remains limited to specific regions (like Punjab or J&K) and sectors (aviation, tourism). Defensive sectors tend to outperform, while foreign investor flows largely stay intact unless broader instability arises.
In summary, markets dislike uncertainty, not conflict itself. Once investors perceive a clear trajectory — even one involving limited military engagement — risk sentiment stabilizes, and fundamentals reassert themselves. This pattern has played out repeatedly over the past three decades and appears to be unfolding once more. Unless the conflict escalates dramatically, markets are likely to stabilize soon — reaffirming that Indian equities can weather geopolitical storms when fundamentals hold steady.
Discover investment portfolios that are designed for maximum returns at low risk.
Learn how we choose the right asset mix for your risk profile across all market conditions.
Get weekly market insights and facts right in your inbox

It depicts the actual and verifiable returns generated by the portfolios of SEBI registered entities. Live performance does not include any backtested data or claim and does not guarantee future returns.
By proceeding, you understand that investments are subjected to market risks and agree that returns shown on the platform were not used as an advertisement or promotion to influence your investment decisions.
"I was drawn to Wright Research due to its multi-factor approach. Their Balanced MFT is an excellent product."

By Prashant Sharma
CTO, Zydus
By signing up, you agree to our Terms and Privacy Policy
"I was drawn to Wright Research due to its multi-factor approach. Their Balanced MFT is an excellent product."
By Prashant Sharma
CTO, Zydus
Skip Password
By signing up, you agree to our Terms and Privacy Policy
"I was drawn to Wright Research due to its multi-factor approach. Their Balanced MFT is an excellent product."
By Prashant Sharma
CTO, Zydus
"I was drawn to Wright Research due to its multi-factor approach. Their Balanced MFT is an excellent product."
By Prashant Sharma
CTO, Zydus
Log in with Password →
By logging in, you agree to our Terms and Privacy Policy
"I was drawn to Wright Research due to its multi-factor approach. Their Balanced MFT is an excellent product."
By Prashant Sharma
CTO, Zydus
Log in with OTP →
By logging in, you agree to our Terms and Privacy Policy
"I was drawn to Wright Research due to its multi-factor approach. Their Balanced MFT is an excellent product."
By Prashant Sharma
CTO, Zydus
Answer these questions to get a personalized portfolio or skip to see trending portfolios.
Answer these questions to get a personalized portfolio or skip to see trending portfolios.
(You can choose multiple options)
Answer these questions to get a personalized portfolio or skip to see trending portfolios.
Answer these questions to get a personalized portfolio or skip to see trending portfolios.
Answer these questions to get a personalized portfolio or skip to see trending portfolios.
(You can choose multiple options)
Investor Profile Score
We've tailored Portfolio Management services for your profile.
View Recommended Portfolios Restart


