


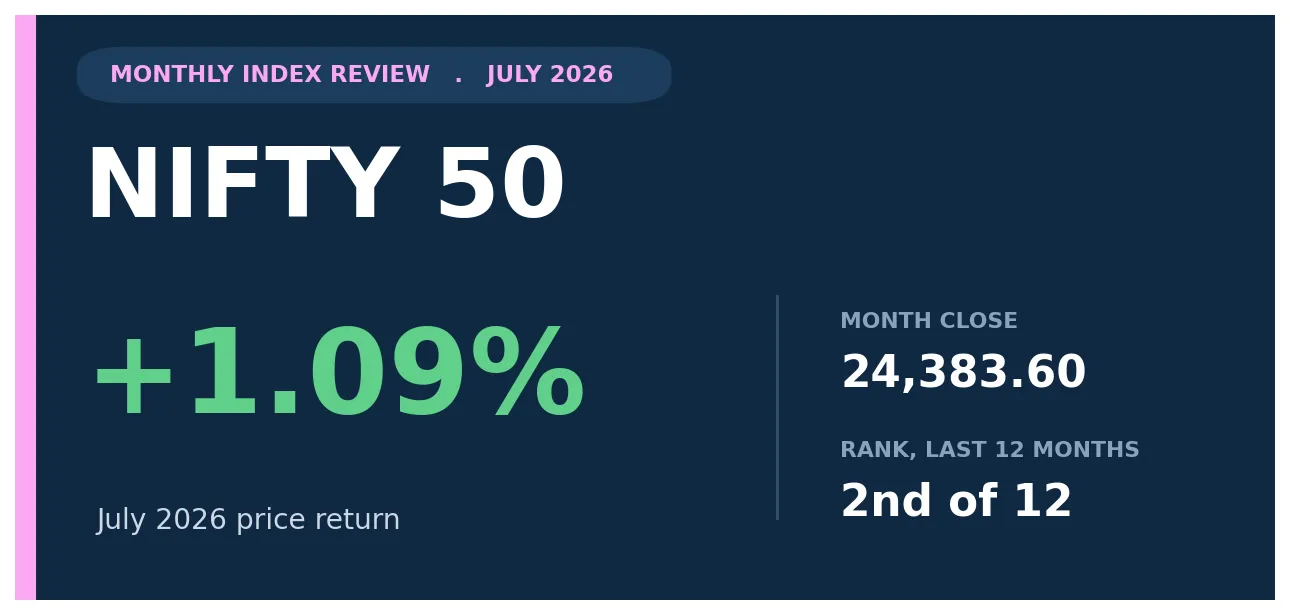
The Nifty 50 rose 1.09% in July 2026 and closed the month at 24,383.60. The Nifty 50 , the benchmark of the 50 largest and most liquid companies on the National Stock Exchange, spent the first half of 2026 in a steady decline, so a positive July marked the first clearly green month since the January reading.
This review covers what the 1.09% gain meant in context: where July ranked within the past year, how it read against the Sensex and the wider market, how it compared with June, and how it fits the long record of July outcomes for the index. Every figure below is drawn from the Nifty 50 monthly returns history, so the month is measured against its own record rather than against opinion. A single month rarely settles the direction of a market, but it does tell you whether the recent trend is being confirmed or challenged, and July 2026 challenged the downward drift that had defined the first half of the year.
What Was the Nifty 50's Return in July 2026?
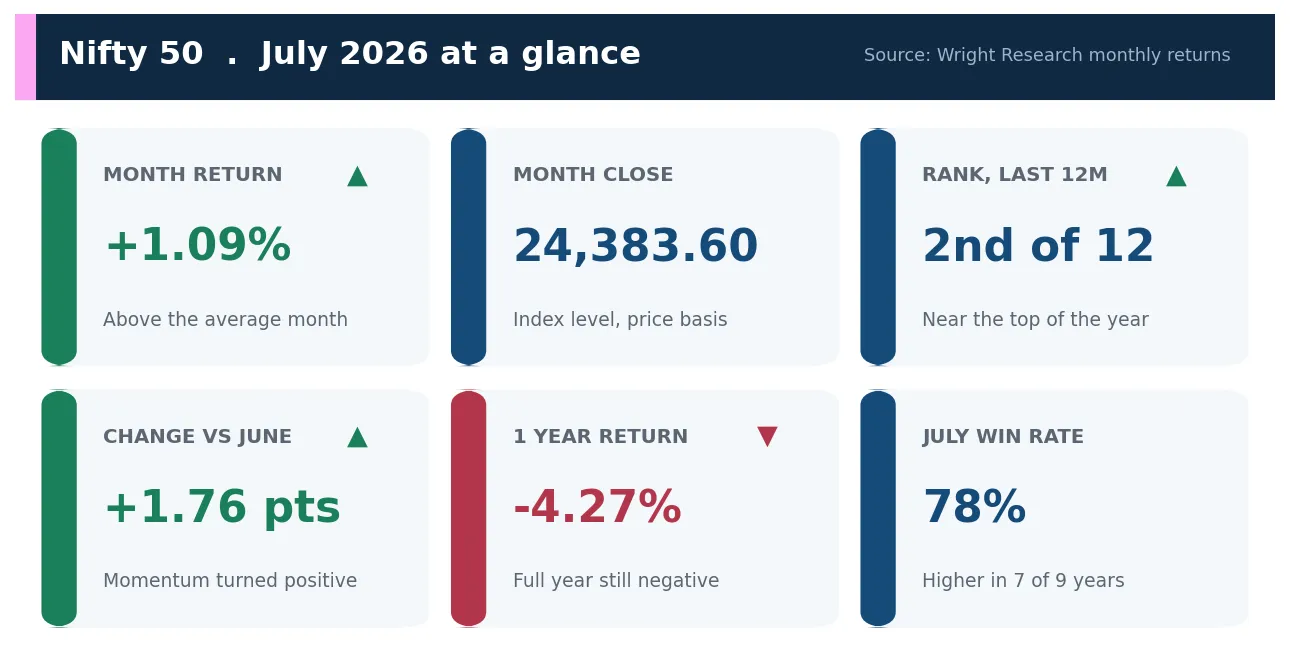
The Nifty 50 delivered a price return of 1.09% in July 2026, closing at 24,383.60. That gain ended a run of soft months: the index had fallen in March, April, May and June, so July was the point at which the tape turned back up. Within the trailing 12 months, from August 2025 through July 2026, the 1.09% reading ranked second of twelve, behind only the 2.86% posted in October 2025.
A second place ranking over a year is a meaningful positive, but the surrounding context matters. Most of the previous eleven months had been weak enough that a single point gain was enough to rank near the top. The move lifted the index off its lows without repairing the larger six month drawdown, which is covered further below. On a total return basis the figure would be modestly higher once dividends are added, though the monthly history used here is measured on price return.
It is worth separating the size of the gain from the significance of the change. At 1.09%, the size of the July move was ordinary, close to the kind of monthly step the index produces in a normal month. The significance came from the change in sign: the index moved from a series of losing months to a winning one. When a market has been falling, the first firm up month is the reading investors watch most closely, because it is the earliest evidence that selling pressure has eased. That is the role July 2026 played, and the ranking simply reflects how weak the comparison base had become.
See what markets are pricing in
Live indices, sector moves and market breadth — the backdrop to every story we publish.
How Did the Nifty 50 Compare With the Sensex and the Broader Market in July 2026?
July 2026 was a large cap led month. The Sensex, the 30 stock benchmark on the BSE, rose about 2.10% and closed near 78,094.64, while the Nifty 50 rose 1.09%. The gap of roughly one percentage point in favour of the Sensex points to leadership from a small group of heavyweight names that carry a larger weight in the 30 stock basket than in the 50 stock index. For investors, a month where the narrower large cap gauge outpaces the broader 50 stock index usually signals that gains were concentrated rather than broad.
The table below sets the two large cap benchmarks side by side for July 2026, with the month end level for each. Both indices posted their gains in the same direction, so the story of the month was one of degree rather than direction. The Nifty 50 result of 1.09% represents the broad large cap experience, while the Sensex figure reflects the tilt toward the largest constituents.
| Large cap benchmark | July 2026 return | Month end close |
|---|---|---|
| Nifty 50 | +1.09% | 24,383.60 |
| Sensex | +2.10% | 78,094.64 |
The one point lead for the Sensex is modest by historical standards, and it followed a stretch in which large caps had generally held up better than the more volatile mid and small cap segments during the earlier 2026 decline. Leadership by the largest names therefore continued rather than reversed. Readers who track the broader market should treat the Nifty 50 as the reference point for the large cap experience and read the Sensex gap as a measure of how much the very largest stocks added on top.
There is a practical lesson in the gap for index investors. A Nifty 50 fund and a Sensex fund track different baskets, and in a concentrated month like July 2026 that difference showed up as about a percentage point of return. Over long periods the two large cap benchmarks move closely together, so the July divergence is best read as a short term signal about breadth rather than a lasting difference in the merits of either index. When breadth is narrow, the heavier weighting of the top names in the Sensex tends to help it, and when breadth is wide the broader Nifty 50 tends to catch up.
How Did July Compare With June and the Recent Trend?
The month over month shift was clearly positive. The Nifty 50 fell 0.67% in June 2026 and then rose 1.09% in July, an improvement of about 1.76 percentage points and a move from a falling month to a rising one. That is the clearest sign of a momentum change in the recent record, though one month does not confirm a durable trend.
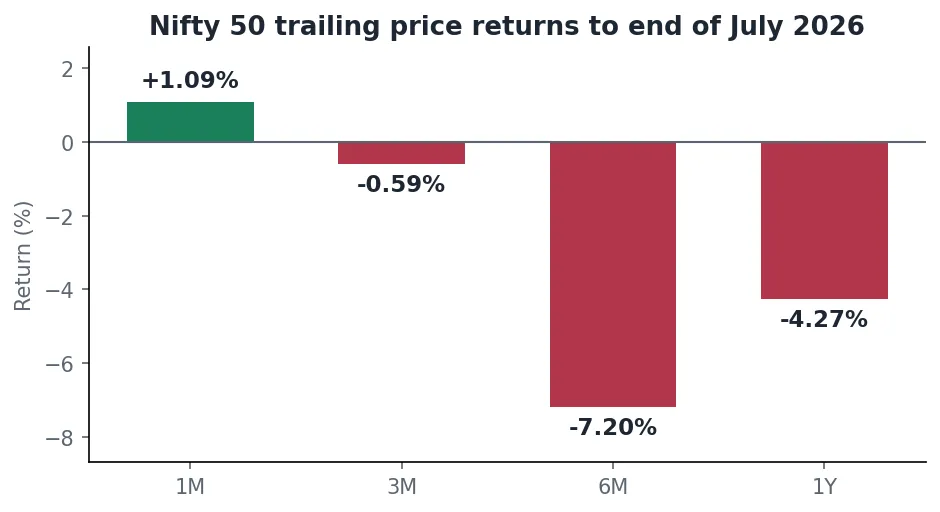
Set against the full run of trailing returns, July still leaves the index in a hole over longer windows. The one month return was positive at 1.09%, but the three month return through July was -0.59%, the six month return was -7.20%, and the one year return was -4.27%. The trailing 12 month average monthly return worked out to about -0.35%, so July at 1.09% sat well above the average month of the past year. The picture is of a market that has stopped falling and posted one firm month, while the medium term trend remains negative. The distance between the positive one month figure and the negative six and twelve month figures is the single most important tension in the July read, because it separates a short recovery from a confirmed recovery.
| Window to end July 2026 | Nifty 50 price return | Read |
|---|---|---|
| 1 month | +1.09% | Above the trailing 12 month average month |
| 3 months | -0.59% | Still slightly negative |
| 6 months | -7.20% | Reflects the early 2026 decline |
| 1 year | -4.27% | Full year still in the red |
The verdict from the trailing table is that July was a recovery month inside a down year. A reader looking only at the one month figure would see strength, while a reader looking at the six and twelve month figures would see an index that has more ground to recover before the longer windows turn positive.
Get research like this in your inbox
The week’s research that mattered, in five minutes. Joined by 2L+ investors.
What Does July History Tell Us About the Nifty 50?
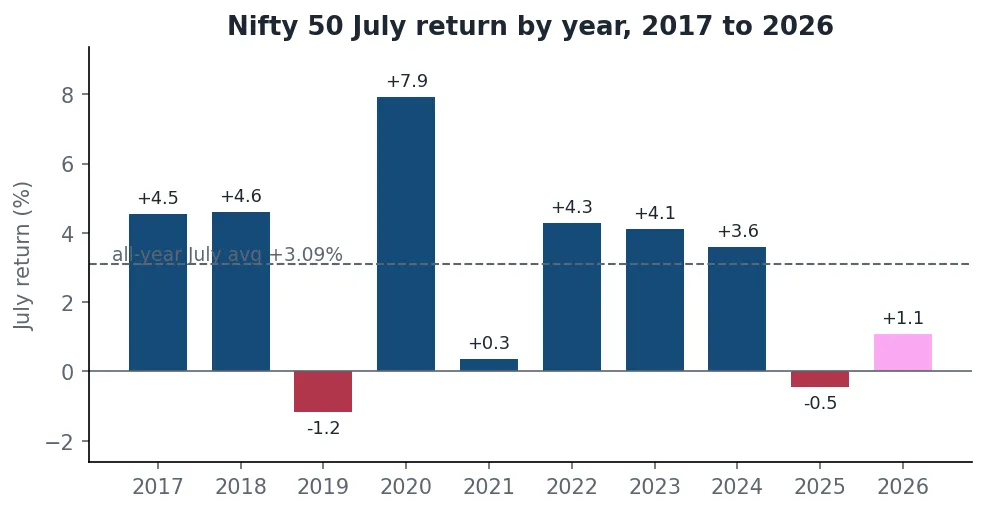
July has been a reliably constructive month for the Nifty 50. Across the ten Julys from 2017 to 2026 the index rose in eight of them. Restricting the sample to completed history before 2026, July closed higher in 7 of 9 years, a win rate near 78%, with only July 2019 at -1.17% and July 2025 at -0.45% in the red.
Against that seasonal record, July 2026 was positive but below par. The 1.09% gain compares with an average July return of about 2.42% over the last 3 years, 2.38% over the last 5 years, and 3.09% across all 9 completed years of history. In other words, the index followed its usual July direction but delivered roughly two percentage points less than a typical July. On a year on year basis the month was an improvement, since July 2025 had fallen 0.45%, so the swing from last July to this July was about 1.54 percentage points to the upside.
| July history measure | Value |
|---|---|
| July 2026 return | +1.09% |
| July 2025 return | -0.45% |
| Average July, last 3 years | +2.42% |
| Average July, last 5 years | +2.38% |
| Average July, all 9 years | +3.09% |
| July win rate, 2017 to 2025 | 78% (7 of 9) |
The history supports a measured read. July 2026 kept the seasonal pattern of a positive July intact, and it improved on a weak July 2025, but it fell short of the strength that the month has usually delivered. Seasonal averages describe tendencies rather than promises, and a single month that lands below its own long run average is a reminder that the broader 2026 trend still weighed on returns.
Seasonality also deserves a note of caution. Nine completed Julys is a short sample, and averages built on it can be pulled around by a single large year such as the 7.92% July of 2020. The win rate near 78% is the more stable signal, since it counts how often July finished higher without being swayed by the size of any one move. On that measure July 2026 did what July usually does, it finished green, even if the magnitude was below the average. Investors should lean on the direction of the seasonal record more than on its precise average, and treat the below average size as consistent with a year that started weak.
What Should Investors Take Away From July 2026?
The month gave three clear readings. First, direction turned up: after four soft months the Nifty 50 posted its second best month of the past year at 1.09% and closed at 24,383.60. Second, the strength was concentrated in the largest names, with the Sensex ahead by about a point, so breadth was narrower than a headline gain suggests. Third, the medium term picture is still recovering, with three, six and twelve month windows all negative.
For a long term investor the useful framing is that July 2026 was a stabilising month rather than a decisive turn. It restored the usual July pattern and lifted momentum, while leaving the larger drawdown of early 2026 only partly repaired. Whether the shift extends will depend on the months that follow, and the trailing windows are the figures to watch for confirmation.
Is your portfolio built for what’s coming?
Get a free AI-powered review of your holdings — risk, overlap and quality in minutes.
What Are the Key FAQs About the Nifty 50 in July 2026?
What was the Nifty 50 return in July 2026?
The Nifty 50 gained 1.09% on a price basis in July 2026 and closed the month at 24,383.60.
Was July 2026 a strong month for the Nifty 50?
It was the second best month within the trailing 12 months, and it sat above the trailing 12 month average monthly return of about -0.35%. Against its own July history the 1.09% gain was below the typical July, which has averaged close to 3% since 2017.
How did the Nifty 50 compare with the Sensex in July 2026?
The Sensex rose about 2.10% in July 2026 while the Nifty 50 rose 1.09%, so the Sensex led the large cap benchmarks by roughly one percentage point over the month.
How does July 2026 compare with June 2026 for the Nifty 50?
The Nifty 50 fell 0.67% in June 2026 and rose 1.09% in July 2026, an improvement of about 1.76 percentage points and a shift back to positive monthly momentum.
How often is July a positive month for the Nifty 50?
Across 2017 to 2025 the Nifty 50 closed July higher in 7 of 9 years, a win rate near 78%, with an average July return of about 3.09%.


