India's 2026 southwest monsoon season is set to be the weakest in three years. Both the India Meteorological Department (IMD) and private forecaster Skymet have projected below-normal rainfall, driven by the return of El Nino conditions in the Pacific Ocean. At the same time, the ongoing US-Iran conflict has disrupted global fertilizer supply chains through the Strait of Hormuz, pushing up input costs for Indian farmers at the worst possible time. Together, these two forces are creating a difficult environment for agricultural output, rural incomes, food inflation, monetary policy, and government finances.
The stakes are high. Agriculture accounts for roughly 15% of India's GDP and employs about 45% of the workforce. Around 60% of Indian farmers depend entirely on monsoon rainfall for kharif (summer) season crops. A poor monsoon does not stay confined to farm fields. It ripples outward into food prices, rural wages, consumer demand, tractor and two-wheeler sales, banking asset quality, and fiscal balances. The 2023 monsoon deficit demonstrated this clearly, and 2026 is now tracking toward a similar, potentially worse, outcome because of the added pressure of geopolitical supply disruptions.
What Are the Official Monsoon Forecasts?
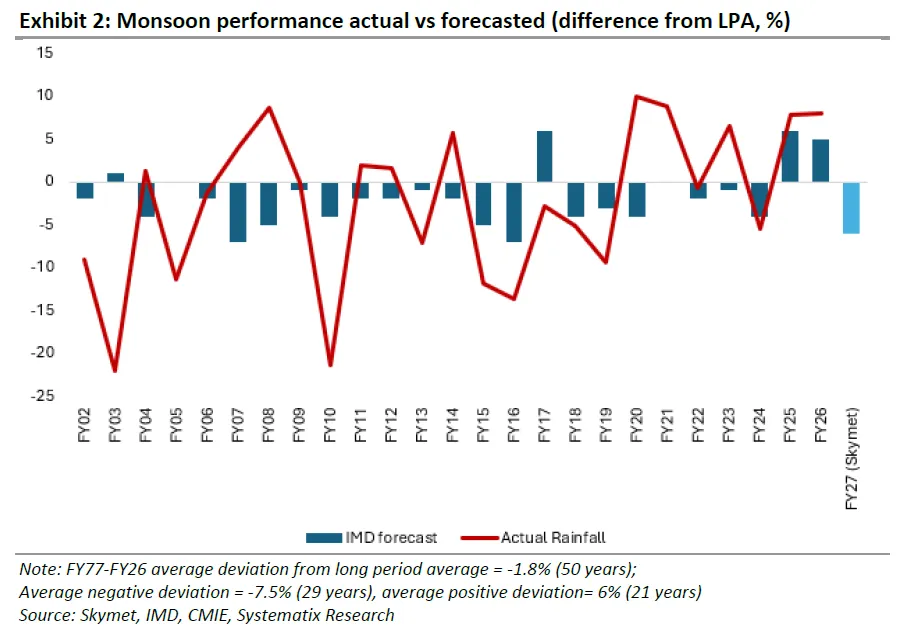
The IMD released its first long-range forecast on April 13, 2026, projecting the southwest monsoon at 92% of the Long Period Average (LPA), with a model error margin of plus or minus 5%. This is classified as below normal. It is the first time in 11 years that the IMD has issued a below-normal forecast in its April outlook. The LPA for the four-month monsoon season (June to September, based on 1971 to 2020 data) is approximately 868.6 mm. At 92%, actual rainfall would come in around 800 mm.
Skymet Weather, which released its forecast on April 7, 2026, projected the monsoon at 94% of LPA, also classifying it as below normal with a similar error margin of +/- 5%.
The probability distribution is concerning. The IMD assigns a 35% probability to deficient rainfall (below 90% of LPA), a 31% chance of below-normal rainfall (90 to 95% of LPA), and only a 34% combined probability of normal, above-normal, or excess rainfall. For context, the long-term (climatological) probability of deficient rainfall is 16%. This year's 35% estimate is more than double the historical norm.
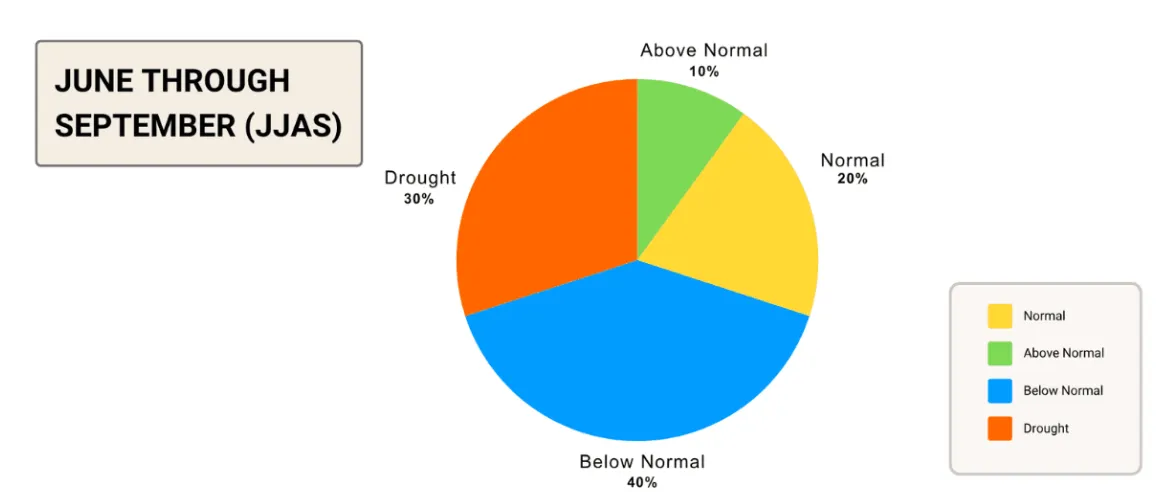
Skymet's probability breakdown is similarly weighted toward the downside: a 30% chance of drought (below 90% of LPA), 40% chance of below-normal rainfall, 20% chance of normal, and only 10% chance of above-normal. The probability of excess rainfall is zero.
Why Is El Nino the Primary Driver?
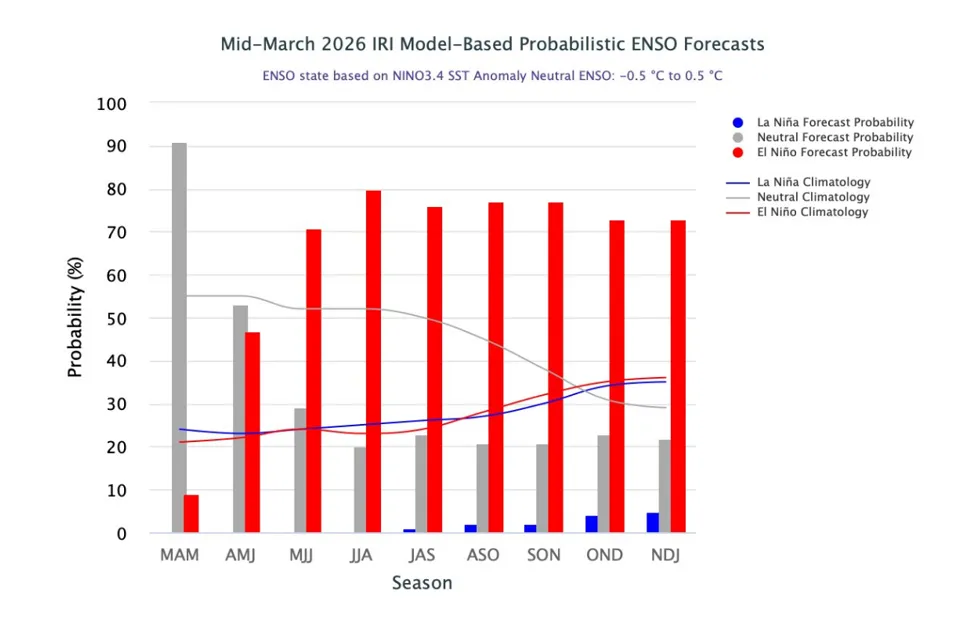
The core reason behind these forecasts is the expected emergence of El Nino conditions. According to NOAA's April 9, 2026 update, ENSO-neutral conditions currently prevail and will likely persist through April to June (80% probability). El Nino is expected to develop during May to July with a 61% probability and persist through the end of 2026. There is roughly a 25% chance of it becoming a very strong event. Other agencies, including the Australian Bureau of Meteorology, the WMO, and Japanese climate models, broadly align with this outlook, confirming a transition from the fading 2025-26 La Nina toward warming Pacific conditions.
El Nino years have a well-documented track record of suppressing Indian monsoon rainfall. Of the 16 times El Nino emerged since 1950, it depressed the country's monsoon rainfall on 9 occasions. The mechanism is straightforward: warming in the central and eastern Pacific disrupts atmospheric circulation patterns that drive moisture-laden winds toward the Indian subcontinent.
When and Where Will the Deficit Hit Hardest?
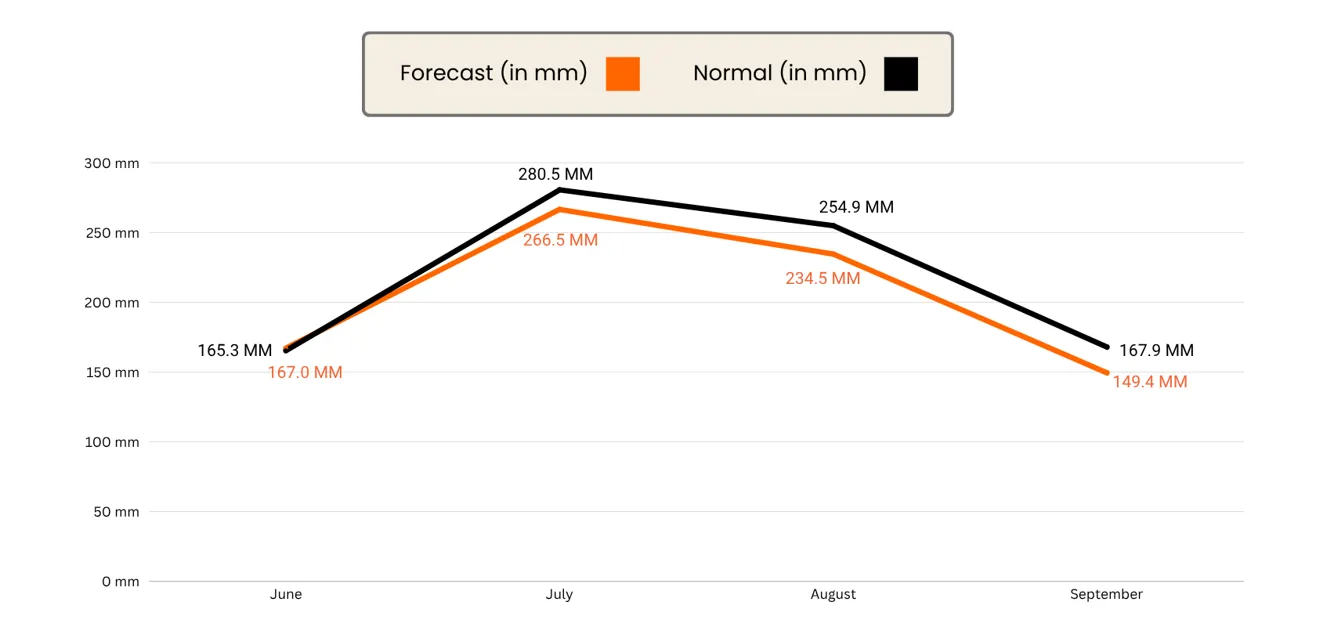
Both forecasting agencies indicate that the first half of the monsoon (June and July) may remain relatively stable. Skymet expects June rainfall at around 101% of LPA, with a 40% chance each of it being normal or below normal. The real shortfall is expected in the second half, particularly August and September, when El Nino's impact will be fully entrenched. Skymet estimates a nearly 60% probability of below-normal rainfall in August, when the LPA is 254.9 mm.
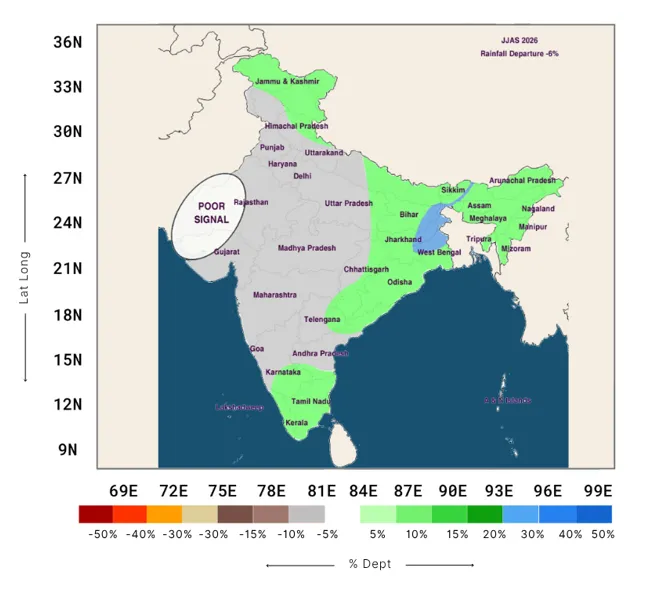
Geographically, the deficit will be uneven. North, west, and central India face the highest risk. Punjab, Haryana, and Rajasthan are particularly vulnerable during August and September. The core monsoon rainfed zone of central and western India is expected to receive inadequate rainfall. Eastern and northeastern regions are likely to fare comparatively better.
There are two potential mitigating factors. The Indian Ocean Dipole (IOD) is expected to turn positive toward the end of the season, which historically supports enhanced rainfall over India and could partially offset the El Nino impact. Additionally, snow cover over the Northern Hemisphere in January to March 2026 was slightly below normal. Lower Eurasian snow cover has an inverse relationship with Indian summer monsoon rainfall, meaning it could contribute positively. IMD Director General Mrutyunjaya Mohapatra has noted both factors could moderate the El Nino effect, though their magnitude remains uncertain.
What Happened When the Monsoon Failed in 2023?
The 2023 monsoon provides a direct precedent for what India could face this year. That season ended with a 6% overall deficit, but the real damage came from its highly uneven distribution. About 31% of India, covering 221 out of 718 districts, received less than normal rainfall. Six states recorded major deficits: Assam, Manipur, Mizoram, Jharkhand, Bihar, and Kerala.
The agricultural consequences were severe. Pulses were sown on 5.41 lakh hectares less area compared to 2022. Oilseeds dropped by 3.16 lakh hectares. India's agriculture growth rate fell to 1.4% in FY24, the lowest in eight years, according to the Ministry of Statistics and Programme Implementation. In the 2023-24 crop year, foodgrain production declined by 6.1%.
The inflation impact was immediate. Food inflation soared to 11.5% in July 2023, pushing overall CPI inflation to a 15-month high of 7.44%. Even after receding from those peaks, food inflation remained elevated at 8.69% as late as May 2024.
Rural demand indicators deteriorated sharply. Tractor registrations dropped from 84,473 in July to 49,007 in September 2023. Year-on-year tractor sales growth fell to 1.1% in August from 6% in July. Two-wheeler sales growth slowed to 0.6% year-on-year. Demand for MGNREGA employment rose 28% in July and 31% in August as rural job opportunities dried up.
The 2026 season carries the additional burden of elevated input costs, a factor that was absent in 2023. This makes the current setup potentially more damaging for farmer margins and rural purchasing power.
How Is the US-Iran Conflict Compounding the Problem?
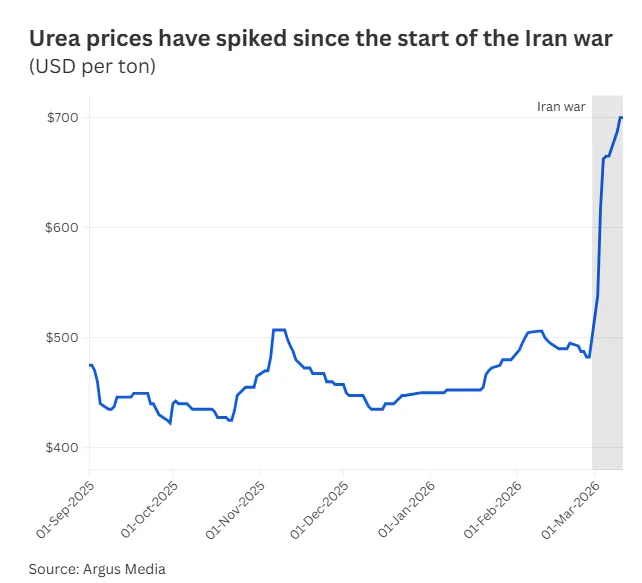
The second major headwind is geopolitical. The US-Iran conflict, which escalated with strikes beginning February 28, 2026, has disrupted shipping through the Strait of Hormuz. This waterway is a critical artery for global commodity trade, carrying close to a quarter to a third of global fertilizer shipments , approximately 20% of global LNG flows, and 27% of globally traded oil .
The price impact has been sharp and rapid. Urea prices at major import hubs surged from roughly $516 to over $680 per tonne within days. Ammonia climbed from about $495 to $600 per tonne. Phosphate prices crossed $700 per tonne. According to Oxford Economics, urea and ammonia prices have risen by approximately 50% and 20% respectively since the conflict began. Global urea futures reached $693 per ton, up 49% from pre-war levels, according to CSIS data.
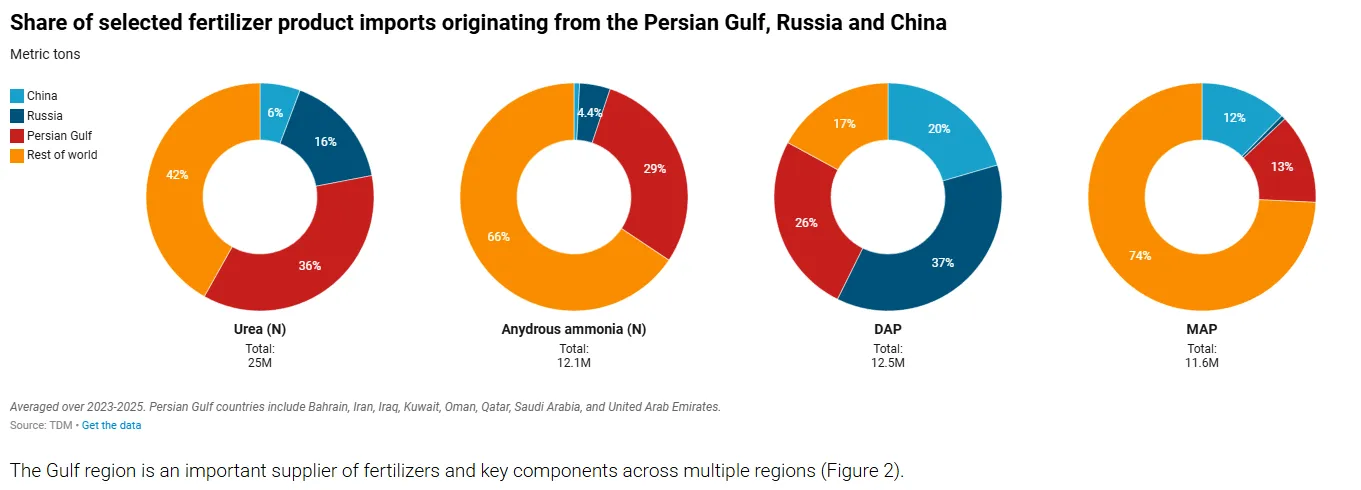
The Persian Gulf region is the single largest regional exporter of urea and ammonia (both nitrogen-based fertilizers) and the second-largest regional exporter of DAP and MAP fertilizers, according to IFPRI analysis. LNG exports from Gulf countries are also vital for fertilizer production in countries with limited domestic natural gas, including India, Pakistan, and Bangladesh.
What Does This Mean for India's Fertilizer Supply and Costs?
India is projected to require around 17 million tonnes of urea through August 2026. With existing stocks of approximately 6.2 million tonnes and expected domestic production of roughly 10 million tonnes, a shortfall of close to 2 million tonnes remains. Domestic production is itself under strain because Indian fertilizer output is closely tied to LNG availability, and supply disruptions have already reduced domestic urea production by roughly 800,000 tonnes.
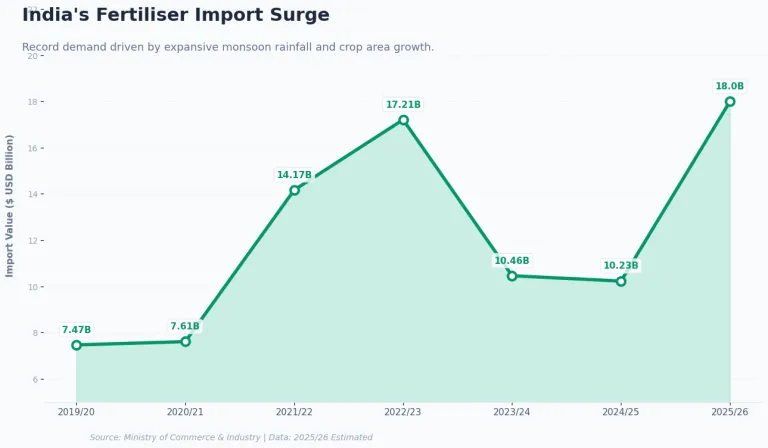
Meeting the import gap at elevated global prices directly increases India’s fertilizer import bill, which is projected to rise sharply toward a record $18 billion this fiscal year. The Systematix report indicates that Q4 FY26 has already shown pressure on fertilizer volumes and margins, with the real challenge expected from Q1 FY27 onward during kharif planting.
The government's Nutrient-Based Subsidy for Kharif 2026 has already been raised to Rs 41,534 crore, an 11 to 12% increase, which is Rs 4,317 crore higher than Kharif 2025. If global prices remain elevated and monsoon deficiency reduces domestic demand further, the subsidy burden could swell by an additional Rs 10,000 to 25,000 crore in FY27.
The table below highlights a persistent pattern: the government consistently underestimates fertilizer subsidy costs at the budget stage.
Fiscal Year | Budget Estimate (Rs lakh crore) | Actual/Revised (Rs lakh crore) | Variance |
FY21 | 1.03 | 1.37 | 33% |
FY22 | 0.79 | 1.62 | 105% |
FY23 | 1.05 | 2.51 | 139% |
FY24 | 1.75 | 1.95 | 11% |
FY25 | 1.64 | 1.84 | 12% |
FY26 | 1.67 | 1.92 | 15% |
FY27 | 1.70 | NA | NA |
Source: Government of India, Systematix Research
FY22 and FY23 saw the budget overrun by 105% and 139% respectively. While the variance has narrowed in recent years, FY27's Rs 1.70 lakh crore budget estimate appears likely to face another significant overrun given the current trajectory of global prices.
Read our detailed analysis: What the Iran-Israel-US War Means For India's & World's Fertilizer Industry?
How Will the RBI and Monetary Policy Be Affected?
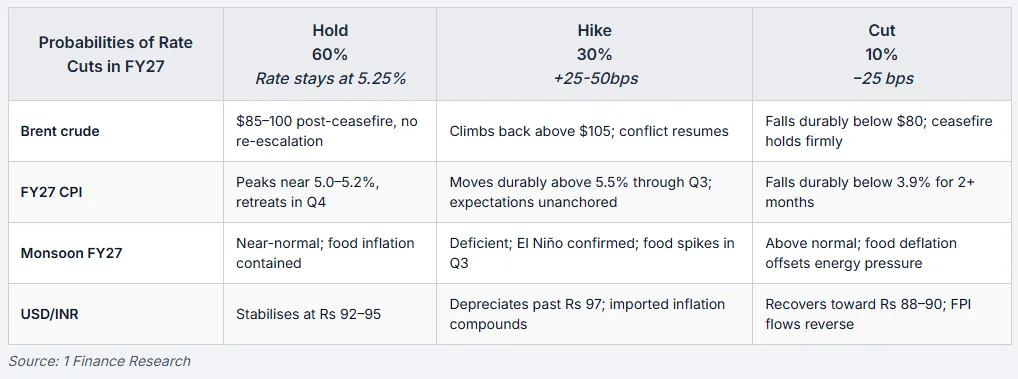
The monsoon outlook complicates an already delicate monetary policy situation. The RBI held the repo rate steady at 5.25% in its April 2026 MPC meeting for the second consecutive time, maintaining a neutral stance. The central bank had previously cut rates by 25 basis points in December 2025, from 5.50% to 5.25%, when inflation was comfortably below 2%.
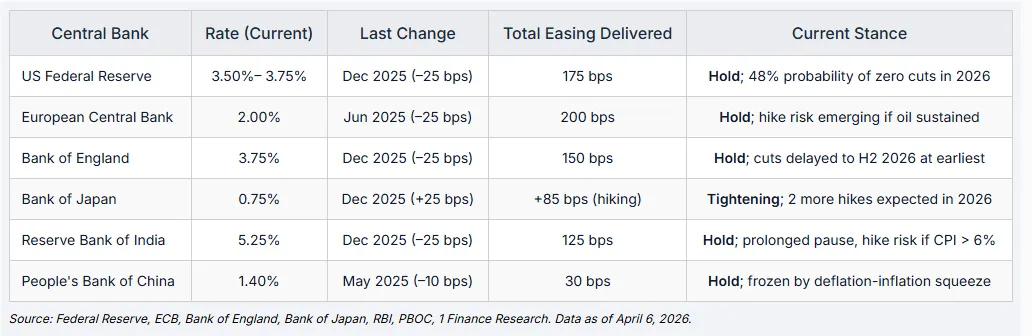
The inflation trajectory has since shifted. CPI inflation rose from 0.71% in November 2025 to 2.7% in January 2026, then 3.2% in February, and 3.4% in March. While these levels remain within the RBI's 2% to 6% tolerance band, the direction is upward. The RBI has projected CPI inflation for FY27 at 4.6%, with a quarterly breakdown of 4.0% in Q1, 4.4% in Q2, 5.2% in Q3, and 4.7% in Q4. The Q3 spike, coinciding with the post-monsoon period, reflects anticipated food price pressures.
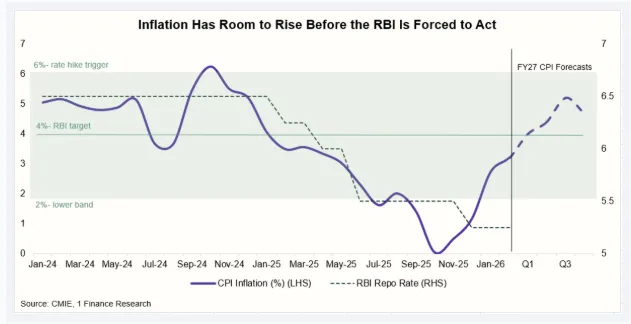
RBI Governor Sanjay Malhotra explicitly flagged the risks in his April policy statement, noting that upside risks to inflation have increased due to energy price pressures and probable weather disturbances affecting food prices. Markets are already pricing in the possibility of rate hikes of up to 50 basis points in FY27. A monsoon-driven surge in food prices would make it significantly harder for the RBI to support growth through rate cuts at a time when GDP growth for FY27 has been estimated at 6.9%, down from 7.6% in FY26.
Food inflation has an outsized role in India's price dynamics. It shapes household expectations, influences wage demands, and narrows the space for accommodative monetary policy. The 2023 experience demonstrated how quickly a monsoon deficit can push headline inflation above the RBI's comfort zone.
Also read our indepth analysis: Is India In An Oil & Gas Crisis? Iran War & Strait of Hormuz Disruption
Which Sectors and Companies Will Be Affected?
Positive Impact: Summer and Cooling Products
A hotter, drier summer benefits certain consumer categories. Ice creams, dairy drinks (Dodla Dairy, Heritage Foods), juices and nectars (Dabur), carbonated soft drinks (Varun Beverages, Tata Consumer's water business), talcs and cooling hair oils (Emami, Marico, Bajaj Consumer), suncare products (Honasa, HUL, Dabur), and durables like air conditioners and refrigerators all stand to gain from extended heat and reduced rainfall.
Negative Impact: Rural-Dependent Categories
Home insecticides (Godrej Consumer Products) face direct headwinds, as do hot beverages like coffee (Nestle, HUL) and tea (Tata Consumer, HUL). The broader second-order effects include softer rural demand across consumer categories, margin pressure from commodity cost inflation, and weaker pricing power. In 2023, the rural demand slowdown was visible in everything from tractor sales to two-wheeler registrations to FMCG volume growth.
Fertilizer Companies: Backward Integration Is the Key Differentiator
Companies with strong backward integration are better positioned to absorb input cost volatility. Coromandel International, with approximately 72% integration in phosphoric acid and 99% in sulphuric acid, and Paradeep Phosphates are better placed to handle margin pressures. Less integrated players face greater risk as raw material costs remain elevated and supply chains stay disrupted.
Banking Sector Risks
Banks with significant rural and agricultural loan exposure face the prospect of rising NPAs if crop output falls and farmer incomes decline. The 2023 deficit led to visible stress in rural credit quality, and a repeat in 2026 with added input cost pressure could amplify the problem.
What Are the Fiscal and Policy Implications?
The government faces a compounding fiscal challenge. Higher fertilizer subsidies, higher food subsidies to manage inflation, under-recoveries on petroleum products, and increased demand for the rural employment scheme (which guarantees 125 days of work) will all draw on limited fiscal resources. In 2023, MGNREGA demand surged 28% to 31% during the deficit months, and a similar pattern is expected in 2026.
India's current account deficit is at risk of widening. Merchandise imports have already been growing at 22.2%, driven partly by higher gold imports. Adding a sharply elevated fertilizer import bill and firm energy prices to that trajectory widens the trade deficit further, putting pressure on the rupee and foreign exchange reserves. The rupee has already weakened as expectations of a wider current account deficit take hold.
Indian agriculture has developed greater resilience over time. Irrigation coverage improved from 49.3% to 55% of Gross Cropped Area between FY16 and FY21. Seed quality, credit access, and real-time weather advisory systems have all improved. Short-duration crop varieties and contingency crop plans can reduce some of the damage from uneven rainfall. These buffers matter, but they do not eliminate the core vulnerability: over half of India's net sown area remains rainfed.
The critical data points to monitor in the coming months include: monthly ENSO updates from NOAA, the IMD's updated monsoon forecast expected in May, kharif sowing progress from June onward, global fertilizer and crude oil price trends , and food inflation readings from June through September. The outcome of the monsoon season, and the duration of the Strait of Hormuz disruption, will together shape India's rural economic trajectory, fiscal position, inflation path, and monetary policy direction for the rest of the year and into FY28.
Read this article to understand how the war is impacting your investment portfolios .
About the author

Our Investment Philosophy
Learn how we choose the right asset mix for your risk profile across all market conditions.
Subscribe to our Newsletter
Get weekly market insights and facts right in your inbox