


India’s next leg of market returns will be as much about earnings as it is about sentiment. And in the coming 18 to 24 months, few forces matter more to earnings than domestic consumption. The backdrop is unusually aligned: GSt rationalisation aimed at boosting demand, easier financial conditions, improving rural incomes, expanding digital rails, and multiple sector-specific catalysts. For Indian retail investors, translating these macro levers into portfolio decisions - without getting carried away is the real opportunity.
Today we look at the most important consumption levers and what they mean for earnings.
Private & Government Consumption Re-Accelerates
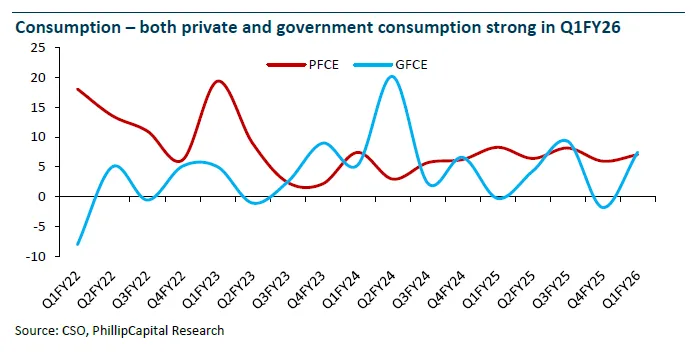
Private final consumption expenditure (PFCE), which tells us how much households are spending, today accounts for ~57% of GDP and has re-accelerated. After a steady FY25, PFCE grew 7% YoY in Q1 FY26 on top of a robust base. Government consumption (GFCE), which includes government’s day-to-day spending on goods and services (salaries, procurement, welfare delivery, etc.), also rebounded following election related softness last year.
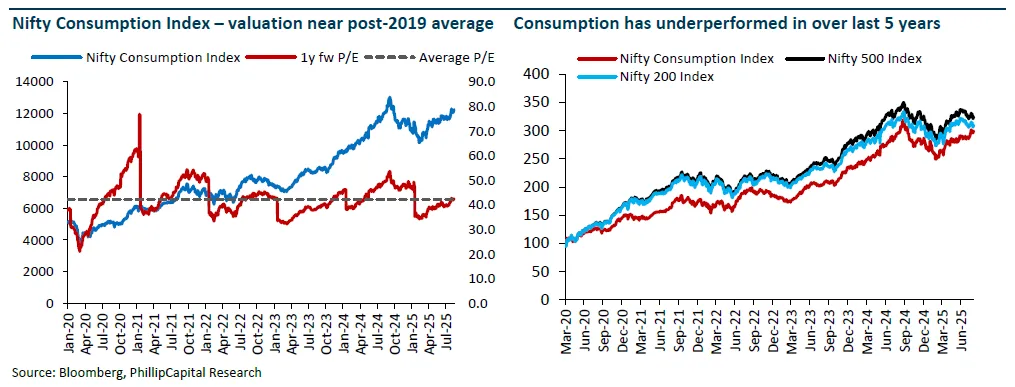
Government consumption helps stabilize employment and incomes. PFCE converts that into broad-based demand. Now, over the last 5 years the Consumption index has lagged the broader markets. But since late February 2025, the Nifty Consumption Index has outperformed the broader market by about 6%, valuations are still near their post-2019 average, not at euphoric peaks. Net-net, the macro sets a positive but not giddy tone for consumption equities.
See what markets are pricing in
Live indices, sector moves and market breadth — the backdrop to every story we publish.
GST 2.0 Rate Rationalisation
From 22 September 2025, India shifts toward a simpler 2 slab GST (5% and 18%) for most goods/services, alongside a 40% slab for luxury/sin categories. This is a material simplification from the older 4-slab structure and sits alongside compliance easing (faster MSME registration; operationalising the GST Appellate Tribunal). Fiscal math suggests a net revenue hit (~₹480bn) that the Centre deems manageable, especially as stronger demand and better compliance kick in. For markets, this is a policy nudge squarely aimed at reviving domestic consumption as we enter the festive quarter.
Likely first order beneficiaries:
Autos & FMCG: lower effective tax on select categories + festive discounting = volume tailwinds.
Retail and NBFCs: shoppers convert intent to purchase; lenders see higher disbursals with adequate liquidity; EMI affordability improves.
Organised players across categories gain from simplification and compliance improvements, accelerating formalisation and share gains.
Inflation Cools Sharply
Through most of 2025 inflation has cooled sharply, running below the RBI’s 4% target since February 2025 - helped by a steep fall in vegetables. Headline CPI was ~1.55% in July 2025, the lowest since 2017. The base case is that inflation drifts back toward ~5% in Q1 FY27, implying the cutting cycle pauses while the system digests earlier easing.
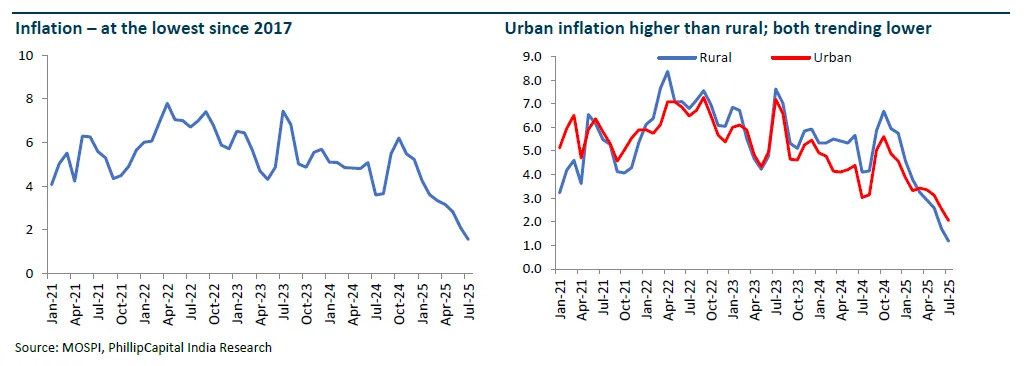
A second and very consumption relevant factor is the rural-urban inflation gap. Rural inflation ran hotter than urban inflation from early 2022 to early 2025. Since March 2025 it’s been lower, with the gap at ~90 bps by July 2025. That’s important because rural discretionary demand is more price-sensitive; lower rural inflation gives volume upside in staples and mass discretionary categories.
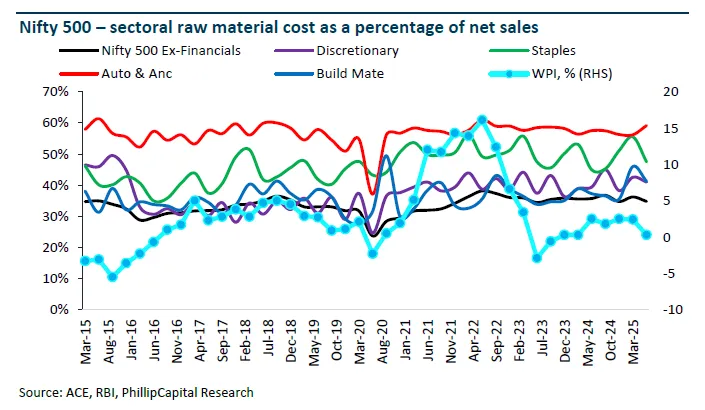
On the cost side, input inflation still shapes operating leverage. Within consumption sectors, raw-material cost to sales is structurally highest in Autos (56–59%), followed by Staples (45–56%) and Discretionary (38–45%); post-Covid, the average cost share has ticked up, especially in Staples (+7ppt) and Discretionary (+4ppt) versus pre-Covid baselines. So what does this mean? Modest commodity stability enables margins to rebuild even if price hikes are muted.
Why does this matter for consumption?
When inflation is low and incomes are rising in real terms, volumes recover first, then mix upgrades (premium variants, branded products) follow; if inflation re-accelerates into the 5% mark, expect down-trading and slower premiumisation, but not necessarily a collapse in volumes.
Interest Rates Policy Takes Time
The RBI cut the repo by 100 bps in 2025 (including a front-loaded 50 bps cut in June), and announced a 100 bps CRR reduction in 4 tranches from 6 Sep to 29 Nov 2025 to keep durable liquidity supportive. This is classic demand-side medicine into the festive window.
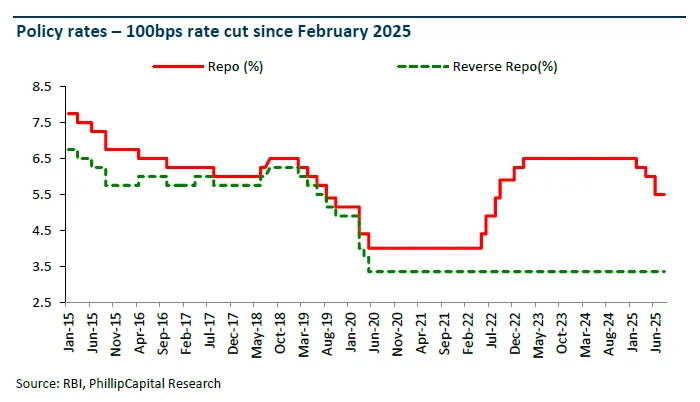
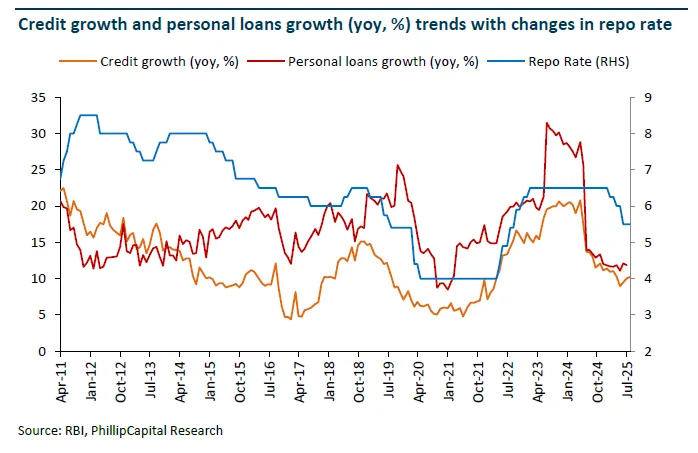
Interest rate changes don’t hit the real economy overnight. Banks need time to re-price deposits, then re-price loans; NBFCs roll market borrowings (CPs/bonds) on a schedule; households respond as EMIs fall and confidence improves. Historically, easier policy’s full effect on personal loan and retail credit growth shows up with a lag, as we saw in the post 2015 and post 2020 cycles.
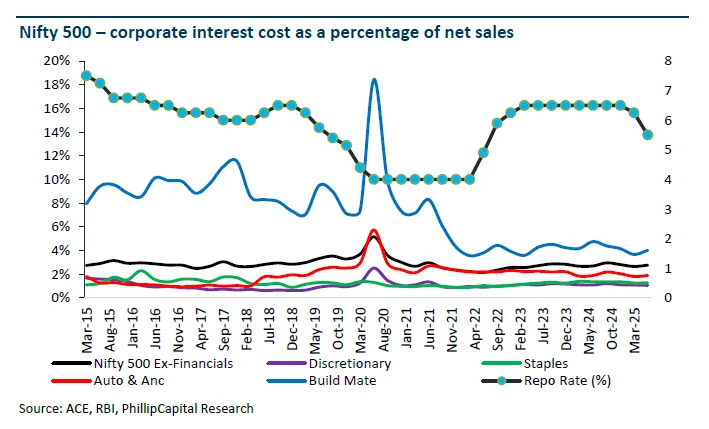
What to expect over the next 2–3 quarters: with cuts already delivered and a pause bias as inflation edges up, the policy impact turns from “more cuts” to “transmission” i.e., lower funding costs feeding through to housing, vehicle loans, and big-ticket retail finance. That transmission is the bridge from macro easing to store level volumes and order books.
Credit Growth Recovers
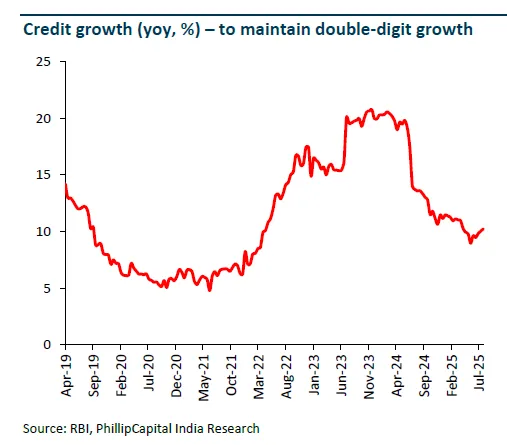
After a powerful run that peaked at ~20.8% YoY in Dec 2023, system credit growth cooled to ~9% in May 2025, then re-accelerated to ~10.2% over June to Aug 2025. This upturn aligns with the easing cycle and seasonal demand. Crucially, the Nov 2023 macro-prudential speed-breakers (higher risk weights on unsecured retail, credit cards, and lending to NBFCs) were rolled back in Feb 2025, removing a notable drag on consumer credit supply.
Historically, once policy loosens and risk curbs normalize, personal loans and retail credit regains momentum as we saw in 2017 to 2019 post the 2015 to 2016 cuts. We also saw it in 2021 to 2023 after the Covid era cuts. Lower rates, ample liquidity, festival clustering, and targeted fiscal support are similar to what we saw in those periods historically, pointing to improving credit availability and uptake into FY26.
Get research like this in your inbox
The week’s research that mattered, in five minutes. Joined by 2L+ investors.
Liquidity Surplus
System liquidity swung from deficit (mid-Dec 2024 to Mar 2025) back to surplus from Apr 2025, and has stayed positive. August 2025 surplus: ~₹2.8 trillion (a shade below July’s ~₹3 trillion). The RBI’s stance is to maintain adequate system liquidity to meet productive requirements, and the step-down in CRR across Sep–Nov 2025 is designed to keep that cushion durable.
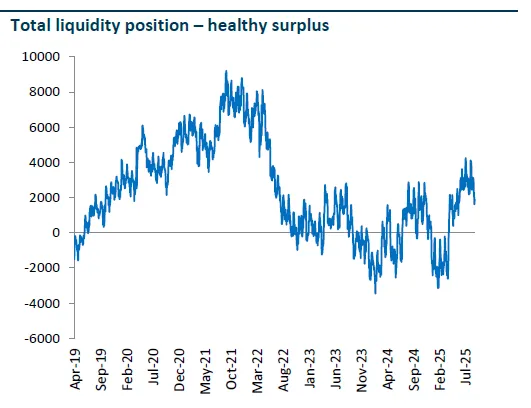
Ample liquidity lowers wholesale funding costs for banks and NBFCs, supports CP/CD markets, and reduces pass-through frictions into lending rates. That, in turn, raises the probability that easier policy translates into actual disbursals and not just prettier cost-of-funds charts.
Rural Economy Is Recovering
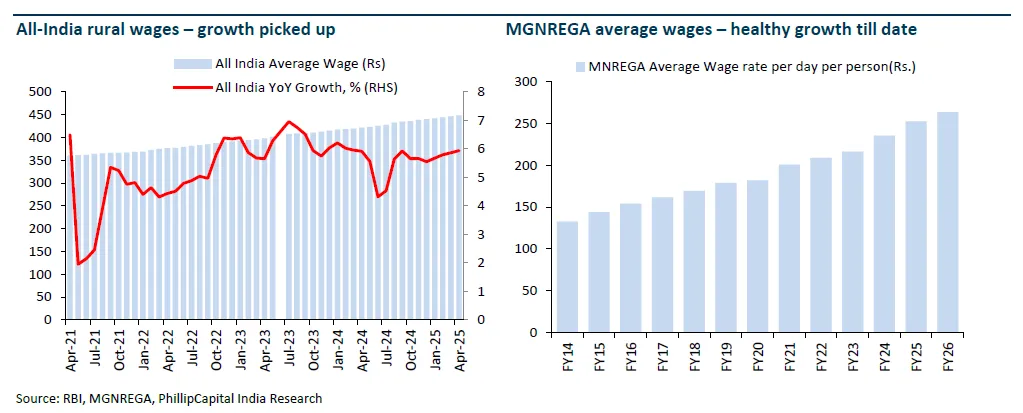
FY25 ended with a clear rebound in agriculture output, and FY26 has started with helpful tailwinds. The rural upturn looks more durable this time because it isn’t just “good monsoon = more crops.” Income sources have broadened toward livestock and fisheries, which cushions shocks and steadies cash flows. Real purchasing power is improving as rural inflation cools relative to urban, while wage supports and government safety nets reduce downside during lean months.
Rural wage rates rose ~2–7% YoY effective April 1, 2025 (avg. ~5%), creating a safety-net tailwind during lean periods.
IMD flagged an above-normal monsoon and, by early September, cumulative rainfall was ~7% above normal; kharif sowing was ~3% higher YoY, with rice/coarse cereals up ~6–8%.
Rural CPI was even lower than urban inflation which improves real wage power for low-ticket staples and sachets. August ticked up to ~2.1%, but still inside the comfort band.
With gold near record highs in India (₹1.11 to 1.14 lakh/10g this week), gold-loan capacity expanded which means outstanding loans against gold jewellery have surged, giving households a flexible working-capital buffer for farm inputs and big-ticket purchases without long processing times.
RBI has simultaneously tightened operating norms to keep risk in check (tiered LTVs, quicker collateral return). Net: more responsible, still elastic rural credit.
Urban Demand To Pick Up Into The Festive Season
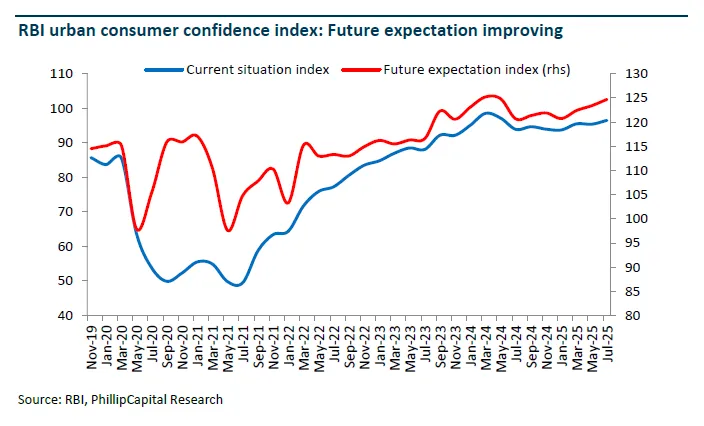
Urban consumption enters the festive window with an improving sentiment backdrop and strong “rails” for spending. The RBI’s consumer confidence data shows the current situation index ticking up in July 2025 and the future expectations index rising steadily since March - useful, because festivals pull forward discretionary purchases when sentiment is already healing.
July e-way bills hit an all-time high (~131.9 million), and August stayed elevated (~129 million), that’s a hard signal of goods movement ahead of festive builds.
UPI crossed 20 billion transactions in August (₹24.85 lakh crore), a fresh milestone that usually precedes a lift in discretionary tickets across urban categories.
Mumbai clocked ~11k house registrations in August; YTD (Jan to Aug) hit ~99.9k, with stamp-duty revenue up ~11% YoY which is supportive for durables/furnishings and organized retail.
For urban consumption categories where organized retail has higher share and supply chains can pass on cuts quickly, the probability of a near-term volume pop is higher. Lower rates and ample banking system liquidity should facilitate financing at the checkout counter (cards, BNPL, NBFC tie-ups), helping conversion rates from browsing to purchase.
Consumer Sectors Earnings Trending Better
The macro setup rate cuts already delivered, durable liquidity and a simpler GST grid favours a volume-led earnings upgrade path. The GST rejig should be most visible in Autos and FMCG first, followed by retail formats, NBFCs (via loan uptick), real estate, and cement (indirectly through housing activity). Where raw material to sales ratios are structurally higher. That’s why a “volume-first” festive season can surprise on margins more than expected—provided price wars don’t fully waste the tax cut.
Expect autos, staples and organised retail to print the earliest positive surprises, with NBFCs acting as transmission for financed purchases. Near term, management teams are likely to prioritise passing on tax benefits to grab share, so margins may lag volumes before operating leverage and stable inputs rebuild EBITDA.
Autos are set for improvement from lows as model cycles, easier credit, and GST timing converge; 2Ws should grow ~5% in FY26/27, PVs ~3–5%, CVs and tractors rebound off a softer FY25 base.
FMCG gets a rural-led volume uptick and room for incremental margin rebuild on stable inputs.
Retail’s winners will skew to omni-channel operators with private label leverage and quick-commerce integrations.
NBFCs see better spreads/volumes as risk-weight headwinds from late-2023 have been rolled back and liquidity stays ample.
QSR and some durables remain more execution- and competition-sensitive near term, so be name-specific.
Consumption Theme Growing Strong
When inflation is low, real incomes rise and confidence improves; rate cuts lower EMIs, but the bigger effect comes as transmission rolls through over quarters; credit growth responds with a lag, first in secured categories; and surplus liquidity makes the whole system more elastic—less friction, quicker approvals, better pricing. That’s the flywheel behind a consumption upcycle.
If inflation backs up toward ~5%, the RBI pauses but doesn’t have to reverse immediately so long as second-round effects stay contained; in that world, the baton passes from “policy easing” to “ongoing transmission + liquidity support”, which can still sustain a volume recovery in autos, housing-linked, and mass retail.
India’s consumption upcycle rests on multiple, mutually reinforcing levers:
- Demand-supportive policy - GST, income-tax tweaks
- Easier financial conditions - repo/ CRR/ lending rate transmission
- Rural stabilisation via diversified agri incomes and better wages
- Urban formalisation visible in logistics and digital payments
- Sector-specific catalysts - autos, retailers omni-channel, NBFCs credit revival
The earnings math for FY26–27 looks better than FY25, and valuations are constructive rather than frothy.
Follow this sector’s live moves
Sector-level performance across Indian markets, updated through the day.
Watchlist The Indian Consumption Theme With Our New Portfolio
Built for India’s household demand boom, our latest multi-cap portfolio targets companies that monetize everyday spending such as staples, durables, autos, retail, QSR, hotels, consumer healthcare and beverages plus selective “enablers” such as payments/ processors, premier private banks/NBFCs, and organized retail platforms that expand access and ticket sizes.
The Consumer Theme portfolio is constructed with a disciplined, data-driven framework. We track top down signals, track disinflation, income effects, rural/urban breadth, credit availability, commodity inputs, and high-frequency indicators. This new portfolio offers a data driven, research led and diversified exposure to India’s consumption revival.


