

At Wright Research we create equity portfolios based on tactical allocation to equity factors & ETFs of other asset classes with the goal of finding the best factor or theme to outperform the market at any given market regime. We wondered if a similar exercise could be done using the diverse universe of mutual funds to create portfolios for the growing population of investors who are comfortable in investing in mutual funds.
We started by a data analysis of the data for 884 direct mutual funds that we found from AMFI.
Categories
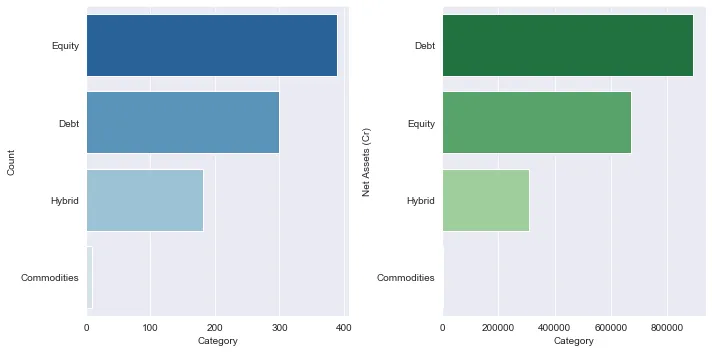
There are 4 broad categories of mutual funds — debt, equity, hybrid & commodities.
While the maximum number of funds are in the equity category, the debt category has the maximum assets under management. This is because a lot of corporates invest only in debt funds.
Types
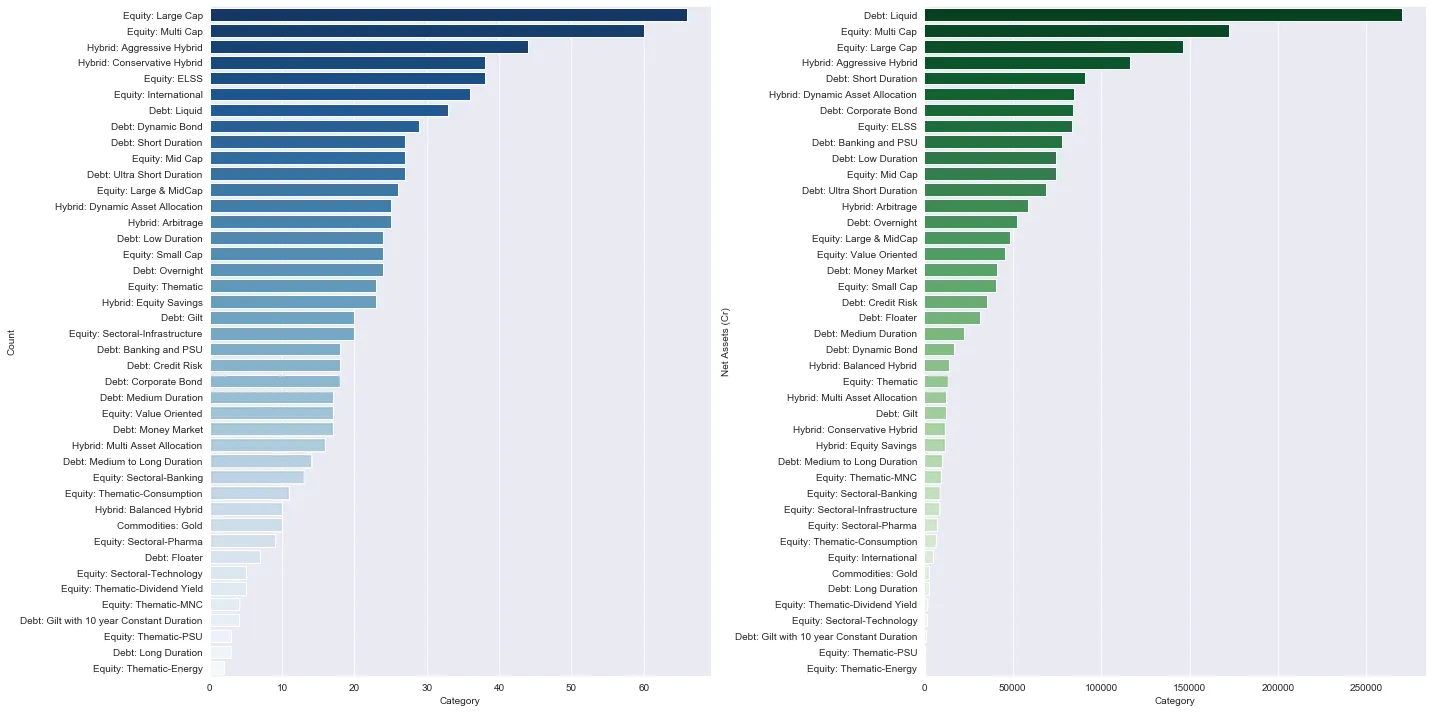
Looking at types or sub-category of funds, there are 42 unique types of direct mutual funds! Equity large cap has the maximum number of funds, followed by equity multi cap and hybrid aggressive. In terms of net assets, liquid debts funds have the largest assets under management followed by equity multi cap and equity large cap.
Fund Houses
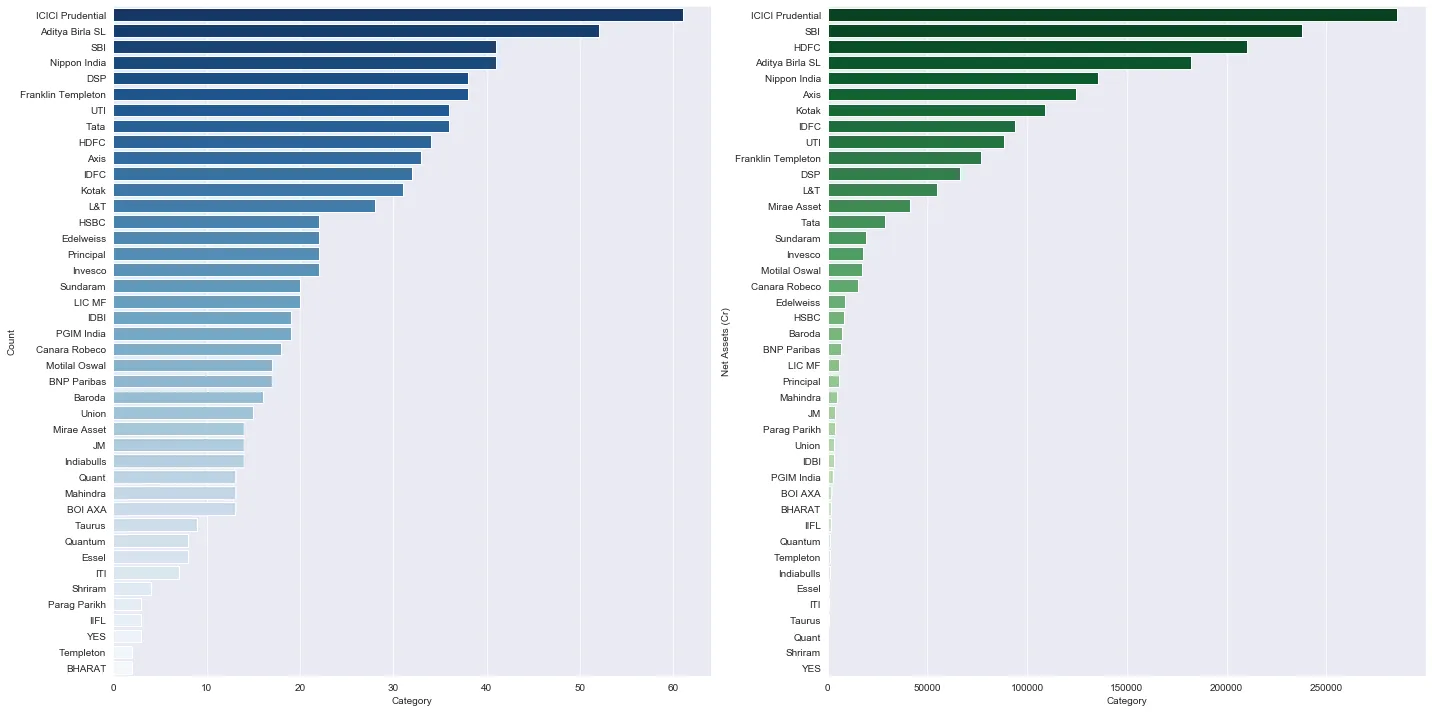
We found 42 unique AMCs or Fund Houses managing mutual funds— ICICI Prudential has the largest number of funds, followed by Aditya Birla SL and SBI while the largest assets under management are with ICICI Prudential, SBI and HDFC in that order. The tiniest fund houses (in terms of assets in direct MFs) are YES, Shriram & Quant.
Performance
How do these 884 funds perform in terms of risk and return? We looked at the average return of the sub-category of funds in each of the categories — equity, bonds & commodity, hybrid. (we shortlisted funds with atleast 3 years of history and 100 cr in AUM)
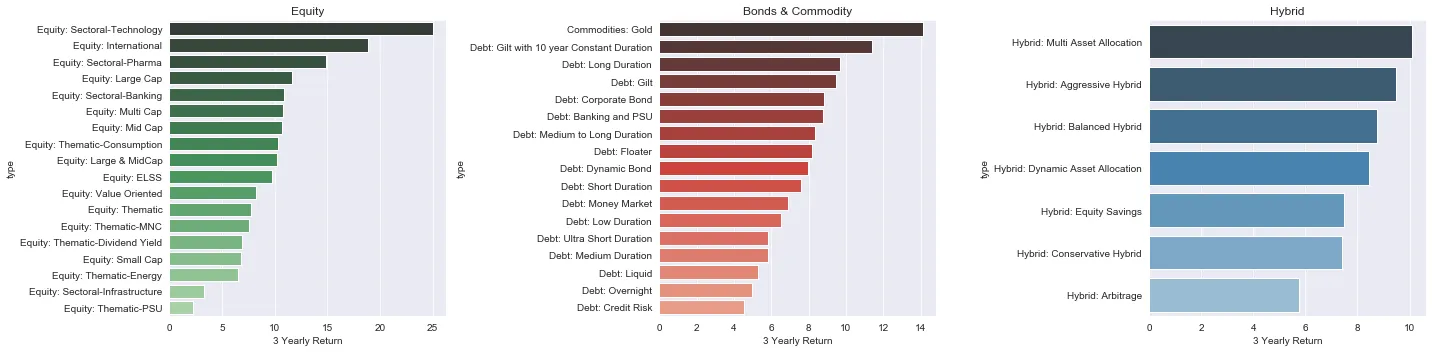
Among equity funds — Technology, International and Pharma funds have given the highest mean returns over 3 years and Infrastructure, PSU & Smallcap the lowest. Among Bonds & Commodities — Gold, 10 year Gilt and Long Duration Debt gave highest return, credit risk and overnight the lowest return. Among Hybrid funds — hybrid arbitrage gave highest return and hybrid aggressive the lowest returns.
Year Till Date Returns
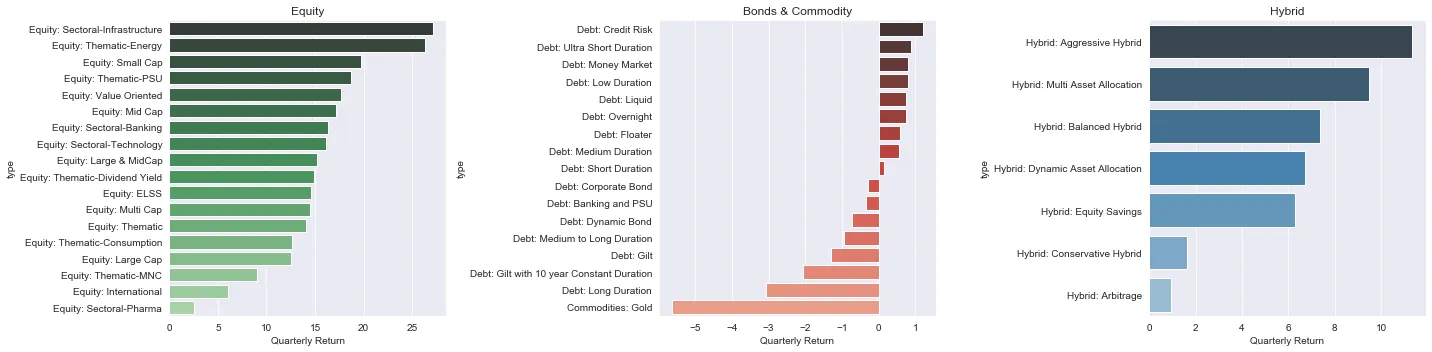
This year, with covid recovery and budget push on infrastructure, sectoral funds on infrastructure, energy, smallcaps & PSUs are out performing and worst performing were pharma, international & MNC funds. Credit Risk Funds gave the highest performance in the Bonds & Gold category and worst performance was given by gold. Among Hybrid funds, aggressive hybrid funds gave highest return and arbitrage funds the lowest.
Risk
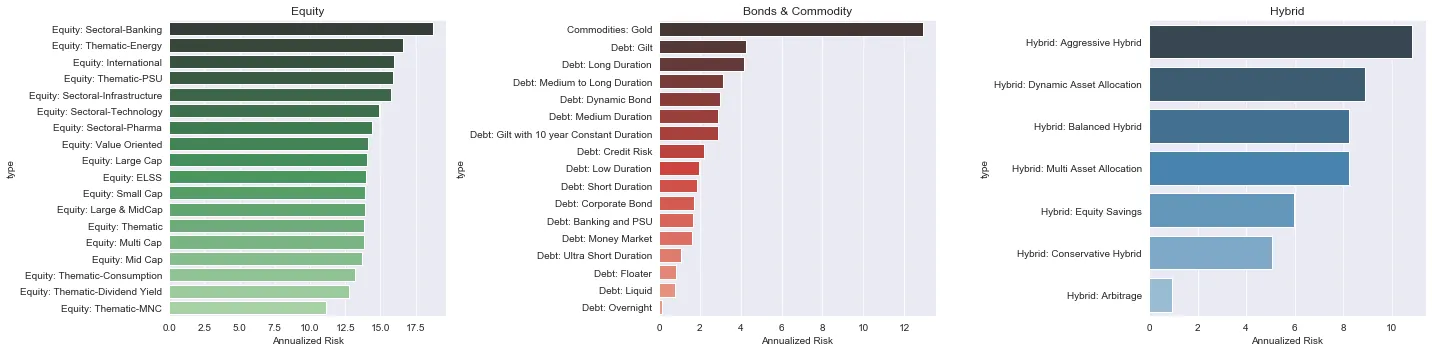
For constructing a portfolio you also need to look at the risk of the components. Banking & Energy are highest risk equity funds, Gold & Gilt are highest risk in bond & gold category and aggressive funds have highest risk in hybrid category.
Other Factors
While constructing a model portfolio of mutual funds, one has to be congnizant of some very important factors like:
Expense Ratios — the annual maintenance charge levied by mutual funds to finance its expenses
Tax — tax treatment of various category of funds is different, depending on its asset class- equity, debt or hybrid, secondly on duration of holding- short term (less than a year) or long term (more than a year); Indexation benefits are received for holding a debt fund for long term
Entry Exit Load — the entry and exit load of most of the MFs is high due to which the portfolio of MFs cannot be a high turnover one.


