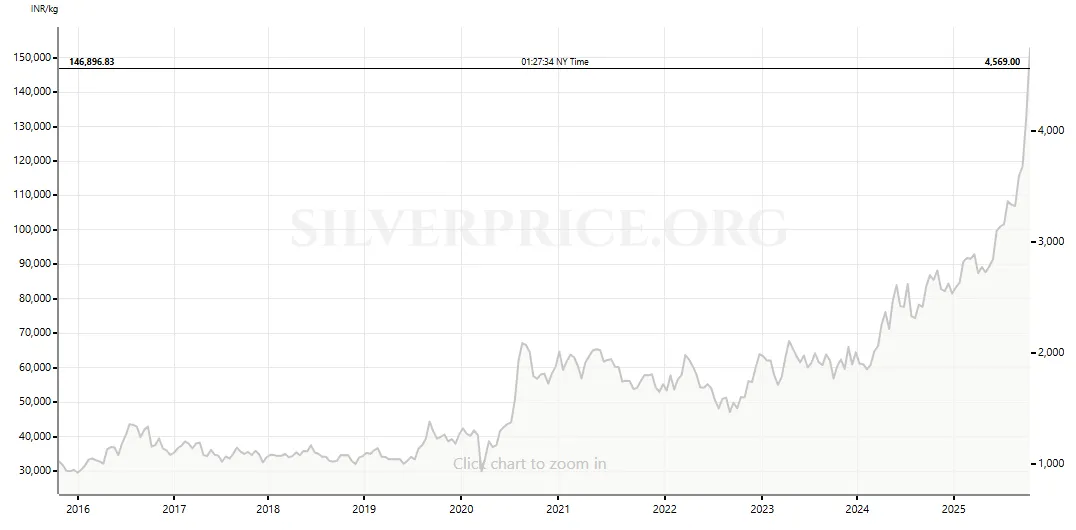
If you walked into a jeweller this Dhanteras weekend, you would have found gold hovering around ₹1.30 lakh per 10 grams of 24Karat gold and silver hovering at around ₹2 lakh per kg at many counters. Timing in this context matters here because 2025 has crammed a lot of price action into a few weeks - which concentrated buying right after a blistering global surge.
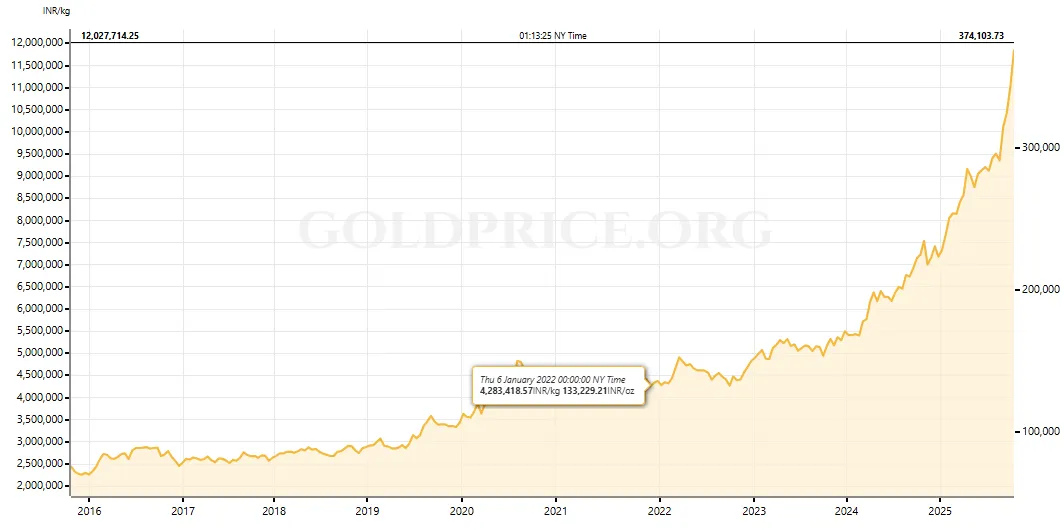
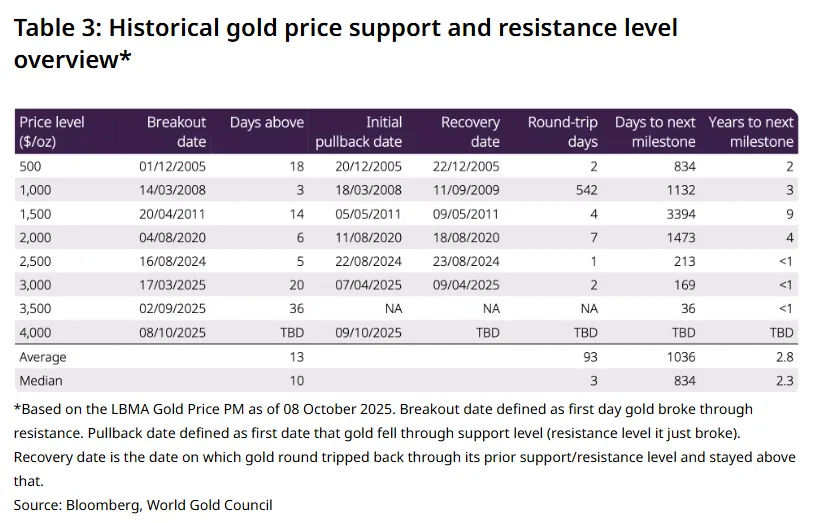
Let’s track back a few weeks and on 8 October 2025, gold rates hit a fresh all-time high at roughly ₹12,317 per gram of 24 carat gold, its 45th record of the year. The move from ₹10,624 per gram to ₹12,317 per gram took just 36 day - 15% increase in just 36 days. In USD terms (since USD-INR fluctuations could impact price changes) this was rising from $ 3,500 to $4,000 per ounce (or 28grams).
A pace that invites the obvious question: is this the continuation of a durable trend or the start of a more complicated turning point?
Watch our detailed video here:
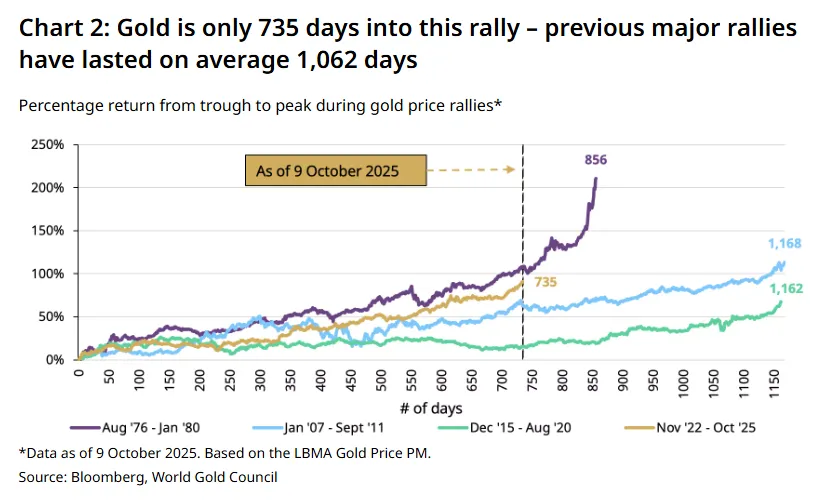
The speed with which gold rates have increased tells you less about fair value than about the concentration of demand: investors chased an asset that was working while alternatives looked fragile. The World Gold Council notes this was the forty-fifth new high of 2025 and that—despite the year-to-date surge—this rally is only about 735 days old, shorter and milder than the average of prior major bull runs, which have tended to last roughly 1,062 days from trough to peak. Those two numbers frame the debate: a powerful year inside a still-young cycle.
The composition of demand in this leg has skewed toward investment rather than jewelry or technology. The Council attributes the surge to a familiar quartet: geopolitical tension, a softer dollar alongside expectations of additional Fed easing, and rising perceived risks in both equities and bonds.
The dollar point matters in two ways. First, a weaker dollar mechanically supports the dollar price of gold. Second, a structurally softer dollar changes global portfolio calculus, encouraging non-US investors to hedge dollar exposure by owning real assets.
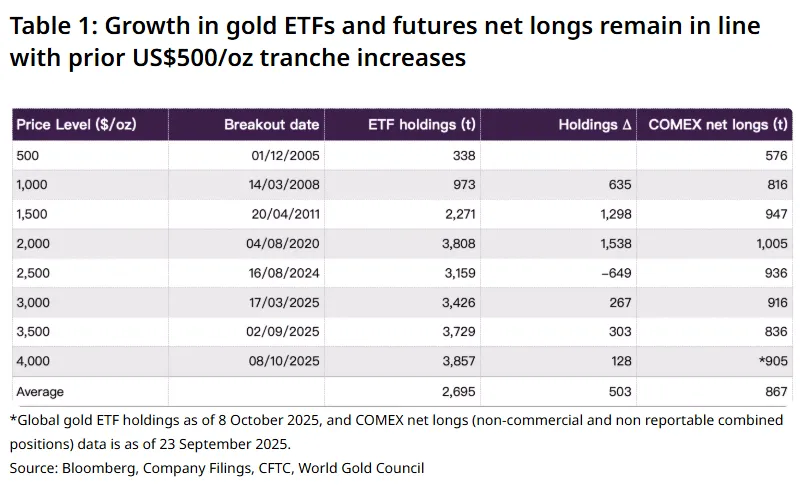
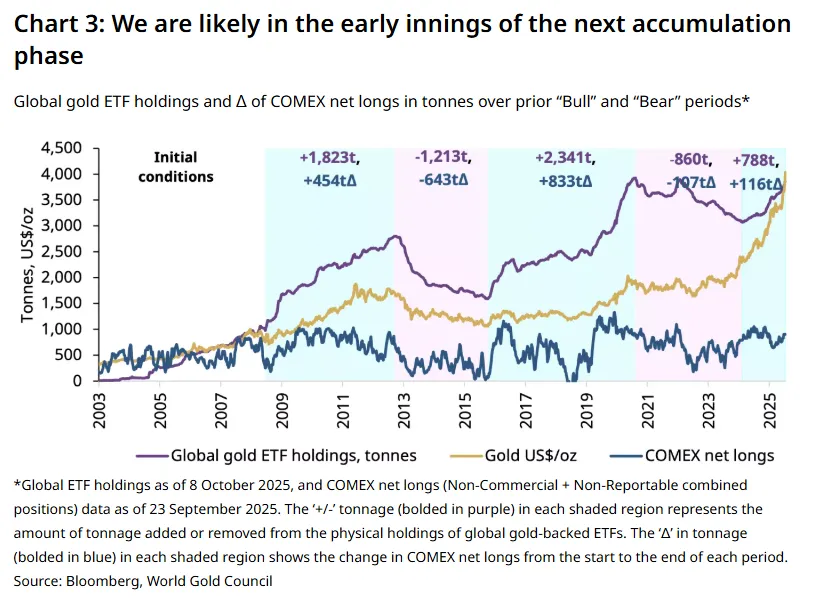
The flows corroborate this. Physically backed ETFs added roughly 634–638 tonnes year-to-date by early October, lifting total holdings to about 3,857 tonnes—still about two percent below the November 2020 peak—while futures positioning, measured by COMEX net longs, remained below levels typically seen at prior highs. In other words, participation is broadening, but it is not maxed out, which undercuts the idea that ownership is saturated.
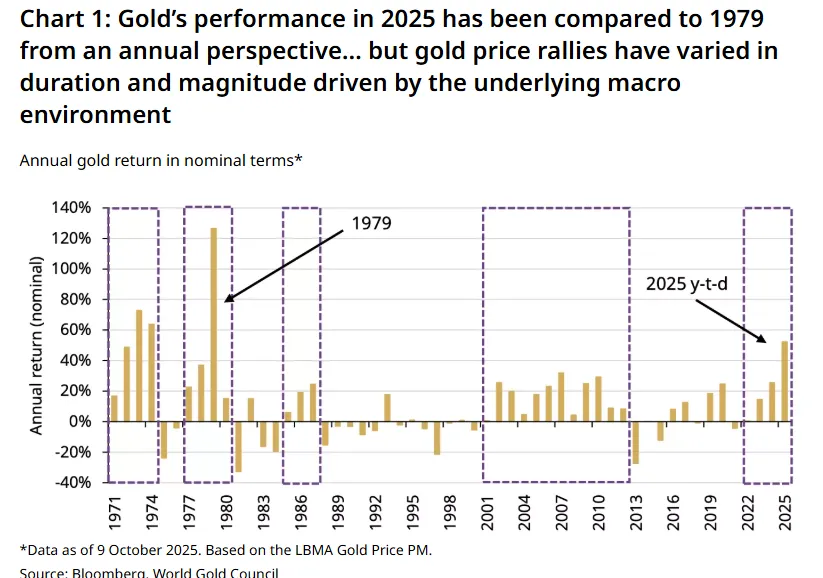
It is tempting to compare 2025 with 1979 because the annual return profile feels similar. The analogy is tidy, but it obscures two realities. First, today’s rally sits inside a different macro architecture: higher real policy rates that are likely trending down, robust but increasingly fragile labor markets, and credit spreads that have been remarkably tight for the stage of the cycle. Second, the breadth of the investor base is evolving.
Since 2003, the market has experienced two extended ETF accumulation phases lasting just over four and five years respectively, adding roughly 1,800–2,300 tonnes. The new accumulation phase that began around May 2024 is only about seventy-four weeks old and has added close to 788 tonnes, with futures longs up a comparatively modest 116 tonnes. By the Council’s own framing, that is roughly one-third of the tonnage typical of past multi-year bull windows. If the analog holds, this suggests time is still on the side of the trend, notwithstanding the calendar-year fireworks.
Every October brings the same paradox: prices moon, but jewellers sound wary. This year that tension is extreme. Investment flows into coins, bars and ETFs have been robust, supported by an extraordinary global run and the psychological tailwind of central-bank accumulation.
Domestically, as Dhanteras neared, Indian dealers quoted their highest premiums in years, reflecting strong pre-buying and tight immediate supply. Premiums across October rose into the festive season and began to cool as imports landed and the rush subsided.
The 2024 turning point came from policy, price, and timing. On 23 July 2024 the government cut import duty on silver (and gold) from 15% to 6%. Landed prices fell 6–7% immediately, bargain hunting kicked in through August, and within three months the domestic price had rebounded to a fresh record near ₹100,000/kg into Diwali. That sequence—duty cut, dip, then record—produced the strongest retail year since 2015 outside the 2022 spike, with total Indian bar-and-coin investment up 21% y/y to 59.8 Moz.
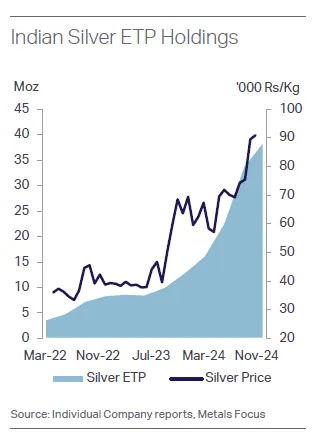
A second structural shift is channel preference. Silver ETPs launched in 2022 have scaled rapidly from 2.1 Moz in Q1-22 to more than 38 Moz by Q4-24, with 2024 inflows of ~25 Moz—equivalent to forty-plus percent of that year’s physical investment. By July 2025, Indian silver ETP holdings exceeded 58 Moz. This is expanding the investor base rather than cannibalising physical entirely, because ETPs solve storage and access frictions for equity-market natives while traditional buyers still prefer bars and coins.
Spot silver was trading above US$48/oz in early October, a level that naturally maps to eye-watering ₹/kg numbers once you multiply by USD/INR which had softened this year and tack on levies and premiums. That’s why silver’s festival-week YoY gains of ~+81% have far outpaced gold’s ~39%. This festive season we also saw strong industrial momentum sync with investor buying.
The corollary: silver is also more volatile. As premiums eased this week, silver shed thousands of rupees per kilo in hours—something gold rarely does in India outside of truly exceptional circumstances.
Global demand is expected to be ~1.20 billion ounces in 2025. Total supply is forecast to reach roughly 1.05 billion ounces, leaving a deficit near 149 million ounces, down about 19 percent from last year but still large by historical standards. The reduction is driven by modest supply growth and uneven end-use demand, not by a collapse in consumption. The deficit is therefore better understood as a structural feature of today’s demand mix rather than a transient squeeze. If the supply side continues to expand at a measured pace while the demand mix remains skewed toward industry, deficits can persist without requiring disorderly price spikes to ration use.
Silver’s price is more dependent on industrial action. The Silver Institute projects another sizable deficit in 2025, the 5th consecutive shortfall, which dovetails with the wave of PV installations pulling silver metal into solar panels.
Industrial fabrication is projected to grow about three percent in 2025 and to exceed 700 million ounces for the first time, with the solar sector again doing heavy lifting as global photovoltaic installations set another record.
Automotive electrification and broader vehicle electrics continue to add incremental silver per unit, even with a slower growth rate in battery-electric volumes.
Consumer electronics demand benefits from ongoing AI-driven device cycles.
Ethylene oxide catalysts and brazing alloys provide smaller, steady contributions.
The product economics matter at the counter. Typical Indian premiums are materially higher for coins than bars: 1 kg bars from reputable refiners often clear with ~15–20% premiums, while smaller-denomination coins carry 40–50%. Brand, packaging, and resale confidence explain much of the spread. In festival weeks those add-ons plus GST make the retail “sticker” look steeper than benchmark references.
A final and very Indian amplifier is the rupee. When the rupee is soft, the rally feels stronger in India because the domestic price is basically the global gold price in USD multiplied by USD/INR, plus taxes and local premiums. A weaker rupee (higher USD/INR) mechanically lifts the ₹ price even if the international dollar price hasn’t changed.
Here’s a quick explanation of how this works-
For standard bullion (24K), the ex-GST domestic price you see on Indian trackers is well-approximated by:
₹ price per 10g ≈ (USD spot per troy oz) × (USD/INR) × (10g / 31.1035g)
Then add:
3% GST (on the bullion value), and
making charges or dealer premium (varies by coin/bar/jewellery, city, and festival-time demand).
Because of that multiplication, a 1% move in the rupee (say, 82→82.82 in USD/INR) has roughly the same 1% effect on the rupee price as a 1% move in the international gold price—before taxes/premiums. In log terms, the percentage change in the Indian price is the sum of the % change in USD gold and the % change in USD/INR. So:
If USD gold is flat but the rupee weakens 2%, domestic gold should rise ~2% (ex-GST), all else equal.
If USD gold rises 3% and the rupee weakens 2%, the domestic ex-GST price should be up ~5%.
That’s why rallies often feel bigger here: we’re seeing the global move plus any rupee weakness - especially around festivals when premiums also flare.
Another reason is that RBI has been buying gold reserves and is now sitting at over $100 billion for the first time, propelled almost entirely by this year’s turbocharged rally in gold bullion.
According to the Reserve Bank of India’s latest weekly data, the gold line item jumped by $3.60 billion in the week ended Oct 10, lifting the total to $102.37 billion even as headline foreign-exchange reserves slipped to $697.78 billion. That pushes gold’s share of total reserves to about 14.7%, the highest since the late 1990s.
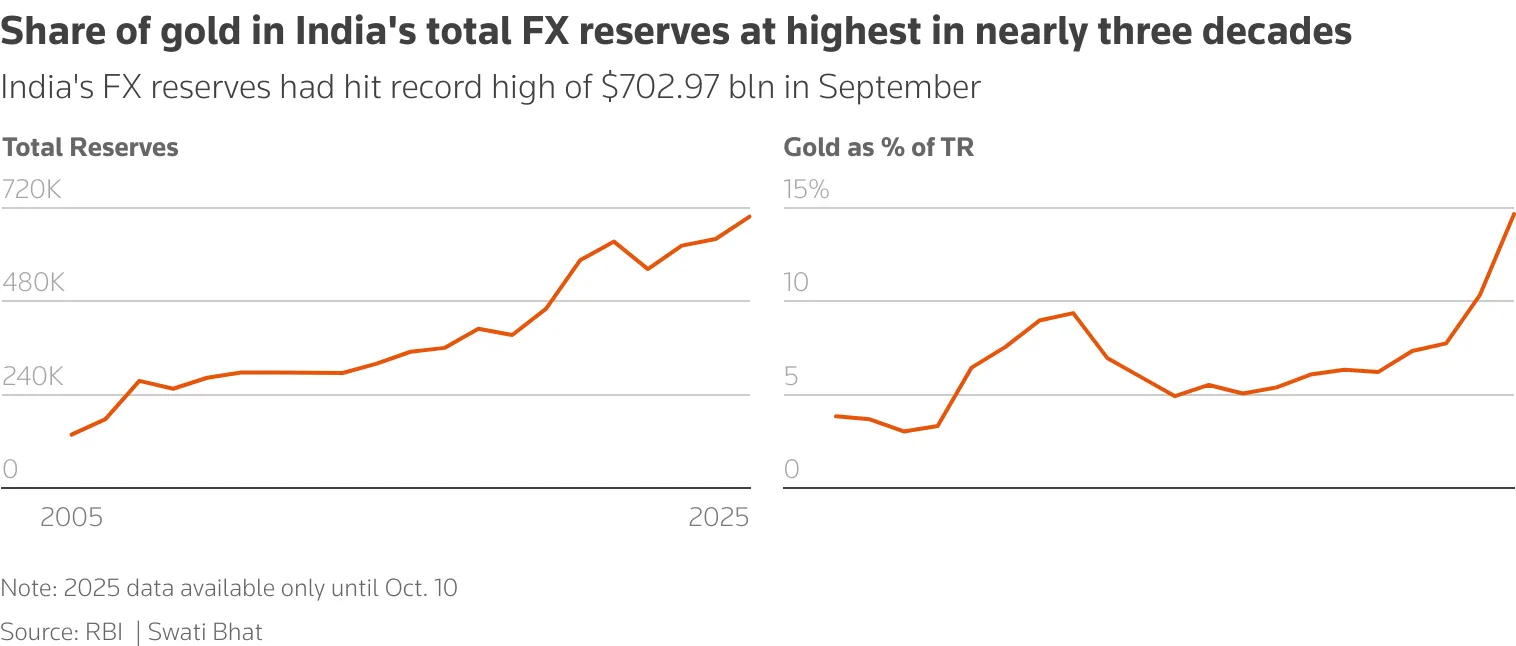
The increase in gold levels is more to do with valuation gains than to aggressive buying. RBI’s net gold additions have been modest this year—about 4 tonnes in Jan–Sep 2025, compared with roughly 50 tonnes in the same period of 2024.
Central banks globally have been consistent net buyers of gold in recent years, led by emerging markets seeking diversification away from the U.S. dollar. Reported purchases rebounded in late summer, underscoring steady official-sector demand even as jewellery consumption softened. For India, the optics matter: a larger gold cushion bolsters confidence in the external balance at a time of elevated oil prices and persistent geopolitical risk. It also offers a hedge against FX volatility without tying up more reserves in dollar assets.
Here’s what this means from a policy perspective and for markets:
With gold near 15% of total reserves, the RBI has more optionality to rebalance on price spikes without dipping into FX. Don’t expect a mechanistic target, though; the bank has historically accumulated gold in measured, opportunistic bursts.
A fatter gold buffer adds resilience to headline reserves, but it doesn’t substitute for FX liquidity in defending the rupee day-to-day.
Record prices tend to curb retail buying and widen local discounts; festive-season demand has been mixed, with investment-led purchases offsetting sticker shock.
After a ~65% year-to-date surge, momentum looks stretched on near-term technicals, but macro drivers—rate-cut bets, geopolitical risk, official-sector demand—remain supportive into 2026.
Tactically, the market is stretched. Gold has a relative strength index north of 90 and a price level more than twenty percent above the 200-day average. Those are classic markers of an overbought condition that entice mean-reversion traders and encourage profit-taking. Overbought does not mean “top,” but it does raise the odds of a fast retracement if macro news delivers a reason. In that regime, intraday flows around options hedging and triggers can amplify moves.
Gold’s best friend in 2025 has been the growing perception that policy rates will trend lower from restrictive levels while growth slows. Markets that believe in falling real rates are willing to pay up for duration-sensitive assets, and gold’s sensitivity to the real yield curve remains one of the cleanest macro relationships.
There are clear positives: high real rates that are likely headed down, tight credit spreads that could widen, and equity valuations that leave little cushion if earnings disappoint or policy error materializes. A structurally softer dollar on top and the case for strategic gold allocations - even at elevated spot levels - still resonates. The caveat is that each of these factors is reversible. A dollar short squeeze would stress non-US buyers, wider credit spreads could force de-risking that hits all liquid winners, and a hawkish surprise on inflation or growth could lift real yields, compressing gold’s valuation. The point is not that any single risk dominates; it is that the market is exposed to path dependency, and the October rally has reduced the margin for near-term error.
Discover investment portfolios that are designed for maximum returns at low risk.
Learn how we choose the right asset mix for your risk profile across all market conditions.
Get weekly market insights and facts right in your inbox

It depicts the actual and verifiable returns generated by the portfolios of SEBI registered entities. Live performance does not include any backtested data or claim and does not guarantee future returns.
By proceeding, you understand that investments are subjected to market risks and agree that returns shown on the platform were not used as an advertisement or promotion to influence your investment decisions.
"I was drawn to Wright Research due to its multi-factor approach. Their Balanced MFT is an excellent product."

By Prashant Sharma
CTO, Zydus
By signing up, you agree to our Terms and Privacy Policy
"I was drawn to Wright Research due to its multi-factor approach. Their Balanced MFT is an excellent product."
By Prashant Sharma
CTO, Zydus
Skip Password
By signing up, you agree to our Terms and Privacy Policy
"I was drawn to Wright Research due to its multi-factor approach. Their Balanced MFT is an excellent product."
By Prashant Sharma
CTO, Zydus
"I was drawn to Wright Research due to its multi-factor approach. Their Balanced MFT is an excellent product."
By Prashant Sharma
CTO, Zydus
Log in with Password →
By logging in, you agree to our Terms and Privacy Policy
"I was drawn to Wright Research due to its multi-factor approach. Their Balanced MFT is an excellent product."
By Prashant Sharma
CTO, Zydus
Log in with OTP →
By logging in, you agree to our Terms and Privacy Policy
"I was drawn to Wright Research due to its multi-factor approach. Their Balanced MFT is an excellent product."
By Prashant Sharma
CTO, Zydus
Answer these questions to get a personalized portfolio or skip to see trending portfolios.
Answer these questions to get a personalized portfolio or skip to see trending portfolios.
(You can choose multiple options)
Answer these questions to get a personalized portfolio or skip to see trending portfolios.
Answer these questions to get a personalized portfolio or skip to see trending portfolios.
Answer these questions to get a personalized portfolio or skip to see trending portfolios.
(You can choose multiple options)
Investor Profile Score
We've tailored Portfolio Management services for your profile.
View Recommended Portfolios Restart


