by Naman Agarwal
Published On Sept. 15, 2025
In the dynamic world of Indian stock markets, understanding candlestick patterns has become essential for traders seeking to decode market psychology and make informed decisions. Among the most significant patterns in technical analysis is the Doji candle, a formation that reveals critical moments of market indecision. Named after the Japanese word meaning "mistake" or "blunder," the Doji represents those rare instances when opening and closing prices are nearly identical, creating a cross-like appearance on charts.
For Indian traders navigating volatile markets like the NSE and BSE, mastering Doji patterns can provide valuable insights into potential trend reversals and continuation signals. This comprehensive guide explores the meaning, formation, types, and practical applications of Doji candles, equipping you with the knowledge to identify these powerful trading signals and integrate them into your investment strategy.
The beauty of Doji patterns lies in their simplicity and universal applicability across different timeframes and market conditions. Whether you're analyzing intraday movements in Nifty futures or weekly patterns in banking stocks, Doji candles offer consistent visual cues about market sentiment that can enhance your trading decisions.
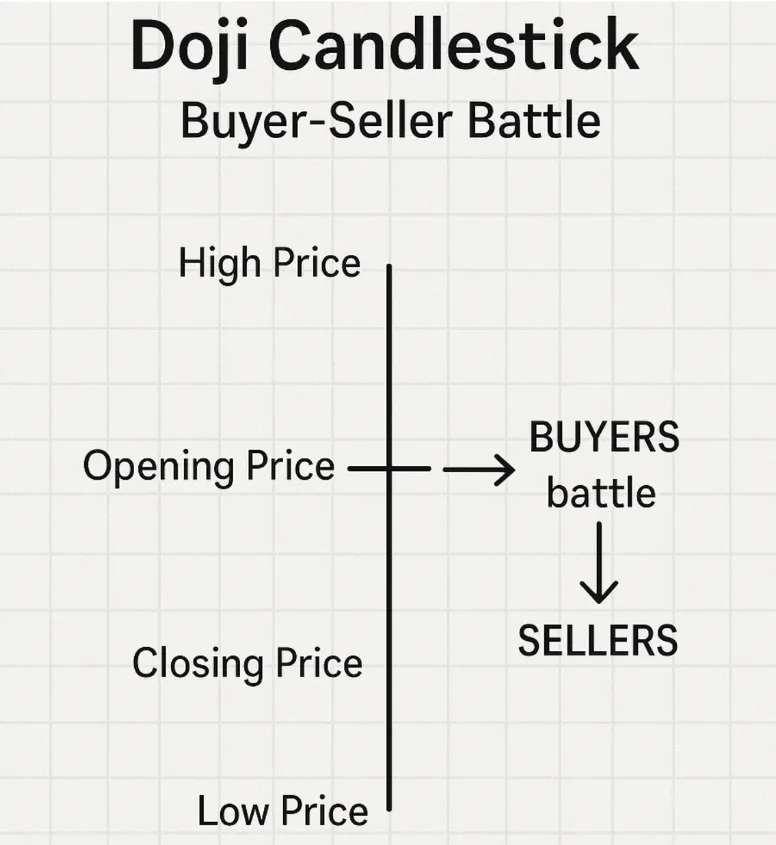
A Doji candle pattern emerges when the opening and closing prices of a security are virtually identical during a trading session, creating a candlestick that resembles a cross or plus sign. Unlike regular candlesticks that display substantial bodies indicating the difference between open and close prices, Doji candles have minimal or no real body, with their distinctive appearance formed primarily by upper and lower shadows or wicks.
The formation of a Doji signifies a moment of equilibrium in the market where neither buyers nor sellers could establish dominance. During the trading session, prices may fluctuate significantly, creating the characteristic wicks that extend above and below the opening level, but ultimately return to close near the opening price. This balance between bullish and bearish forces creates a state of indecision that often precedes significant market movements.
In Indian markets, Doji patterns frequently appear during consolidation phases or at crucial support and resistance levels. For instance, when Reliance Industries approaches a psychological level like ₹3,000, a Doji formation might indicate that market participants are uncertain about the next directional move, leading to this characteristic pattern of equilibrium.
The significance of a Doji extends beyond mere indecision. Depending on its position within the broader market context, it can signal potential trend reversals, continuation patterns, or simply a pause in the current market momentum. Understanding these nuances becomes crucial for Indian traders operating in markets influenced by diverse factors ranging from global cues to domestic policy announcements.
The interpretation of Doji candles in trading contexts requires understanding the underlying market psychology they represent. When a Doji appears, it indicates that the forces of supply and demand are temporarily balanced, creating a standoff between bulls and bears. This equilibrium often occurs at critical junctures in market movements, making Doji patterns valuable indicators of potential changes in sentiment.
In trending markets, a Doji can signal that the prevailing momentum is weakening. For example, if Bank Nifty has been in a strong uptrend and suddenly forms a Doji near resistance levels, it suggests that buying pressure is diminishing and sellers are beginning to match the enthusiasm of buyers. This shift in dynamics often precedes either a reversal or a period of consolidation before the trend continues.
The location of a Doji within the price structure significantly influences its meaning. A Doji appearing after an extended rally carries different implications than one forming during sideways movement. Context becomes paramount in interpretation, as the same pattern can suggest vastly different outcomes depending on surrounding market conditions.
Volume analysis enhances the interpretation of Doji patterns considerably. A Doji formed on high volume indicates strong conviction behind the indecision, suggesting that significant market participants are actively involved in creating this equilibrium. Conversely, a low-volume Doji might represent temporary hesitation with limited long-term implications.
For Indian traders, understanding Doji meanings becomes particularly important during earnings seasons, policy announcements, or global events that can trigger sudden shifts in market sentiment. These patterns often appear just before major moves, serving as early warning signals for astute observers.
The Doji family encompasses several distinct variations, each with unique characteristics and interpretations. Understanding these different types enables traders to make more precise assessments of market conditions and potential future movements.
The Standard Doji represents the classic formation with equal or nearly equal opening and closing prices and moderate upper and lower shadows. This pattern indicates pure indecision with no clear bias toward either direction. In Indian markets, standard Dojis frequently appear during pre-market uncertainty or when stocks trade within tight ranges awaiting catalysts.
Long-Legged Doji patterns feature extended upper and lower shadows, indicating significant price exploration during the session despite closing near the opening level. This variation suggests heightened volatility and intense battle between buyers and sellers. The longer shadows demonstrate that both sides tested their strength but neither could maintain control by session's end. Indian stocks often display long-legged Dojis during result declarations or major corporate announcements.
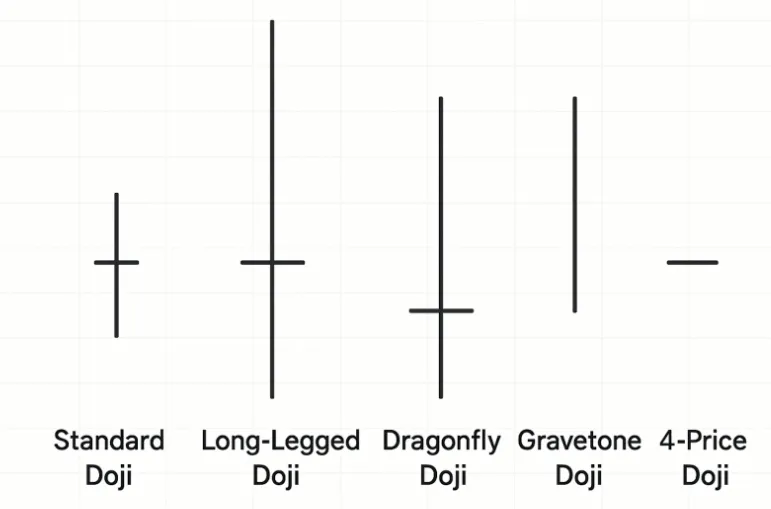
The Dragonfly Doji appears with a long lower shadow and minimal upper shadow, resembling the shape of a dragonfly. This pattern indicates that sellers pushed prices significantly lower during the session, but buyers stepped in aggressively to drive prices back to opening levels. Dragonfly Dojis often appear at market bottoms and can signal potential bullish reversals, especially when found at key support levels.
Gravestone Doji patterns display the opposite characteristics, featuring long upper shadows with negligible lower shadows. This formation suggests that buyers initially drove prices higher but sellers emerged to push prices back down to opening levels. Gravestone Dojis frequently appear at market tops and can indicate potential bearish reversals, particularly when they form at resistance levels.
The rare Four-Price Doji occurs when open, high, low, and close prices are all identical or extremely close, appearing as a simple horizontal line on charts. This pattern indicates extreme market quietness or very narrow trading ranges, often seen during holiday periods or in illiquid securities.
The formation of a Doji candlestick results from specific market dynamics that create the characteristic equilibrium between buyers and sellers. Understanding this formation process helps traders recognize the underlying forces at work and better interpret the pattern's significance.
At the session opening, initial market sentiment typically drives price movement in one direction. Buyers might push prices higher based on positive news or technical factors, or sellers might drive prices lower due to negative sentiment or profit-taking pressure. However, as the session progresses, opposing forces begin to assert themselves, challenging the initial direction.
During a typical Doji formation, prices oscillate as bulls and bears engage in active trading. The market may test higher levels, creating the upper shadow, as buyers attempt to establish control. Simultaneously, selling pressure emerges to challenge these advances, preventing sustained upward movement. Similarly, any downward moves encounter buying interest that limits further decline, creating the lower shadow.
The critical aspect of Doji formation lies in the resolution of these competing forces. Despite potentially wide intraday ranges reflected in the shadows, the closing price settles very close to the opening level. This convergence indicates that neither side achieved lasting dominance, resulting in the characteristic cross-like appearance.
Market conditions that frequently produce Doji formations include periods of uncertainty, consolidation phases, and moments when significant news or events create conflicting interpretations among market participants. In Indian markets, Doji patterns often emerge before important announcements, election results, or global events that can significantly impact sentiment.
The volume pattern during Doji formation provides additional insights into market dynamics. High volume during Doji formation suggests active participation and genuine indecision among significant market players. Low volume might indicate limited interest or temporary hesitation without broader market implications.
Incorporating Doji patterns into trading strategies offers numerous advantages for Indian market participants seeking to improve their technical analysis capabilities and trading outcomes. These benefits extend beyond simple pattern recognition to encompass comprehensive market understanding and risk management.
The primary advantage of Doji patterns lies in their ability to identify potential turning points before they become obvious to the broader market. By recognizing these moments of indecision, traders can position themselves advantageously for subsequent moves. This early warning capability proves particularly valuable in volatile Indian markets where quick reversals are common.
Doji patterns excel at highlighting market psychology and sentiment shifts. Unlike complex indicators that may lag price action, Doji formations provide real-time insights into the balance between buying and selling pressure. This immediate feedback allows traders to adjust their strategies promptly as market dynamics evolve.
Risk management benefits significantly from Doji pattern recognition. These formations often appear before significant moves, allowing traders to tighten stop losses or reduce position sizes when uncertainty increases. Conversely, the absence of Doji patterns during strong trends can provide confidence to maintain positions longer.
The versatility of Doji patterns across different timeframes makes them suitable for various trading styles. Day traders can use hourly Doji formations to time entries and exits, while swing traders might focus on daily or weekly patterns for longer-term positioning. This adaptability makes Doji analysis valuable regardless of trading approach.
Doji patterns complement other technical analysis tools effectively, enhancing overall analytical capabilities. When combined with support and resistance levels, moving averages, or momentum indicators, Doji formations provide confirmation or contradiction of other signals, leading to more robust trading decisions.
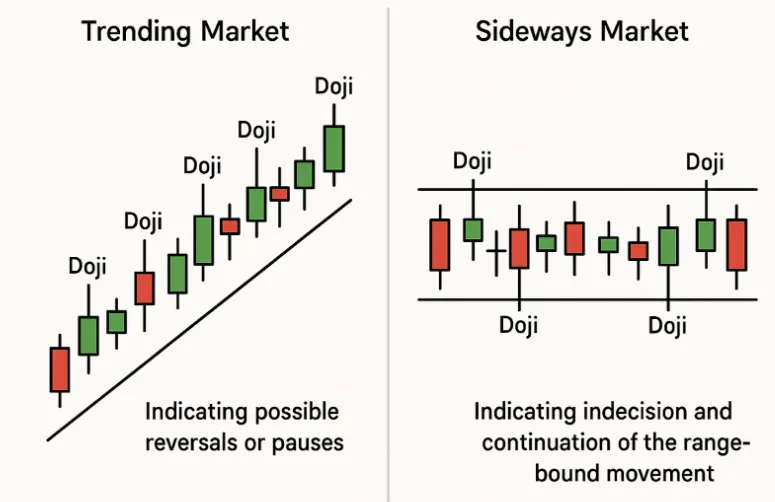
The interpretation and significance of Doji patterns vary considerably depending on whether they appear in trending or sideways market environments. Understanding these contextual differences is crucial for accurate pattern analysis and successful trading applications.
In strongly trending markets, Doji patterns carry heightened significance as they represent potential interruptions to established momentum. When a stock like TCS has been in a sustained uptrend and suddenly forms a Doji, it suggests that the buying pressure that drove the trend is encountering resistance. This shift from clear directional movement to indecision often precedes either trend reversal or significant consolidation periods.
During uptrends, Doji formations typically indicate that buyers are becoming hesitant or that sellers are beginning to emerge. The pattern suggests that the easy money from following the trend may be ending, requiring more careful analysis of subsequent price action. Traders often interpret trending market Dojis as signals to take profits, reduce position sizes, or prepare for potential reversals.
In downtrends, Doji patterns suggest that selling pressure may be waning and that buyers might be stepping in to test lower levels. While not immediately bullish, these formations indicate that the path of least resistance is changing, potentially setting up reversal opportunities if confirmed by subsequent price action.
Sideways or ranging markets present different interpretations for Doji patterns. In consolidation phases, Doji formations are more common and typically indicate continuation of the ranging behavior rather than significant directional changes. The patterns reflect ongoing indecision that characterizes sideways markets, with neither bulls nor bears able to establish lasting control.
However, Doji patterns near range extremes in sideways markets can be significant. A Doji at strong resistance after several failed breakthrough attempts might indicate that buying interest is finally waning, potentially leading to a move back toward support. Similarly, Doji formation at established support levels could suggest that selling pressure is diminishing.
The volume characteristics of Doji patterns also differ between market environments. In trending markets, high-volume Doji formations carry more significance as they suggest that substantial market participants are reassessing their positions. In sideways markets, volume analysis becomes crucial for distinguishing between meaningful indecision and routine consolidation activity.
The Doji candle pattern stands as one of the most valuable tools in the technical analyst's arsenal, offering clear visual representation of market psychology and potential turning points. For Indian traders navigating the complexities of domestic and global markets, understanding Doji formations provides a significant edge in timing entries, managing risk, and interpreting market sentiment.
The power of Doji patterns lies not in their complexity but in their simplicity and universal applicability. Whether analyzing the Nifty's daily movements or evaluating long-term weekly patterns in individual stocks, these formations consistently highlight moments when market forces reach equilibrium, often preceding significant directional moves.
Success with Doji patterns requires understanding their contextual significance rather than treating them as standalone signals. The most profitable applications combine Doji recognition with broader market analysis, volume confirmation, and proper risk management. This comprehensive approach transforms simple pattern observation into sophisticated trading strategy.
As Indian markets continue evolving with increased retail participation and algorithmic trading, the fundamental dynamics that create Doji patterns remain constant. The eternal struggle between buyers and sellers, fear and greed, optimism and pessimism continues to manifest in these distinctive formations, providing timeless insights for observant traders.
Doji patterns are moderately reliable when used correctly, but their effectiveness depends heavily on context and confirmation. In trending markets at key levels with volume confirmation, Doji formations can be quite reliable indicators of potential changes. However, in sideways markets or without supporting evidence, they may produce false signals. The reliability increases significantly when combined with other technical indicators and proper market analysis.
Confirmation of Doji signals requires multiple factors working together. Look for the next candle to provide direction by closing decisively above or below the Doji's range. Volume should support the move, with increased activity suggesting genuine interest. Additional confirmation comes from the Doji's location at significant support, resistance, or trend line levels, and alignment with other technical indicators like RSI divergences or moving average interactions.
Doji patterns are inherently neutral, representing market indecision rather than directional bias. The bullish or bearish interpretation depends on context and subsequent confirmation. A Dragonfly Doji at support levels may lean bullish, while a Gravestone Doji at resistance could suggest bearish potential. However, the pattern itself simply indicates equilibrium between buyers and sellers, requiring additional analysis to determine directional implications.
Doji candles can signal potential reversals but cannot predict them with certainty. They indicate that the existing momentum is being challenged and that market sentiment may be shifting. When appearing after extended moves at key levels with proper confirmation, Doji patterns can be early warning signs of reversals. However, many Doji formations result in continuation rather than reversal, making confirmation essential before acting on reversal assumptions.
The price action following a Doji depends on various factors including market context, volume, and subsequent confirmation. Common outcomes include trend continuation after brief consolidation, significant reversal in the opposite direction, or extended sideways movement as indecision persists. The key is waiting for the next few candles to provide clarity about market direction rather than assuming any particular outcome immediately after the Doji formation.
Discover investment portfolios that are designed for maximum returns at low risk.
Learn how we choose the right asset mix for your risk profile across all market conditions.
Get weekly market insights and facts right in your inbox

It depicts the actual and verifiable returns generated by the portfolios of SEBI registered entities. Live performance does not include any backtested data or claim and does not guarantee future returns.
By proceeding, you understand that investments are subjected to market risks and agree that returns shown on the platform were not used as an advertisement or promotion to influence your investment decisions.
"I was drawn to Wright Research due to its multi-factor approach. Their Balanced MFT is an excellent product."

By Prashant Sharma
CTO, Zydus
By signing up, you agree to our Terms and Privacy Policy
"I was drawn to Wright Research due to its multi-factor approach. Their Balanced MFT is an excellent product."
By Prashant Sharma
CTO, Zydus
Skip Password
By signing up, you agree to our Terms and Privacy Policy
"I was drawn to Wright Research due to its multi-factor approach. Their Balanced MFT is an excellent product."
By Prashant Sharma
CTO, Zydus
"I was drawn to Wright Research due to its multi-factor approach. Their Balanced MFT is an excellent product."
By Prashant Sharma
CTO, Zydus
Log in with Password →
By logging in, you agree to our Terms and Privacy Policy
"I was drawn to Wright Research due to its multi-factor approach. Their Balanced MFT is an excellent product."
By Prashant Sharma
CTO, Zydus
Log in with OTP →
By logging in, you agree to our Terms and Privacy Policy
"I was drawn to Wright Research due to its multi-factor approach. Their Balanced MFT is an excellent product."
By Prashant Sharma
CTO, Zydus
Answer these questions to get a personalized portfolio or skip to see trending portfolios.
Answer these questions to get a personalized portfolio or skip to see trending portfolios.
(You can choose multiple options)
Answer these questions to get a personalized portfolio or skip to see trending portfolios.
Answer these questions to get a personalized portfolio or skip to see trending portfolios.
Answer these questions to get a personalized portfolio or skip to see trending portfolios.
(You can choose multiple options)
Investor Profile Score
We've tailored Portfolio Management services for your profile.
View Recommended Portfolios Restart


