by Naman Agarwal
Published On July 22, 2025
Trading in the Indian stock market can be both rewarding and challenging. Among the various obstacles that traders face, bull and bear traps stand out as some of the most deceptive and costly patterns. These false signals can quickly turn what appears to be a profitable opportunity into significant losses, catching even experienced traders off guard. Understanding these market traps and learning how to avoid them is crucial for anyone serious about trading success.
Bull and bear traps are essentially false breakouts that lure traders into positions based on misleading price movements. They occur when market manipulators or natural market dynamics create temporary price movements that appear to signal trend reversals or continuations, only to reverse sharply in the opposite direction. These traps are particularly dangerous because they often occur at critical support and resistance levels where traders naturally expect significant moves.
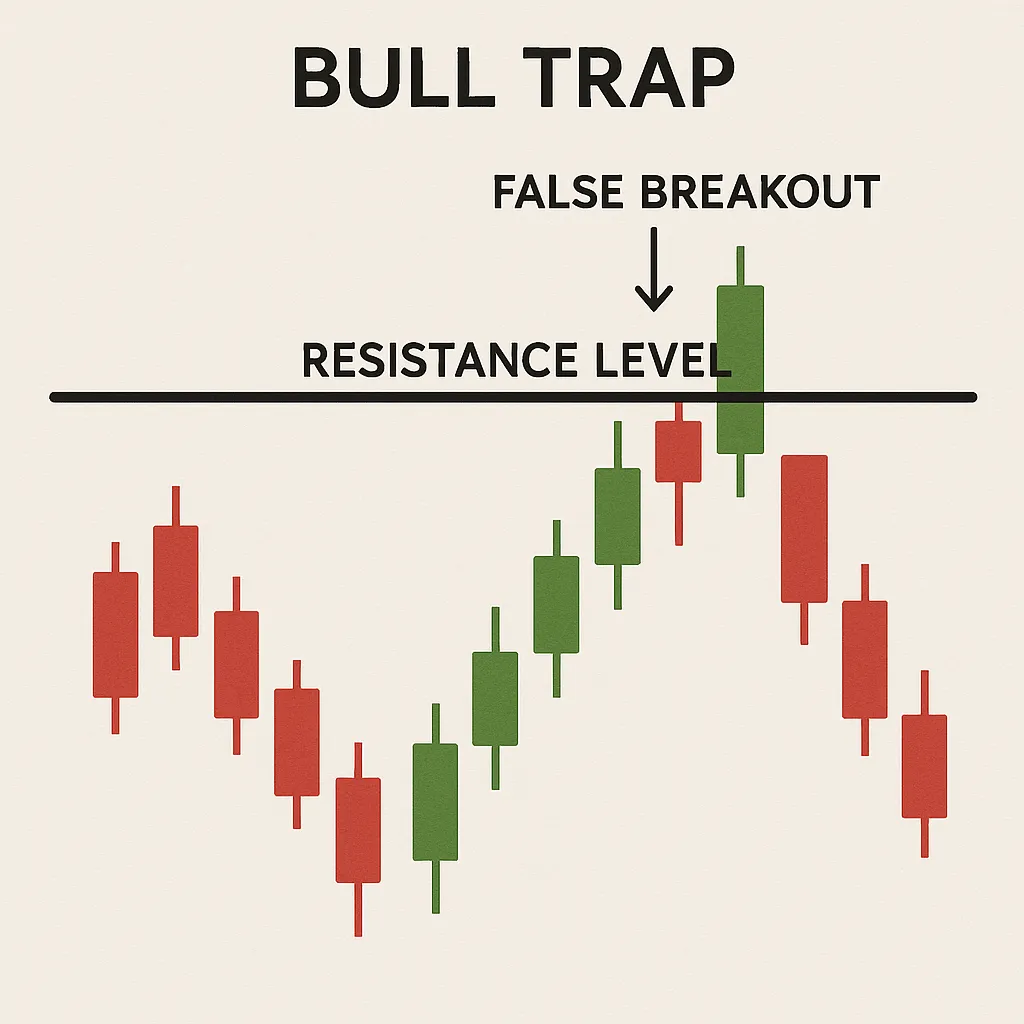
A bull trap occurs when the price of a stock or index appears to break above a resistance level, signaling a potential upward trend, but then quickly reverses and falls back below that resistance level. This false breakout tricks bullish traders into buying at what they believe is the start of an upward movement, only to find themselves trapped in losing positions as the price moves against them.
The psychology behind bull traps is rooted in market manipulation and natural trading behavior. After an extended downtrend or during sideways consolidation, traders watch resistance levels closely, waiting for a genuine breakout that would signal the end of bearish sentiment. When the price finally breaks above resistance, it creates excitement and attracts buyers who fear missing out on the anticipated rally. However, this breakout often lacks the volume and conviction needed to sustain higher prices, leading to a swift reversal that traps the late buyers.
Bull traps typically develop in specific market conditions that make them particularly effective at deceiving traders. The most common scenario occurs after a prolonged downtrend when the market appears ready for a reversal. During this phase, investors and traders become increasingly optimistic about the possibility of a recovery, making them more susceptible to false signals.
The formation of a bull trap often begins with a period of consolidation near resistance levels. During this consolidation, the price makes several attempts to break above resistance but fails to sustain those levels. This creates a pattern of higher lows and equal highs, which many traders interpret as building bullish momentum. When the price finally appears to break above resistance with some conviction, it attracts buying interest from various market participants.
Technical traders who rely on breakout strategies see this move as confirmation that the resistance level has been overcome and that higher prices are likely. Fundamental investors who have been waiting for signs of recovery interpret the breakout as validation of their bullish thesis. This combined buying pressure initially supports the breakout, making it appear genuine and sustainable.
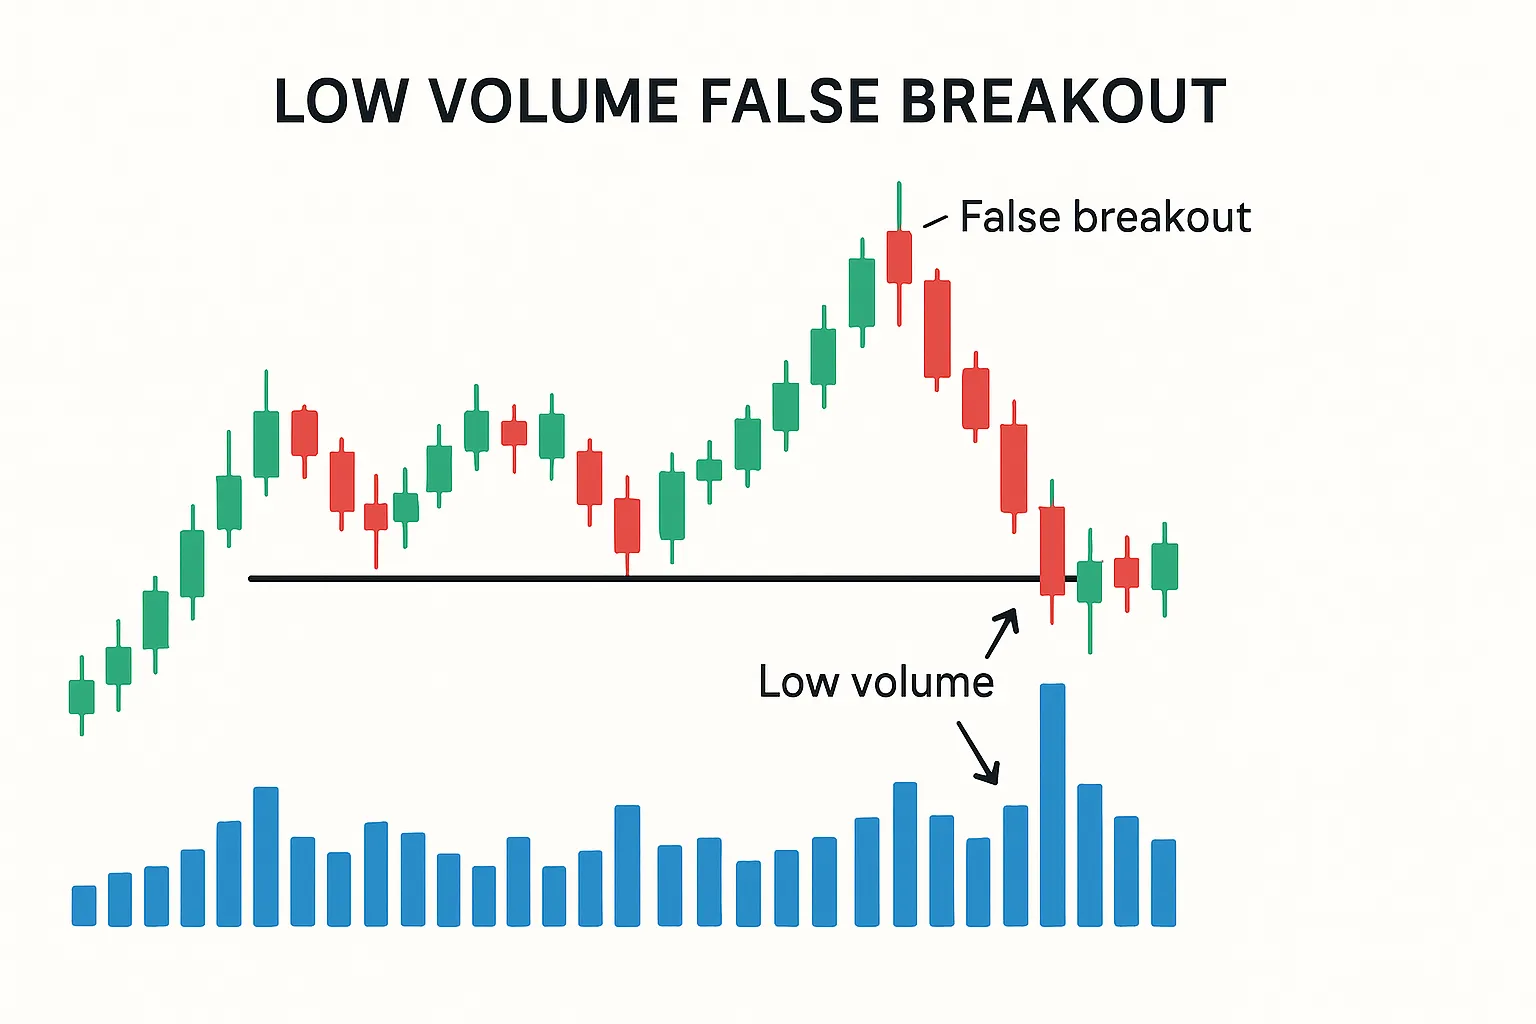
However, bull traps are characterized by several warning signs that experienced traders learn to recognize. The most significant red flag is low trading volume during the breakout. Genuine breakouts are typically accompanied by increased volume as more participants join the movement. When volume remains low or even decreases during a breakout, it suggests that the move lacks conviction and is likely to fail.
Another characteristic of bull traps is the rapid reversal that follows the initial breakout. Unlike genuine breakouts that may pause or consolidate before continuing higher, bull traps quickly reverse direction, often within the same trading session or over the next few days. This rapid reversal occurs because the buying pressure that created the breakout was not based on fundamental strength but rather on technical positioning and short-term speculation.
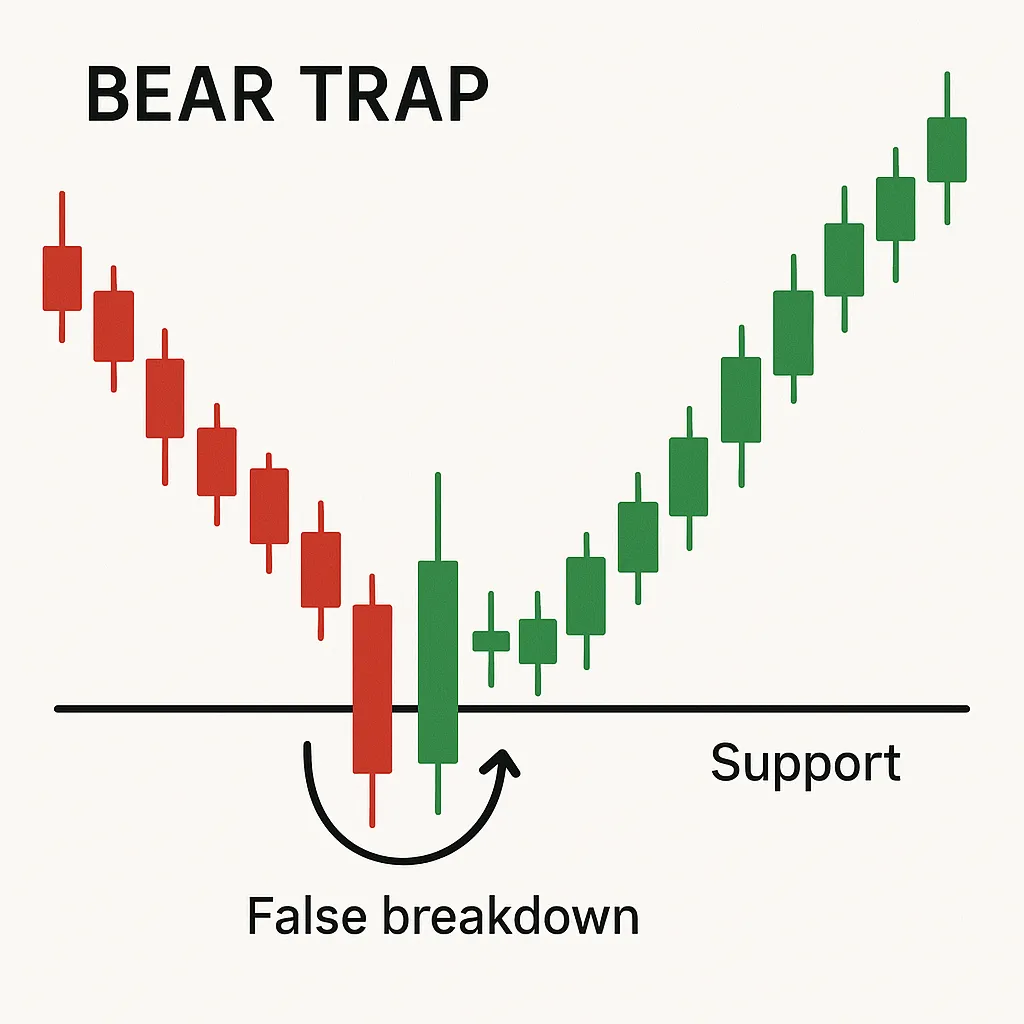
Conversely, a bear trap occurs when the price appears to break below a support level, suggesting a potential downward trend, but then quickly reverses and moves back above that support level. This false breakdown tricks bearish traders into selling or shorting at what they believe is the beginning of a decline, only to watch the price recover and move higher, trapping them in losing positions.
Bear traps often develop after extended uptrends or during periods of consolidation when traders become increasingly nervous about potential reversals. When the price finally breaks below a key support level, it triggers selling pressure from nervous holders and attracts short sellers who expect the decline to continue. However, this breakdown frequently lacks the sustained selling pressure needed to drive prices significantly lower, resulting in a sharp reversal that catches bears off guard.
Bear traps follow a similar pattern but in the opposite direction. They typically develop after extended uptrends when market sentiment begins to shift from optimism to caution. During this phase, traders become increasingly concerned about potential reversals and watch support levels closely for signs that the uptrend is ending.
The formation of a bear trap often starts with increased volatility and selling pressure near key support levels. The price may make several attempts to break below support, creating anxiety among holders and attracting short sellers who anticipate a significant decline. When the price finally appears to break below support with some momentum, it triggers additional selling from stop-loss orders and attracts more short sellers.
Technical traders interpret the breakdown as confirmation that the support level has failed and that lower prices are inevitable. This creates a self-reinforcing cycle where the expectation of further declines encourages more selling, initially supporting the breakdown and making it appear genuine.
However, bear traps are also characterized by specific warning signs. Similar to bull traps, genuine breakdowns are typically accompanied by increased volume as selling pressure intensifies. When volume remains relatively low during a breakdown, it suggests that the move may not be sustainable. Additionally, bear traps often feature sharp reversals that quickly bring the price back above the broken support level.
The psychology of bear traps is particularly powerful because they exploit traders' fear of losses. When prices break below key support levels, it triggers emotional responses that can lead to panic selling. This emotional component makes bear traps especially effective at trapping traders who act on fear rather than following disciplined trading strategies.
Successfully identifying bull and bear traps requires a combination of technical analysis skills and market psychology understanding. The most reliable indicators of potential traps involve volume analysis, candlestick patterns, and multiple timeframe analysis.
Volume analysis is perhaps the most important tool for identifying false breakouts. Genuine breakouts and breakdowns are characterized by significant increases in trading volume as more market participants join the movement. When a breakout occurs on low or decreasing volume, it suggests that the move lacks broad support and is likely to fail. Smart traders always check volume levels during breakouts and become suspicious when volume does not confirm the price movement.
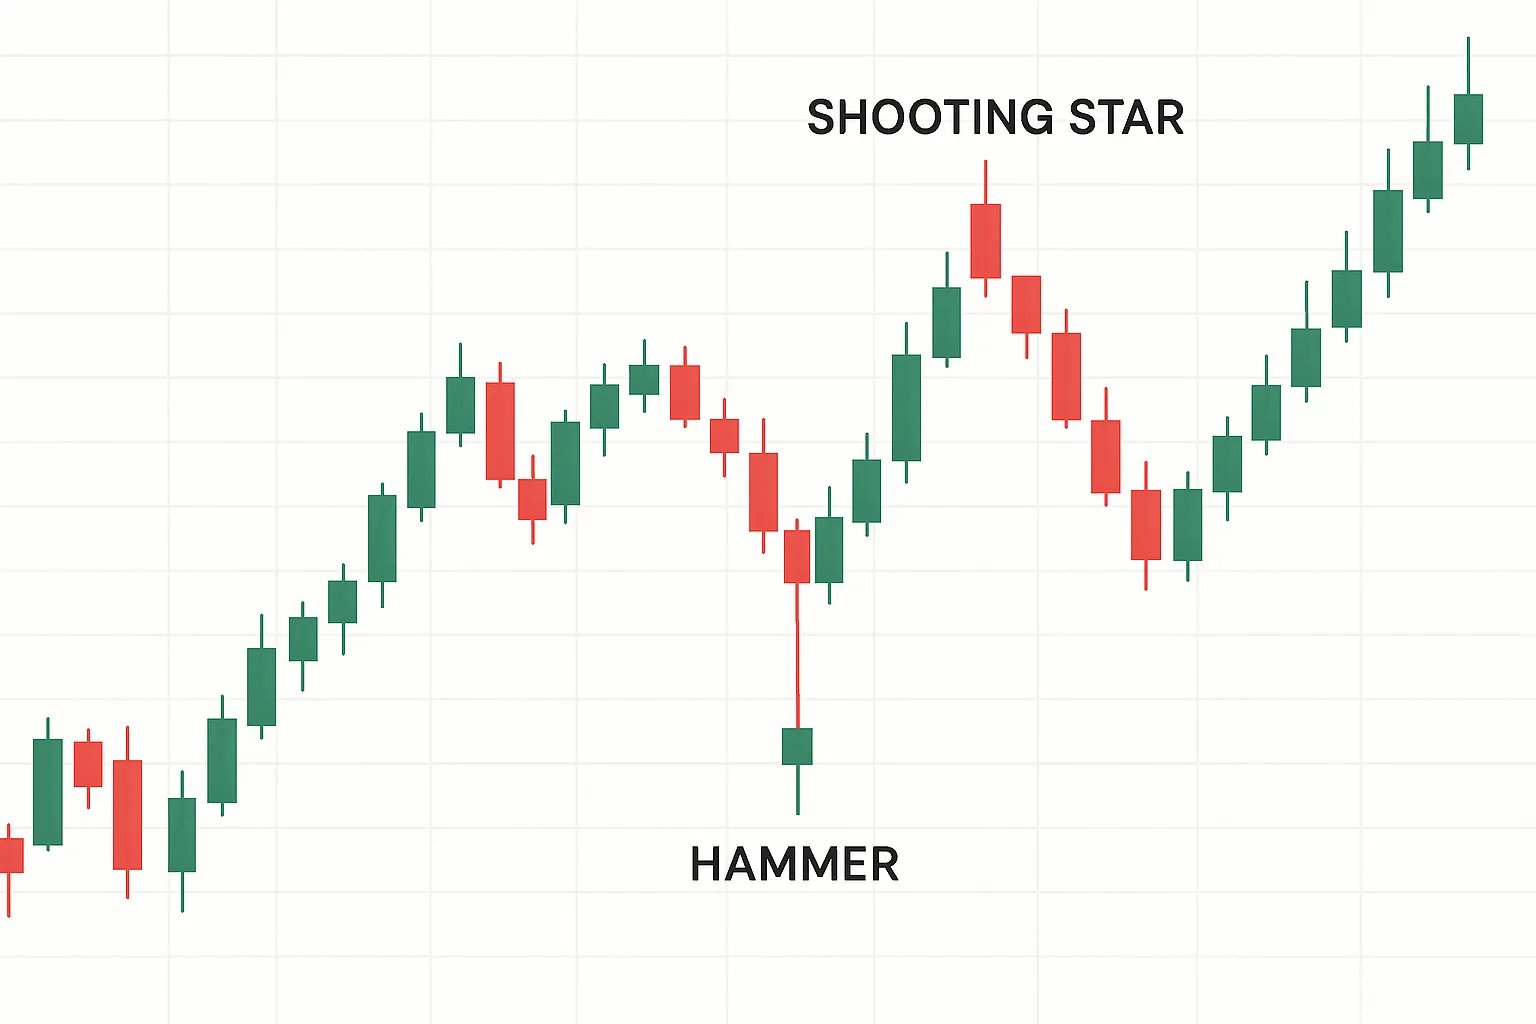
Candlestick patterns provide another valuable tool for identifying potential traps. Certain formations, such as shooting stars after breakouts or the hammer candlestick pattern appearing after a breakdown, can signal impending reversals. These patterns reflect the battle between buyers and sellers and often reveal when one side is losing strength despite apparent price momentum.
Multiple timeframe analysis helps traders distinguish between genuine breakouts and false signals by providing context for price movements. A breakout that appears significant on a short-term chart may look much less impressive when viewed on longer timeframes. Similarly, a breakdown that seems decisive on an hourly chart might appear as minor noise on a daily or weekly chart. By analyzing multiple timeframes, traders can better assess the true significance of price movements and avoid being misled by short-term fluctuations.
Support and resistance levels also play crucial roles in trap identification. False breakouts often occur near strong support or resistance levels that have been tested multiple times. When these levels are finally broken, it creates excitement, but the lack of follow-through often reveals the breakout as false. Experienced traders pay attention to how price behaves around these critical levels and look for confirmation before acting on apparent breakouts.
Avoiding bull and bear traps requires a systematic approach that combines technical analysis with disciplined risk management. The most effective strategies focus on confirmation rather than prediction, waiting for clear signals before entering positions and always having exit strategies in place.
One of the most important strategies is waiting for confirmation after apparent breakouts or breakdowns. Rather than entering positions immediately when prices break through key levels, experienced traders wait for additional confirmation signals. This might include sustained price movement beyond the breakout level, increased volume, or supportive candlestick patterns. While this approach may result in missing some genuine moves, it significantly reduces the risk of being caught in traps.
Volume confirmation is particularly crucial in this process. Before acting on any breakout or breakdown, traders should verify that volume supports the price movement. A general rule is that volume should be at least fifty percent above the average daily volume to confirm the validity of a breakout. When volume fails to support price movements, traders should exercise extreme caution and consider the possibility of a false signal.
Multiple timeframe analysis provides another layer of protection against traps. Before entering any position based on a breakout, traders should check longer timeframes to ensure that the move aligns with broader market trends. A bullish breakout on a fifteen-minute chart that contradicts a bearish trend on the daily chart is likely to fail. By maintaining awareness of multiple timeframes, traders can avoid being misled by short-term movements that lack broader context.
Stop-loss placement is critical for limiting damage when traps occur. Effective stop-loss strategies involve placing stops at logical levels that account for normal market volatility while protecting against significant adverse moves. For bullish positions entered on breakouts, stops should be placed below the breakout level or below recent swing lows. For bearish positions entered on breakdowns, stops should be placed above the breakdown level or above recent swing highs.
Proper risk management is essential for surviving bull and bear traps when they do occur. Even the most experienced traders occasionally get caught in traps, but effective risk management ensures that these losses remain manageable and do not significantly impact overall trading performance.
Position sizing is fundamental to risk management. Traders should never risk more than they can afford to lose on any single trade, regardless of how confident they feel about the setup. A common approach is the two percent rule, which limits risk on any individual trade to two percent of total trading capital. This approach ensures that even a series of losses will not devastate the trading account.
Diversification across different stocks, sectors, and timeframes can help reduce the impact of traps. When traders concentrate their positions in similar setups or closely correlated assets, they increase the risk that multiple positions will be affected by the same trap. By spreading risk across different opportunities, traders can limit the damage when traps occur.
Mental preparation is equally important. Traders should accept that traps are an inevitable part of trading and prepare psychologically to deal with them. This includes having clear rules for cutting losses, avoiding revenge trading after losses, and maintaining discipline even when emotions run high. Successful traders view traps as learning opportunities rather than failures and use them to refine their strategies.
Regular review and analysis of trades helps identify patterns and improve trap avoidance over time. By keeping detailed records of trades, including the reasoning behind entries and exits, traders can identify which types of setups consistently lead to traps and adjust their strategies accordingly. This continuous improvement process is essential for long-term trading success.
Indian stock market participants face unique challenges when dealing with bull and bear traps. The Indian market is influenced by various factors, including foreign institutional investor flows, domestic policy changes, and global economic conditions, which can create additional opportunities for traps to develop.
Market timing is particularly important in the Indian context. The opening session often experiences high volatility as the market reacts to overnight global developments and domestic news. During this period, false breakouts are common as initial reactions to news may be excessive. Traders should exercise extra caution during the first hour of trading and wait for the market to settle before acting on apparent signals.
Sector rotation plays a significant role in Indian markets, with different sectors experiencing varying levels of institutional interest. Bull and bear traps often develop when sector-specific news creates temporary excitement or pessimism that is not sustained. Traders should be aware of sector dynamics and avoid being caught up in temporary themes that may not have lasting impact.
News and event-driven trading requires special attention in Indian markets. Earnings announcements, policy changes, and global developments can create volatile conditions that increase trap frequency. Traders should be particularly cautious around major events and consider reducing position sizes or staying on the sidelines during high-impact news periods.
Bull and bear traps represent significant challenges for traders in Indian stock markets, but they can be managed effectively with proper knowledge and discipline. These deceptive patterns exploit natural human emotions and trading instincts, making them particularly dangerous for unprepared traders. However, by understanding how traps develop, learning to identify warning signs, and implementing proper risk management techniques, traders can protect themselves and even profit from these market dynamics.
The key to avoiding traps lies in patience, confirmation, and discipline. Rather than rushing into positions based on apparent breakouts or breakdowns, successful traders wait for multiple confirmation signals and always maintain proper risk management. Volume analysis, candlestick patterns, and multiple timeframe analysis provide valuable tools for distinguishing between genuine moves and false signals.
Risk management remains the ultimate protection against traps. Even when all analysis suggests a genuine breakout, proper position sizing and stop-loss placement ensure that wrong decisions do not result in catastrophic losses. The goal is not to avoid all losses but to ensure that losses remain small and manageable while allowing profits to accumulate over time.
For Indian traders, understanding the unique characteristics of local markets enhances trap avoidance strategies. Market timing, sector dynamics, and news-driven volatility all play important roles in trap development. By staying aware of these factors and adapting strategies accordingly, traders can navigate the challenging Indian market environment more successfully.
Ultimately, bull and bear traps are part of the natural market ecosystem. They serve important functions by providing liquidity and helping to establish fair prices, but they also create opportunities for prepared traders who understand their dynamics. Rather than fearing these patterns, traders should study them, learn from them, and develop the skills needed to navigate them successfully. With time, experience, and proper education, avoiding traps becomes second nature, allowing traders to focus on identifying and capitalizing on genuine market opportunities.
A bull trap occurs when the price of a stock or index breaks above a resistance level, giving the false impression that an upward trend is beginning. Traders who buy on this breakout often find themselves in losing positions as the price quickly reverses and falls back below resistance, “trapping” these buyers and leading to unexpected losses.
A bear trap happens when a price falls below a significant support level, convincing traders that a downward trend is starting. Many enter short or sell positions, only for the price to rapidly rebound above support. This traps bearish traders in losing trades, often forcing them to cover at a loss when the market moves up again.
Potential traps can be spotted by watching for low trading volume during breakouts or breakdowns, suspiciously quick reversals after breaking key levels, and “fake” candlestick patterns (like shooting stars after breakouts or hammers after breakdowns). Checking multiple timeframes and ensuring confirmation such as a strong close beyond the level with higher volume can help avoid the traps.
The most effective strategies include waiting for additional confirmation before acting on breakouts or breakdowns, monitoring trading volume for genuine conviction, using multiple timeframe analysis, and always placing stop-loss orders at logical levels. Patience, discipline, and clear risk management rules are your best defenses.
If you find yourself caught in a trap, do not panic or attempt to “average down.” Stick to your stop-loss discipline to limit losses. Review your trade to understand what went wrong , were there missed warning signs? Use each experience as a learning opportunity and focus on refining your strategy for future trades.
Discover investment portfolios that are designed for maximum returns at low risk.
Learn how we choose the right asset mix for your risk profile across all market conditions.
Get weekly market insights and facts right in your inbox

It depicts the actual and verifiable returns generated by the portfolios of SEBI registered entities. Live performance does not include any backtested data or claim and does not guarantee future returns.
By proceeding, you understand that investments are subjected to market risks and agree that returns shown on the platform were not used as an advertisement or promotion to influence your investment decisions.
"I was drawn to Wright Research due to its multi-factor approach. Their Balanced MFT is an excellent product."

By Prashant Sharma
CTO, Zydus
By signing up, you agree to our Terms and Privacy Policy
"I was drawn to Wright Research due to its multi-factor approach. Their Balanced MFT is an excellent product."
By Prashant Sharma
CTO, Zydus
Skip Password
By signing up, you agree to our Terms and Privacy Policy
"I was drawn to Wright Research due to its multi-factor approach. Their Balanced MFT is an excellent product."
By Prashant Sharma
CTO, Zydus
"I was drawn to Wright Research due to its multi-factor approach. Their Balanced MFT is an excellent product."
By Prashant Sharma
CTO, Zydus
Log in with Password →
By logging in, you agree to our Terms and Privacy Policy
"I was drawn to Wright Research due to its multi-factor approach. Their Balanced MFT is an excellent product."
By Prashant Sharma
CTO, Zydus
Log in with OTP →
By logging in, you agree to our Terms and Privacy Policy
"I was drawn to Wright Research due to its multi-factor approach. Their Balanced MFT is an excellent product."
By Prashant Sharma
CTO, Zydus
Answer these questions to get a personalized portfolio or skip to see trending portfolios.
Answer these questions to get a personalized portfolio or skip to see trending portfolios.
(You can choose multiple options)
Answer these questions to get a personalized portfolio or skip to see trending portfolios.
Answer these questions to get a personalized portfolio or skip to see trending portfolios.
Answer these questions to get a personalized portfolio or skip to see trending portfolios.
(You can choose multiple options)
Investor Profile Score
We've tailored Portfolio Management services for your profile.
View Recommended Portfolios Restart


