The Nifty 50 peaked at 26,373 on 5 January 2026. As of 20 March 2026, it had declined to 23,114, a drawdown of approximately 14.09%.
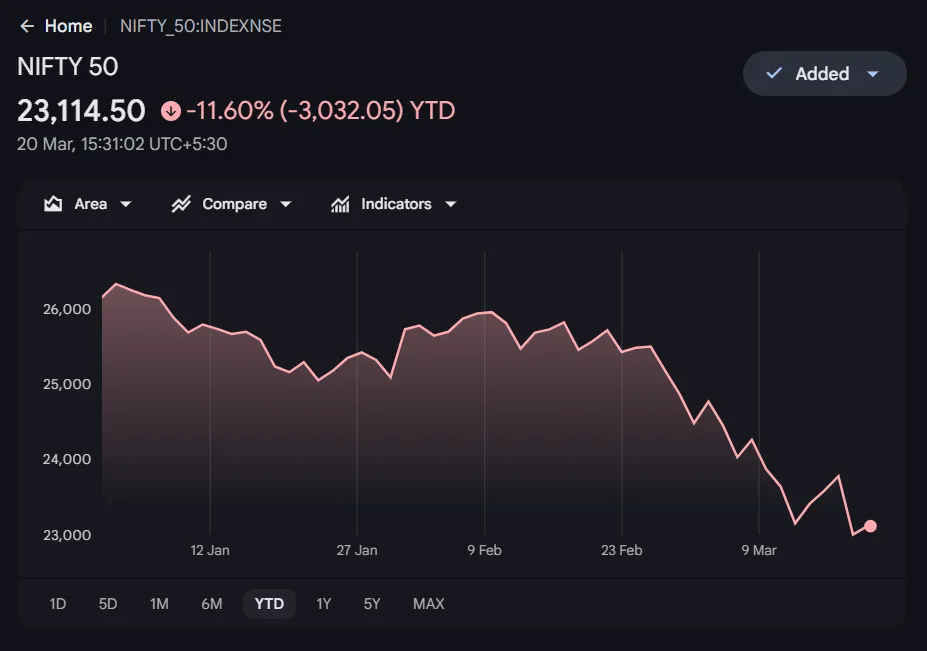
The correction has been driven by FII outflows, earnings deceleration, elevated crude oil prices, and geopolitical tensions in the middle east. Today, we examine the current correction through the lens of historical drawdown data compiled by JM Financial, covering 12 major drawdown episodes since 1990. The goal is to identify where the current correction sits relative to past cycles and what the data suggests about potential outcomes.
Drawdowns are classified as exceeding 15% from the peak. The current correction, at -14.09%, has not yet crossed that threshold - but we are close to it. However, the analysis remains relevant because the correction is ongoing and deepening, with the index hitting its trough of 22,930 on 19 March and showing marginal reversal on Friday, 20th March 2026.
Not all corrections are the same. Looking at the data across 35 years, drawdowns fall into 3 distinct categories based on what triggered them. Each behaves differently in terms of how deep the fall goes, how long it lasts, and how strong the recovery is.
The Nifty experienced event-driven shocks in 1990, 2004, 2015, and 2020. In these episodes, a sudden global or domestic event triggered a sharp selloff. The Indian market was typically a secondary casualty, reacting to news rather than suffering from internal weakness.
On average, these corrections dragged the index down by 34.3% and lasted about 5 months. The recovery was rapid and strong. Investors who entered at the bottom saw an average return of 72.4% over the following 12 months. The COVID-19 crash of 2020 is a textbook example: a 40% fall followed by a full recovery within 10 months. Of all drawdown types, event shocks offer the best entry point.
Liquidity-driven corrections occurred in 1994, 2006, 2008, 2010, 2021, and 2024. These are characterised by heavy foreign institutional investor selling, and rate-sensitive sectors tend to lead the decline.
The average fall was 36.2%, spread over roughly 10 months, with a 12-month post-bottom return of 61.6%. What makes this category tricky is that the duration is unpredictable. The 2006 correction was over in a single month. The 1994 episode went on for 27 months. Investors need to pay close attention to FII flow data and interest rate signals to gauge where they are in the cycle.
The 1992 and 2000 corrections were structural in nature. Both involved fundamental problems such as domestic earnings collapses, governance crises, or speculative bubbles unwinding.
The average decline was 53.3%, lasting 16 months. The 12-month return from the bottom averaged 53.6%, the lowest of the 3 types. These are the most damaging corrections because the recovery requires an actual reset in corporate earnings before the market can sustain an uptrend. The 2000 dot-com bust, for instance, took approximately 46 months for a full recovery.
The data currently points to a Liquidity Shock with a mild Structural overlay. FII outflows have been massive at an estimated Rs 1.8 to Rs. 2 lakh crore between October 2021 and April 2025.
Nifty EPS growth has slowed to around 12%. The market was trading at premium valuations before the selloff began. This combination of liquidity withdrawal and earnings deceleration is consistent with the Liquidity Shock, but the earnings slowdown adds a structural dimension that could extend the recovery timeline.
Event Shock | Liquidity Shock | Structural | |
Avg Drawdown | -34.3% | -36.2% | -53.3% |
Avg Duration | 5 months | 10 months | 16 months |
12M Return from Bottom | +72.4% | +61.6% | +53.6% |
Key Driver | Global event | FII outflows | Earnings/governance |
Drawdowns can also be classified by how far the market actually falls. This matters because the depth of the correction directly affects how long recovery takes and how large the subsequent returns are.
Mild corrections (15–30% decline) are the most frequent, accounting for about 33% of all historical corrections. They bottom out quickly with about 4 months on average and recover within 8 months. The 2004, 2006, 2016, and 2024 corrections all fell into this category.
Moderate corrections (30–50% decline) are the most common regime at 42% of all historical corrections. They take about 9 months to bottom and 23 months to recover. An event-driven moderate correction like in 2020, recovers far faster than a liquidity-driven one like the one we saw in 1994. This regime delivers the highest 12-month median return from the bottom at +81.8%.
Severe corrections (>50% decline) have occurred three times: 1992, 1994, and 2008. These take an average of 19 months to reach the bottom and 42 months to recover. The 2008 global financial crisis saw the Nifty fall nearly 65%, requiring around 71 months for a full recovery. With severe corrections, do not try to catch a falling knife. Wait at least 9 months before taking positions.
The current correction at -14.09% across the last 2.5 months is heading toward the Mild category but has not yet breached the 15% threshold.
Mild | Moderate | Severe | Current | |
Drawdown Range | 15–30% | 30–50% | >50% | -13.05% |
Frequency | 4 of 12 (33%) | 5 of 12 (42%) | 3 of 12 (25%) | — |
Time to Bottom | 4 months | 9 months | 19 months | 2.5 months |
Recovery Time | 8 months | 23 months | 42 months | TBD |
12M Return | +38.2% | +81.8% | +72.1% | TBD |
Breadth data from the Nifty 500 paints a picture of broad weakness. Only 14% of stocks are trading above their 20-day moving average, 20% above their 50-day average, and 24% above their 200-day average. All three readings are deep in the historical oversold zone of 10–20%.
This is relevant because past instances of breadth falling to these levels have frequently preceded strong bounces. However, oversold does not mean the bottom is in. Confirmation from price action, volume, and support levels holding is necessary before drawing that conclusion. The signal here is that the conditions for a mean-reversion rally are forming, but the timing remains uncertain.
Across all 12 historical drawdowns, the returns after the market bottoms have been consistently positive. The table below summarises the post-bottom performance at different time horizons.
Horizon | Mean | Median | Min | Max | Std Dev |
1 Month | +18.2% | +16.5% | +10.1% | +31.3% | ±5.9% |
3 Months | +23.6% | +24.5% | +12.6% | +38.3% | ±7.8% |
6 Months | +39.5% | +43.1% | +16.5% | +60.2% | ±15.9% |
12 Months | +62.3% | +66.4% | +13.9% | +118.9% | ±33.0% |
Two things stand out. First, the 1-month return window has the tightest dispersion (±5.9%), meaning the early post-bottom period is the most predictable in terms of risk-adjusted returns. If you can identify the bottom, the first month offers the most reliable gains.
Second, by the 12-month mark, the standard deviation balloons to ±33.0%. At that horizon, the type of correction matters enormously for position sizing. Moderate corrections have historically delivered +81.8% median returns, while mild ones returned +38.2%.
Historical data maps the Nifty cycle into 4 distinct phases.
During the Expansion phase, the market gains an average of 49.4% from trough to peak (median 43.9%). Any gain above 80% is a warning sign of overheating.
The Distribution phase typically lasts 24–30 months after the peak, during which the market tops out, moves sideways, and then begins to sell off.
The Contraction phase where we see the actual decline averages around 10 months, but ranges from 2–4 months for event shocks to 19–27 months for structural corrections.
Finally, the Recovery phase takes an average of 23 months to reach new highs, though event-driven recoveries can complete in as little as 5–10 months.
One consistent finding: 12-month returns from the bottom have been positive in every single historical episode.
Much of the bad news is already reflected in current prices. The market has had time to digest the Fed’s higher-for-longer rate stance. Nifty EPS growth has visibly decelerated to around 12%, and that slowdown is well understood. FII outflows are estimated at Rs 1.8–2 lakh crore between October 2021 and April 2025 and have been a persistent drag. The valuation premium that the market carried into 2026 has largely corrected. In short, the known headwinds are in the price.
What could move the market higher from here are the things that haven’t happened yet.
A Fed rate cut cycle, if it materialises, would be a genuine upside surprise and something the market is not positioned for it.
A pickup in domestic consumption, supported by the government’s post-budget capital expenditure push, could reignite earnings growth. FII flows could reverse; India remains the strongest structural story among emerging markets, and when global risk appetite returns, foreign capital tends to follow.
Sector-specific earnings beats in BFSI, Pharma, or Consumer names would provide further fuel.
And any de-escalation in the West Asia conflict which is currently the single largest overhang would remove a significant source of uncertainty.
That said, the downside risks are not hypothetical. Brokerages have been cutting their Nifty targets in response to the evolving situation. Nomura has lowered its December 2026 target to 24,900, a 15% reduction from its earlier estimate of 29,300, citing 10–15% risk to FY27 consensus earnings if crude oil remains elevated. Citi has trimmed its target to 27,000 from 28,500. Emkay has gone further, warning that the Nifty could fall to 21,000 if oil prices stay above $100 per barrel for 3 to 4 months.
The numbers behind these warnings are worth understanding. If supply disruptions from the Middle East conflict persist for 3 months, the estimated impact on India includes a 20–30 basis point hit to FY27 GDP growth, a 50–75 basis point increase in inflation, a 10 basis point widening of the fiscal deficit, and an additional $25 billion added to the current account deficit. These are base case estimates from major brokerages given current oil prices above $114 per barrel.
Within the Nifty 100, certain pockets have shown relative strength during the selloff.
Power stocks have been the standout names like NTPC, Powergrid, Tata Power, Coal India, and Adani Power have held up well.
Metals (Hindalco, JSW Steel, Tata Steel, Vedanta, Jindal Steel) have also outperformed, likely benefiting from commodity tailwinds.
In Banking, public sector names like Bank of Baroda, SBI, and Canara Bank have fared better than their private sector peers.
Pharma (Apollo Hospitals, Dr. Reddy’s, Torrent Pharma), Auto (Eicher, Hero Moto, TVS Motor, Motherson), Capital Goods (ABB, BEL), and select Financial Services (PFC, Shriram Finance, SBI Life) round out the list of relative outperformers.
Across 35 years and 12 major drawdowns data tells a consistent story. Every Nifty correction has eventually been followed by positive 12-month returns from the bottom. The average post-bottom return across all regimes is +62.3%. The hard part is identifying the bottom while it is happening.
If this turns out to be a Mild correction, history suggests the bottom could form within the next 1–2 months, with recovery taking about 8 months and a 12-month return of around +38%.
If the correction deepens into Moderate territory (30–50%), recovery will stretch to 23 months, but the subsequent returns would be significantly higher.
Until one of these scenarios plays out, the data favours selective accumulation in quality names, with position sizing calibrated to the regime type. The first month after the bottom has historically been the highest-conviction entry window. The key variables to watch are crude oil prices and the Middle East conflict.
Discover investment portfolios that are designed for maximum returns at low risk.
Learn how we choose the right asset mix for your risk profile across all market conditions.
Get weekly market insights and facts right in your inbox

It depicts the actual and verifiable returns generated by the portfolios of SEBI registered entities. Live performance does not include any backtested data or claim and does not guarantee future returns.
By proceeding, you understand that investments are subjected to market risks and agree that returns shown on the platform were not used as an advertisement or promotion to influence your investment decisions.
"I was drawn to Wright Research due to its multi-factor approach. Their Balanced MFT is an excellent product."

By Prashant Sharma
CTO, Zydus
By signing up, you agree to our Terms and Privacy Policy
"I was drawn to Wright Research due to its multi-factor approach. Their Balanced MFT is an excellent product."
By Prashant Sharma
CTO, Zydus
Skip Password
By signing up, you agree to our Terms and Privacy Policy
"I was drawn to Wright Research due to its multi-factor approach. Their Balanced MFT is an excellent product."
By Prashant Sharma
CTO, Zydus
"I was drawn to Wright Research due to its multi-factor approach. Their Balanced MFT is an excellent product."
By Prashant Sharma
CTO, Zydus
Log in with Password →
By logging in, you agree to our Terms and Privacy Policy
"I was drawn to Wright Research due to its multi-factor approach. Their Balanced MFT is an excellent product."
By Prashant Sharma
CTO, Zydus
Log in with OTP →
By logging in, you agree to our Terms and Privacy Policy
"I was drawn to Wright Research due to its multi-factor approach. Their Balanced MFT is an excellent product."
By Prashant Sharma
CTO, Zydus
Answer these questions to get a personalized portfolio or skip to see trending portfolios.
Answer these questions to get a personalized portfolio or skip to see trending portfolios.
(You can choose multiple options)
Answer these questions to get a personalized portfolio or skip to see trending portfolios.
Answer these questions to get a personalized portfolio or skip to see trending portfolios.
Answer these questions to get a personalized portfolio or skip to see trending portfolios.
(You can choose multiple options)
Investor Profile Score
We've tailored Portfolio Management services for your profile.
View Recommended Portfolios Restart


