by Naman Agarwal
Published On Aug. 19, 2025
Trading in the Indian stock market requires precision, discipline, and a solid understanding of market dynamics. Among the most challenging yet rewarding approaches is reversal trading strategy, which focuses on identifying turning points where established trends change direction. Unlike trend-following strategies that capitalize on momentum continuation, reversal trading demands traders to anticipate and act upon market shifts before they become obvious to the broader trading community.
A reversal trading strategy represents a sophisticated approach where traders seek to identify exhaustion points in existing trends and position themselves for potential trend changes. This strategy is particularly relevant for Indian traders operating in volatile markets like Nifty, Bank Nifty, and individual stocks, where sharp reversals can create substantial profit opportunities. The best reversal strategy combines multiple technical indicators, price action analysis, and market sentiment evaluation to increase the probability of successful trades. Successful reversal traders understand that these strategies carry higher risks than trend-following approaches, but they also offer the potential for significant returns when executed correctly. The key lies in recognizing momentum exhaustion, identifying rejection patterns at critical levels, and understanding the psychology behind market participants' behavior during trend transitions.
Reversal trading is a systematic approach that focuses on identifying and capitalizing on significant changes in market direction. This strategy operates on the principle that all trends eventually exhaust themselves, creating opportunities for traders who can anticipate these turning points.
The fundamental mechanism of reversal trading involves recognizing when buying or selling pressure reaches unsustainable levels. When a bullish trend begins to show signs of exhaustion such as decreasing volume, momentum divergences, or failure to break key resistance levels, reversal traders prepare for potential downward movement. Conversely, when bearish trends show similar exhaustion signals near support levels, traders look for opportunities to enter long positions.
For Indian traders, reversal trading works particularly well in volatile markets where sharp corrections and rallies are common. The strategy requires traders to act contrary to prevailing sentiment, buying when others are selling (in oversold conditions) and selling when others are buying (in overbought conditions).
Understanding the characteristics that define high-probability reversal setups is crucial for developing a reliable reversal trading strategy. These traits help traders distinguish between temporary pullbacks and genuine trend changes.
Strong reversal opportunities typically exhibit several key characteristics that experienced traders learn to recognize:
Momentum Exhaustion Signals: The most reliable reversal setups occur when momentum indicators like RSI, MACD, or Stochastic begin diverging from price action. This divergence suggests that the underlying strength of the trend is weakening even if prices continue moving in the trend direction.
Volume Confirmation: Authentic reversals are often accompanied by significant changes in trading volume. In bearish reversals, you'll typically see volume spikes during selling phases, while bullish reversals show increased volume during buying pressure.
Rejection Candles at Key Levels: Strong reversal opportunities frequently manifest as rejection candlesticks (like doji, hammers, or shooting stars) at critical support or resistance levels. These patterns indicate indecision and potential trend changes.youtube
Support and Resistance Flips: When previous support becomes resistance or vice versa, it creates powerful reversal opportunities. These flips represent significant psychological levels where trader sentiment shifts.
Multiple Timeframe Confirmation: The strongest reversals show alignment across different timeframes, with both short-term and longer-term charts displaying similar reversal signals.
Successful implementation of the best reversal strategy requires mastering various techniques for identifying potential trend changes. Each method provides unique insights into market behavior and participant psychology.
Technical Indicator Analysis: Oscillators like RSI, MACD, and Stochastic are primary tools for reversal identification. Look for:
Overbought conditions (RSI above 70) in uptrends
Oversold conditions (RSI below 30) in downtrends
MACD line crossing below or above the signal line
Stochastic showing extreme readings with divergence patterns
Chart Pattern Recognition: Classical reversal patterns provide visual confirmation of trend changes:
Head and shoulders formations indicating bearish reversals
Inverse head and shoulders suggesting bullish reversals
Double tops and bottoms showing exhaustion at key levels
Triple tops/bottoms confirming strong resistance/support zones
Volume Analysis: Volume behavior offers crucial insights into reversal potential:
Climax volume at trend extremes
Volume divergence where price makes new highs/lows but volume declines
Exhaustion gaps with high volume indicating trend completion
Price Action Techniques: Pure price action provides immediate reversal signals:
Rejection candlesticks at key levels
Break of trend lines or channels
Failure to maintain momentum at previous support/resistance levels
The RSI Divergence strategy represents one of the most reliable approaches for identifying potential trend reversals. This method focuses on identifying situations where price action and the RSI indicator move in opposite directions, signaling weakening momentum.
Implementation Process:
Monitor for bullish divergence: Price makes lower lows while RSI forms higher lows
Watch for bearish divergence: Price creates higher highs while RSI shows lower highs
Confirm with additional indicators like volume or candlestick patterns
Enter trades after divergence confirmation with appropriate risk management
Best Market Conditions: This strategy works exceptionally well in trending markets where clear momentum patterns exist. Avoid using during sideways or highly volatile conditions.
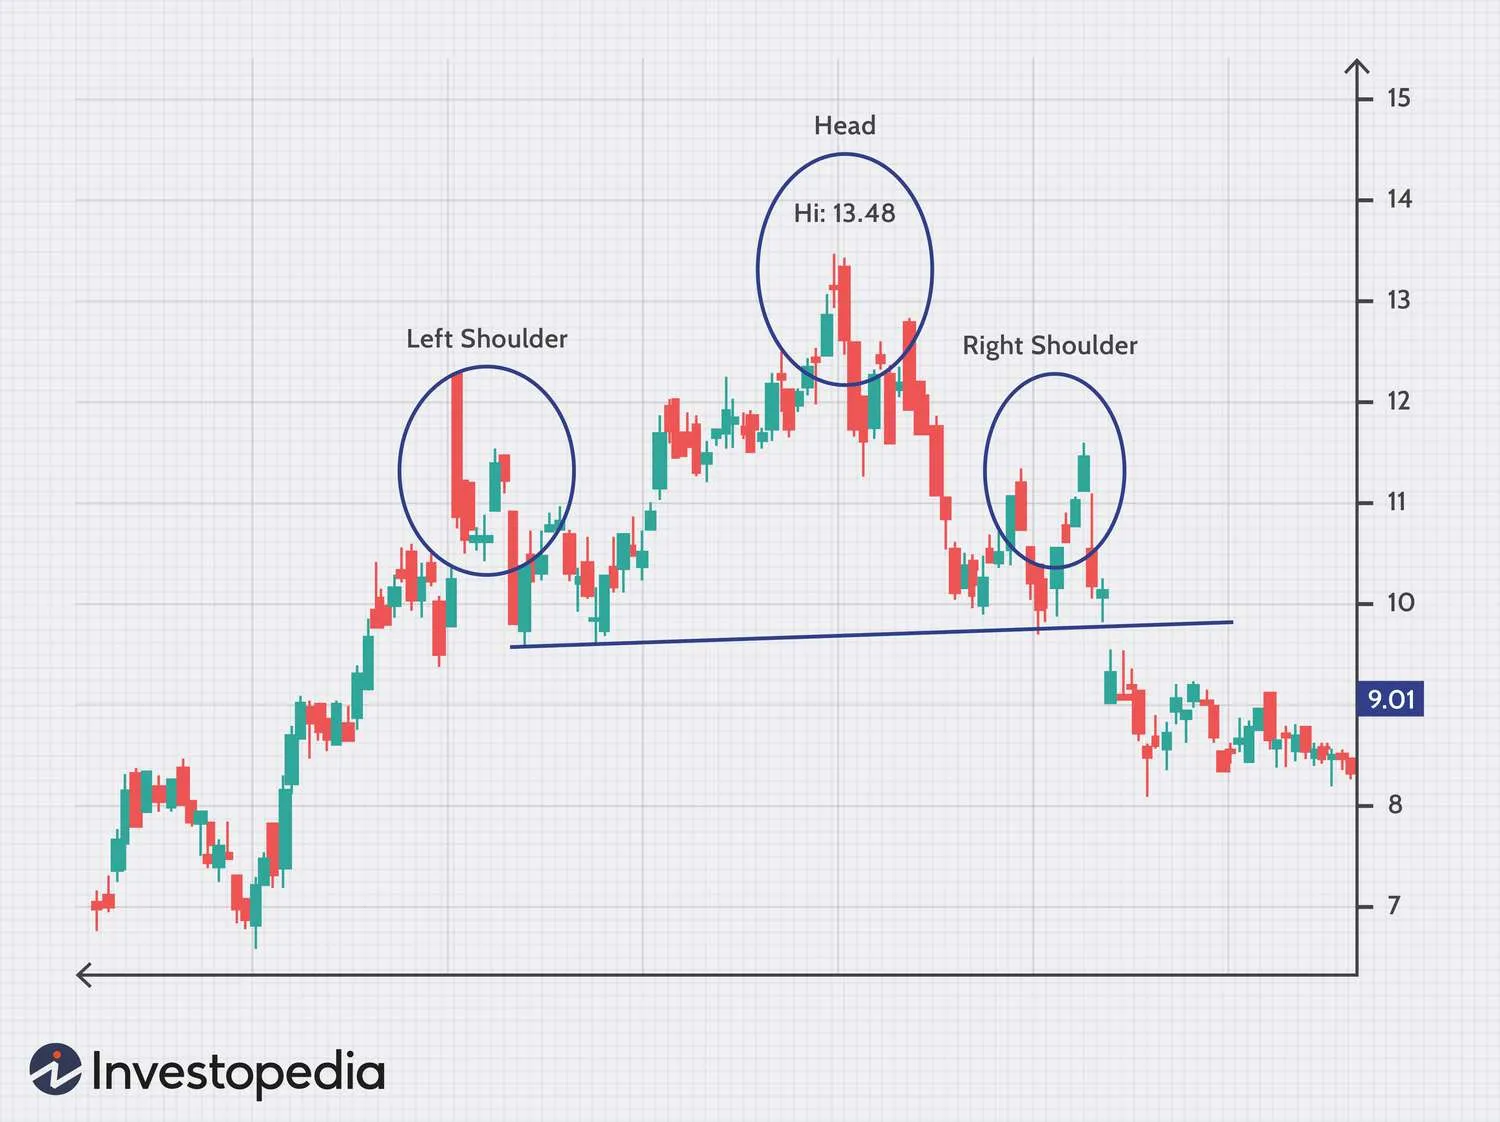
The Head and Shoulders formation remains one of the most recognized and reliable reversal patterns in technical analysis. This pattern signals the end of uptrends (standard head and shoulders) or downtrends (inverse head and shoulders).
Pattern Characteristics:
Three peaks with the middle peak (head) higher than the shoulders
Neckline formed by connecting the lows between peaks
Volume typically decreases during pattern formation
Breakout below neckline confirms reversal
Trading Approach: Enter short positions on neckline breaks with stops above the right shoulder. Target levels can be calculated by measuring the distance from head to neckline.
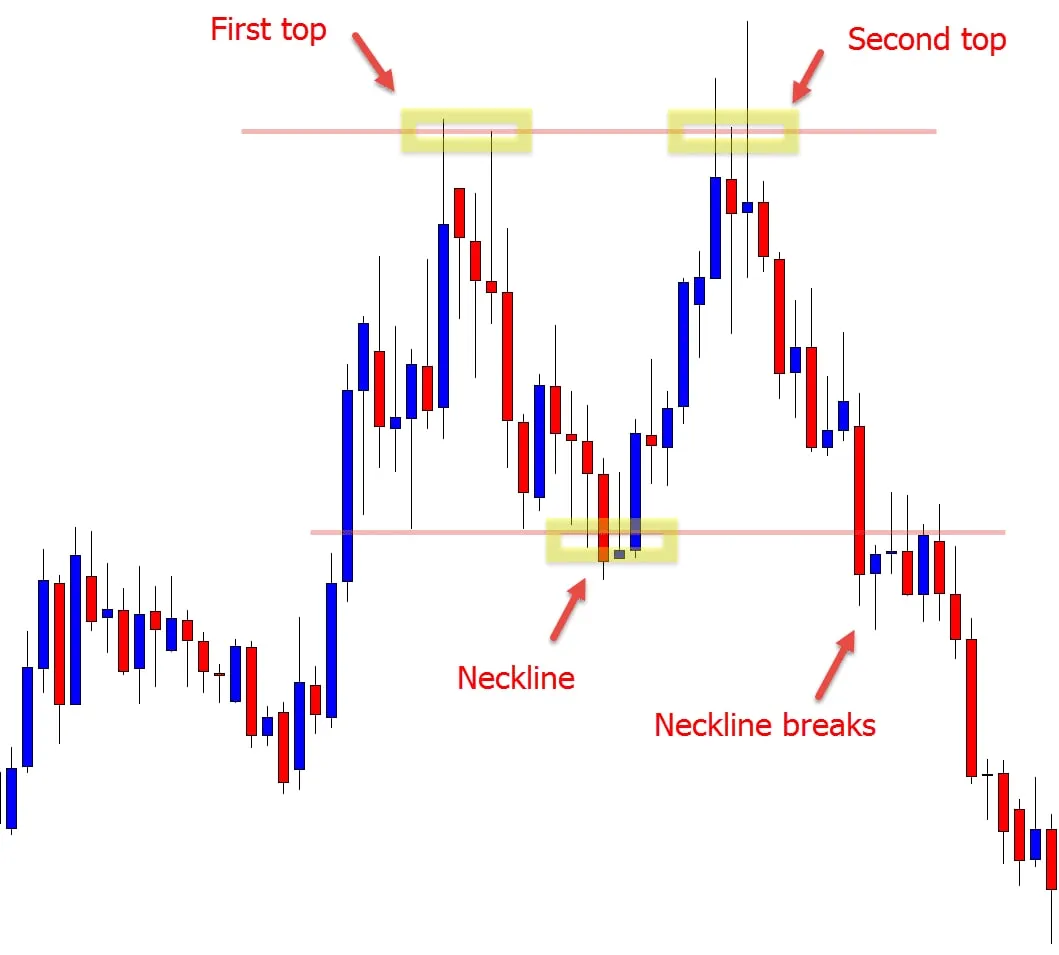
Double tops and bottoms represent exhaustion patterns where price tests previous extremes but fails to break through, indicating potential reversals.
Key Elements:
Two peaks (double top) or troughs (double bottom) at approximately equal levels
Significant time between the formations (weeks to months)
Volume confirmation on the second peak/trough
Break of support/resistance between the formations confirms reversal
Entry Criteria: Wait for clear breaks of the intermediate support/resistance level with volume confirmation before entering positions.
This strategy capitalizes on the psychological principle that previous support becomes resistance and vice versa after breaks occur.
Implementation Guidelines:
Identify strong historical support or resistance levels
Monitor for decisive breaks with volume
Wait for price to retest the flipped level
Enter trades when the flip is confirmed with rejection patterns
Psychology Behind the Strategy: Traders who were previously long at support levels become sellers at the same level once it becomes resistance, creating selling pressure.
The Momentum Exhaustion strategy identifies when trends lose steam through various technical indicators and market behavior patterns.
Key Indicators:
Decreasing volume during trend continuation
Momentum indicators failing to confirm new price extremes
Increased volatility and choppy price action
Gap formations suggesting climax conditions
Entry Timing: Wait for multiple confirmation signals before entering positions, as momentum exhaustion can be a gradual process.
Proper timing is critical when implementing reversal trading strategies, as entering too early or too late can significantly impact profitability. The reversal trading strategy requires precision in execution to maximize success rates.
Multiple Timeframe Analysis: Always confirm reversal signals across different timeframes. A reversal signal on a daily chart should align with similar signals on 4-hour or weekly charts for maximum reliability.
Confirmation Techniques:
Wait for candlestick close confirmation rather than intraday signals
Look for volume expansion during breakouts or reversals
Use momentum indicators to confirm signal strength
Monitor for follow-through in subsequent trading sessions
Risk Assessment Before Entry:
Measure potential risk-to-reward ratios before entering trades
Identify clear invalidation levels for stop-loss placement
Consider market volatility and recent price behavior
Evaluate broader market conditions and sentiment
Staged Entry Approach: Rather than entering full positions immediately, consider scaling into trades as additional confirmation arrives. This approach reduces risk while maintaining profit potential.
Effective position management separates successful reversal traders from those who struggle with this challenging strategy. The best reversal strategy incorporates comprehensive planning for both profitable and losing scenarios.
Position Sizing Guidelines:
Market Volatility | Position Size | Risk Per Trade |
Low Volatility | 2-3% of capital | 1-1.5% risk |
Medium Volatility | 1-2% of capital | 0.5-1% risk |
High Volatility | 0.5-1% of capital | 0.25-0.5% risk |
Stop-Loss Placement:
Place stops beyond recent swing highs/lows rather than pattern boundaries
Use volatility-based stops (ATR multiples) for dynamic adjustment
Implement trailing stops once trades move in your favor
Never risk more than 2% of total capital on any single reversal trade
Profit Target Setting:
Use measured moves from pattern heights for initial targets
Identify previous support/resistance levels as potential exit points
Scale out of positions at predetermined levels
Hold core positions for major trend changes while taking partial profits
Exit Strategy Framework:
Define specific conditions for trade invalidation
Establish time-based exits if trades don't perform as expected
Monitor for signs of trend resumption that negate reversal thesis
Use trailing stops to protect profits while allowing for extended moves
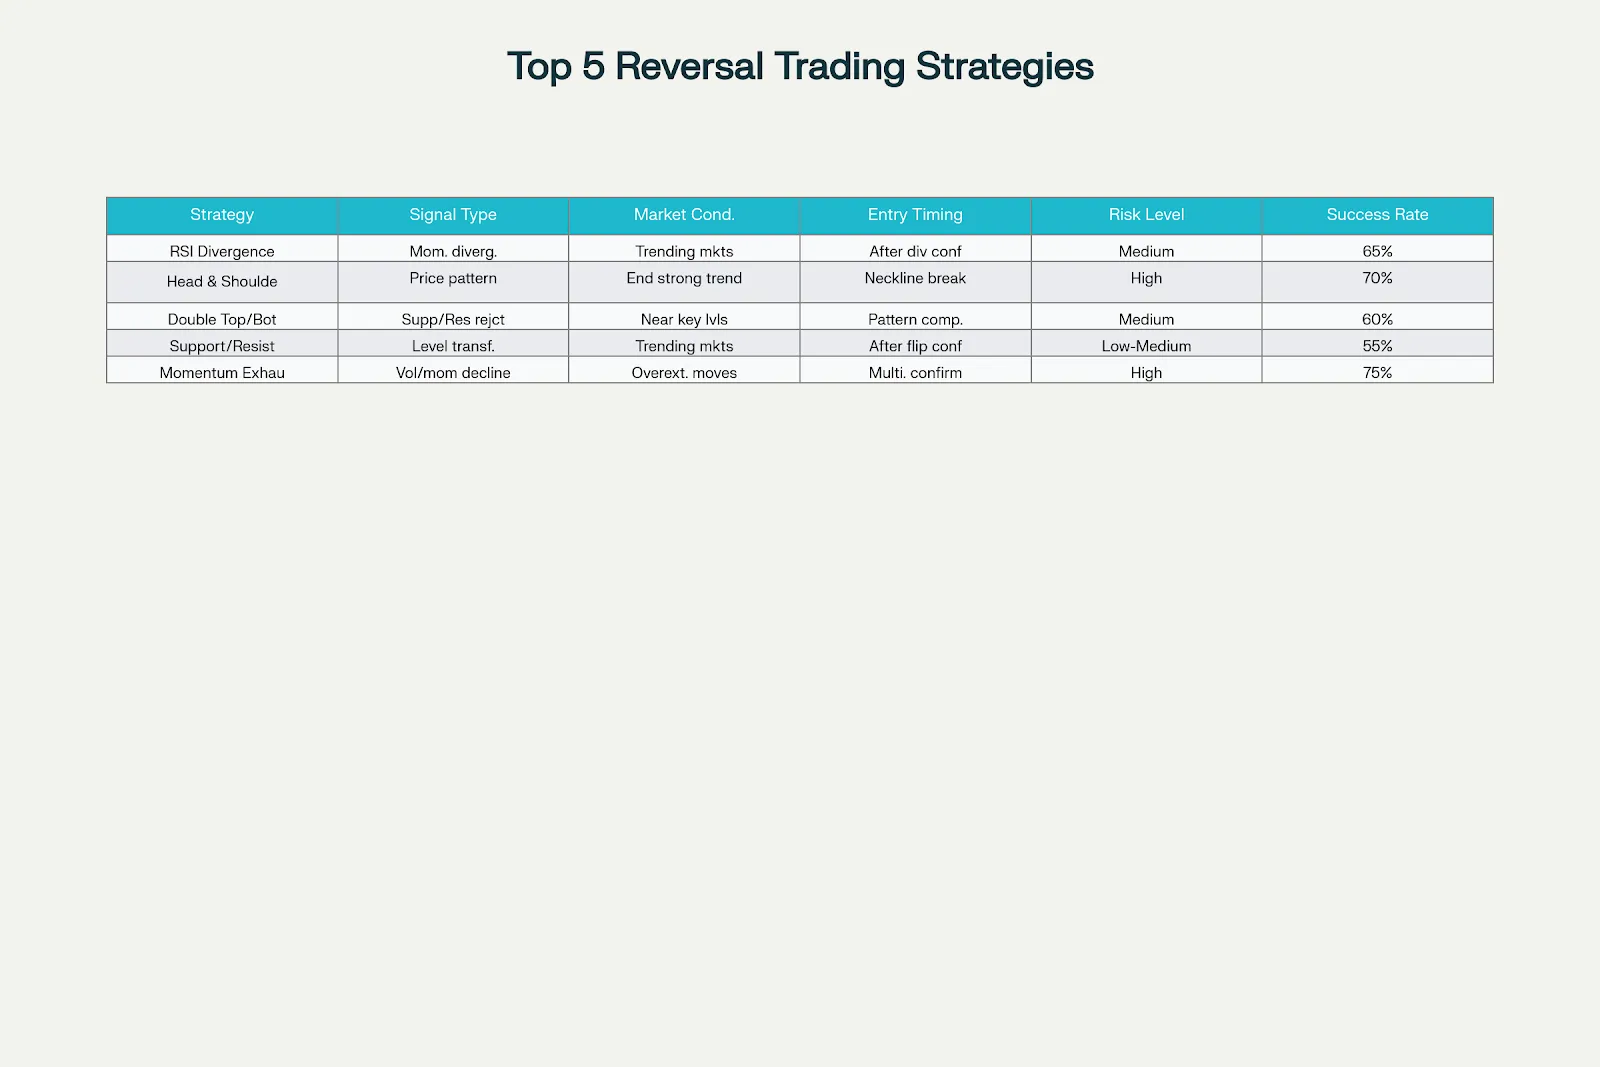
Reversal trading strategies offer Indian traders significant opportunities to capitalize on market turning points, but they require discipline, patience, and comprehensive risk management. The five strategies outlined : RSI divergence, head and shoulders patterns, double tops/bottoms, support/resistance flips, and momentum exhaustion .Each provide unique approaches to identifying potential trend changes.
Success in reversal trading depends on combining multiple confirmation signals rather than relying on single indicators. The best reversal strategy for any trader will depend on their risk tolerance, market knowledge, and ability to remain disciplined during challenging market conditions. Indian traders should practice these strategies extensively using paper trading or small position sizes before committing significant capital.
Remember that reversal trading carries inherent risks as it involves taking positions contrary to prevailing trends. However, for traders who master these techniques, the rewards can be substantial, particularly in the volatile Indian markets where sharp reversals create excellent profit opportunities.
For additional research on technical analysis and trading strategies, consult authoritative sources such as the Securities and Exchange Board of India (SEBI) investor education materials or academic research from institutions like the Indian Institute of Management for evidence-based trading approaches.
Continuous learning, practice, and adaptation to changing market conditions will help traders develop the expertise needed to successfully implement these powerful reversal trading strategies in their Indian market trading activities.
Yes, reversal strategies can be used in intraday trading, but they require quick decision-making and strict risk management. Traders look for signs when a stock or index stops moving in one direction and starts moving in the opposite direction. Since intraday moves are fast and volatile, confirmation of a true reversal is crucial to avoid false signals.
A real reversal usually shows strong volume, clear breakouts of key levels, and candlestick confirmations (like engulfing or hammer patterns). Fake reversals, also called “false breakouts,” often lack volume support and quickly return to the previous trend. Patience and waiting for multiple confirmations help reduce the risk of falling into traps.
Indicators are not mandatory, but they can increase accuracy. Some traders rely solely on price action and candlestick patterns, while others combine them with technical indicators for confirmation. Using a mix of both can give stronger signals and filter out noise.
Common indicators that help identify reversals include:
Relative Strength Index (RSI): Detects overbought or oversold conditions.
MACD (Moving Average Convergence Divergence): Shows momentum shifts.
Moving Averages (50-day/200-day): Crossovers often signal trend changes.
Volume Indicators: Rising volume supports a genuine reversal.
Bollinger Bands: Price moving outside and re-entering bands may indicate a reversal.
Market reversals can be predicted by combining technical, fundamental, and sentiment factors:
Watch for divergence between price and indicators like RSI/MACD.
Track support and resistance levels — breaks often signal shifts.
Study candlestick reversal patterns (Doji, Hammer, Shooting Star).
Follow news or events that could change market direction.
Observe volume surges — strong volume usually confirms a genuine reversal.
Written by Naman Agarwal
Discover investment portfolios that are designed for maximum returns at low risk.
Learn how we choose the right asset mix for your risk profile across all market conditions.
Get weekly market insights and facts right in your inbox

It depicts the actual and verifiable returns generated by the portfolios of SEBI registered entities. Live performance does not include any backtested data or claim and does not guarantee future returns.
By proceeding, you understand that investments are subjected to market risks and agree that returns shown on the platform were not used as an advertisement or promotion to influence your investment decisions.
"I was drawn to Wright Research due to its multi-factor approach. Their Balanced MFT is an excellent product."

By Prashant Sharma
CTO, Zydus
By signing up, you agree to our Terms and Privacy Policy
"I was drawn to Wright Research due to its multi-factor approach. Their Balanced MFT is an excellent product."
By Prashant Sharma
CTO, Zydus
Skip Password
By signing up, you agree to our Terms and Privacy Policy
"I was drawn to Wright Research due to its multi-factor approach. Their Balanced MFT is an excellent product."
By Prashant Sharma
CTO, Zydus
"I was drawn to Wright Research due to its multi-factor approach. Their Balanced MFT is an excellent product."
By Prashant Sharma
CTO, Zydus
Log in with Password →
By logging in, you agree to our Terms and Privacy Policy
"I was drawn to Wright Research due to its multi-factor approach. Their Balanced MFT is an excellent product."
By Prashant Sharma
CTO, Zydus
Log in with OTP →
By logging in, you agree to our Terms and Privacy Policy
"I was drawn to Wright Research due to its multi-factor approach. Their Balanced MFT is an excellent product."
By Prashant Sharma
CTO, Zydus
Answer these questions to get a personalized portfolio or skip to see trending portfolios.
Answer these questions to get a personalized portfolio or skip to see trending portfolios.
(You can choose multiple options)
Answer these questions to get a personalized portfolio or skip to see trending portfolios.
Answer these questions to get a personalized portfolio or skip to see trending portfolios.
Answer these questions to get a personalized portfolio or skip to see trending portfolios.
(You can choose multiple options)
Investor Profile Score
We've tailored Portfolio Management services for your profile.
View Recommended Portfolios Restart


