by Naman Agarwal
Published On Aug. 22, 2025
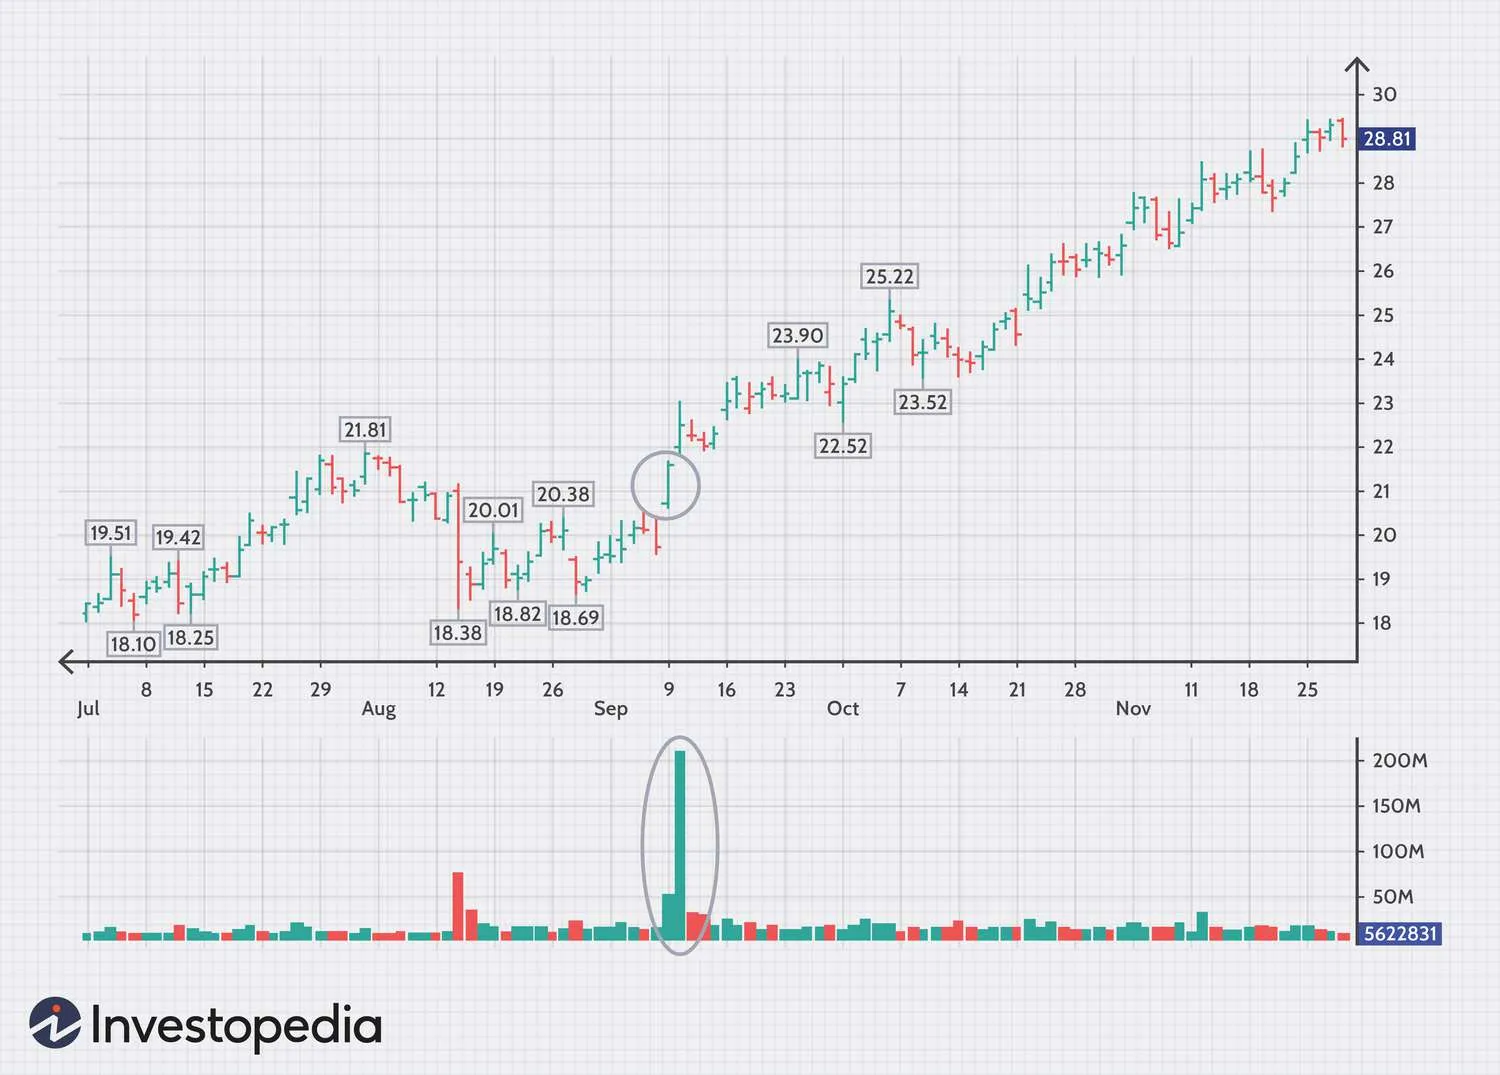
The runaway gap represents one of the most powerful continuation signals in technical analysis, offering Indian traders exceptional opportunities to capitalize on strong market momentum. This price phenomenon occurs when a security's opening price creates a significant void from the previous day's closing price, with no trading activity filling the space between these levels. Unlike common gaps that frequently get filled within days, runaway gaps signal sustained directional movement and often remain unfilled for extended periods, sometimes permanently.
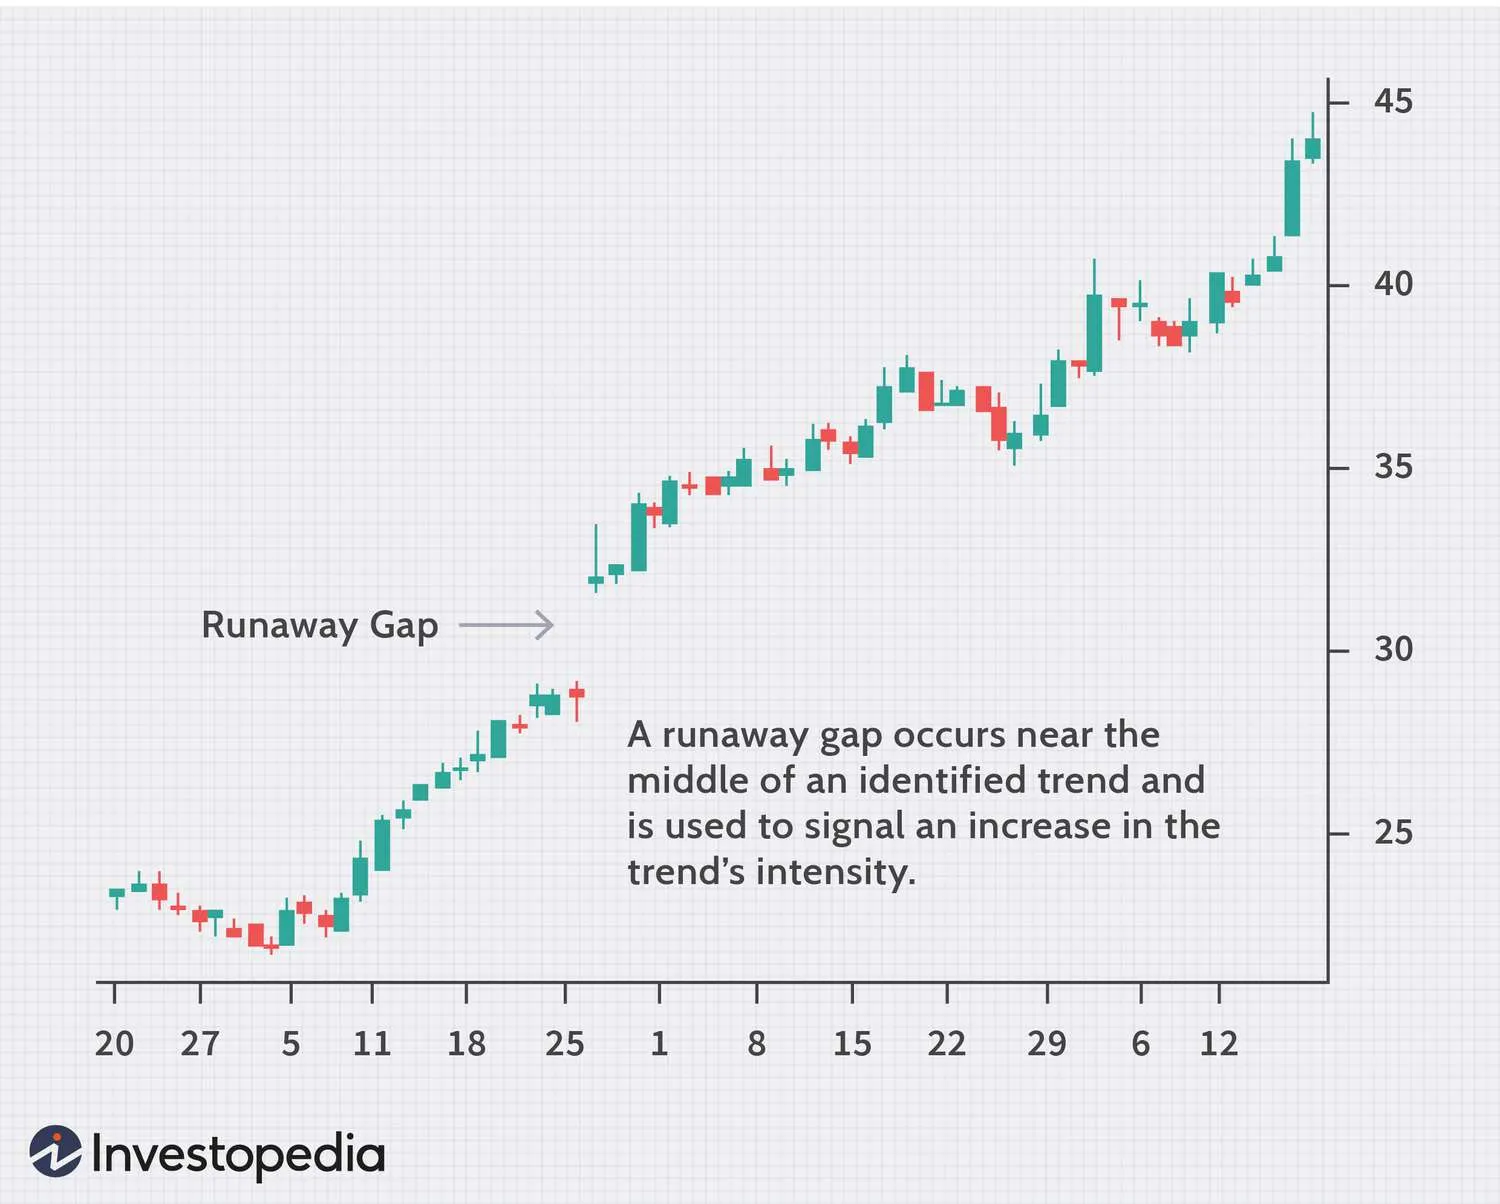
These gaps typically emerge during the middle phase of well-established trends, serving as acceleration points that validate the underlying market sentiment. For Indian traders operating in markets like NSE and BSE, understanding runaway gaps becomes crucial as they frequently coincide with major corporate announcements, earnings surprises, or significant economic events that can trigger substantial price movements in Indian equities. The gap represents institutional conviction and retail investor psychology merging at critical junctures, creating trading opportunities that can yield substantial returns when properly identified and executed. What distinguishes runaway gaps from other gap types is their tendency to occur during periods of strong volume expansion, indicating genuine market participation rather than temporary price dislocations. This makes them particularly valuable for traders seeking high-probability setups that align with dominant market forces, offering clear directional bias and measurable risk parameters that form the foundation of successful trading strategies.
Source : Investopedia
A runaway gap, also referred to as a continuation gap or measuring gap, represents a substantial price jump that occurs when trading activity skips sequential price points during a strong trending market. This gap formation happens when the opening price of a trading session is significantly higher (in bullish trends) or lower (in bearish trends) than the previous session's closing price, creating an empty space on the price chart where no transactions occurred.
The mechanics behind runaway gap formation involve intense investor interest and conviction in the prevailing trend direction. Market participants who missed the initial trend movement often experience fear of missing out (FOMO), leading to urgent buying or selling pressure that causes prices to gap beyond normal trading ranges. This psychological phenomenon typically manifests when traders realize the trend is stronger than initially anticipated, prompting them to abandon wait-and-see approaches in favor of immediate market participation.
Source : Iinvestopedia
Runaway gaps function as powerful momentum accelerators within established trends. When they occur in uptrends, they reflect a surge in buying pressure as participants rush to join what they perceive as a continuing bullish movement. Conversely, in downtrends, runaway gaps indicate increased selling pressure as holders liquidate positions while potential buyers remain on the sidelines. The gap represents a near-panic state among traders who recognize the trend's strength and decide to act decisively rather than wait for more favorable entry points.
Volume characteristics play a crucial role in runaway gap functionality. These gaps typically occur with trading volumes ranging from 150% to 300% above the recent average, confirming genuine institutional and retail participation. Unlike exhaustion gaps that feature climactic volume spikes, runaway gaps show solid, confirming volume that supports continued momentum without suggesting trend completion.
The timing aspect distinguishes runaway gaps from other gap types. They emerge during the middle phase of trend development, after the initial breakout but before trend exhaustion. This positioning makes them valuable continuation signals, suggesting the trend has sufficient energy to extend further rather than reverse or consolidate.
Understanding the distinctions between runaway gaps and other gap classifications is essential for effective trading strategy development. Common gaps, the most frequent type, occur during normal trading conditions with relatively low volume and typically fill within a few days. These gaps lack significant predictive value and often result from routine market fluctuations rather than fundamental or technical catalysts.
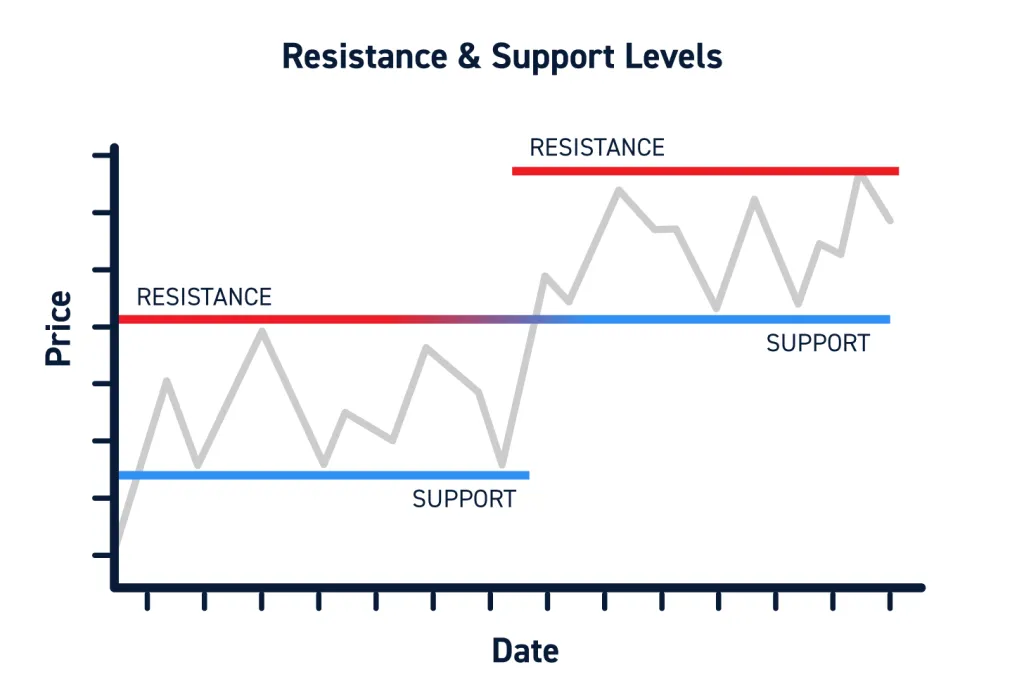
Breakaway gaps mark the beginning of new trends, occurring at the completion of consolidation patterns or when prices break through significant support or resistance levels. They feature high volume confirmation and signal the start of directional movement, making them trend initiation signals rather than continuation candlestick pattern. Breakaway gaps rarely fill immediately and often become important support or resistance levels for future price action.
The volume profile provides clear differentiation between gap types. Runaway gaps exhibit sustained above-average volume that confirms ongoing momentum, typically ranging between 200-300% of normal levels. In contrast, exhaustion gaps display climactic volume spikes that often exceed 400-500% of average trading activity, suggesting final panic buying or selling before trend reversal.
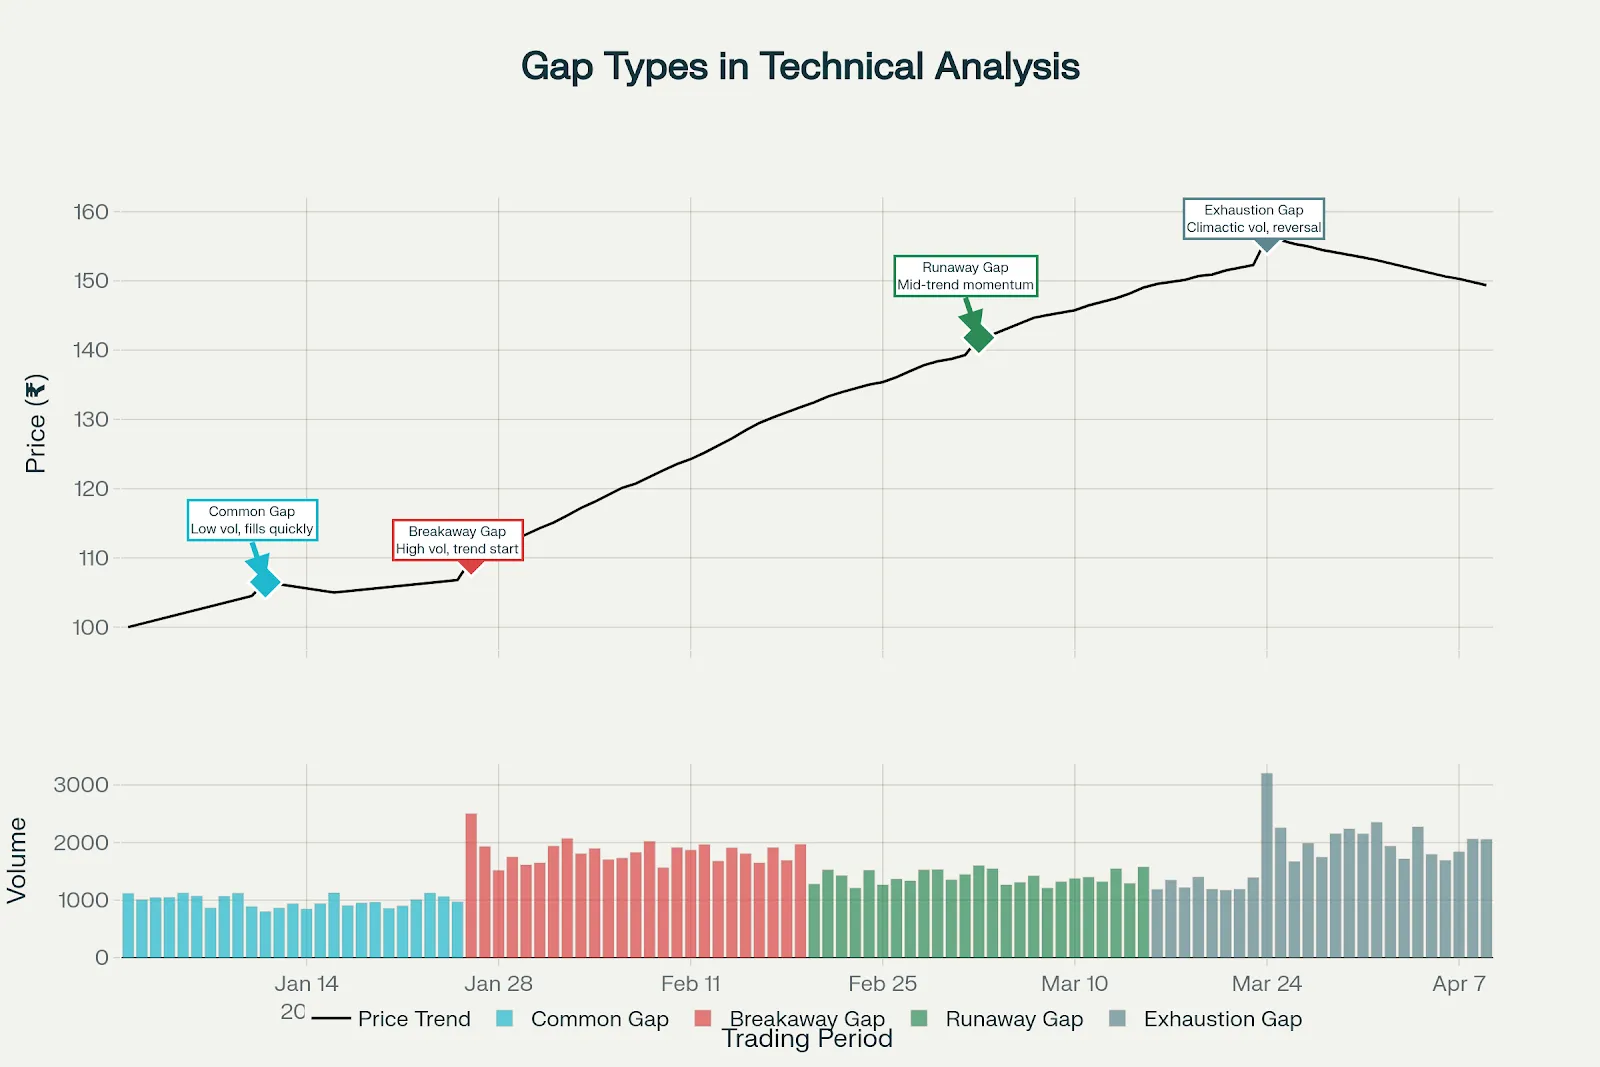
Occurrence timing further distinguishes runaway gaps. While breakaway gaps appear at trend beginnings and exhaustion gaps emerge near trend endings, runaway gaps manifest during the middle phase of established movements. This positioning makes them reliable continuation signals rather than reversal warnings, providing traders with directional confidence for position entries.
Fill probability represents another key differentiator. Common gaps fill approximately 90% of the time, while exhaustion gaps fill roughly 80% within short periods. Runaway gaps, however, remain unfilled in approximately 60-70% of cases, often transforming into permanent support or resistance levels that influence future price behavior.
The psychological context surrounding each gap type varies significantly. Runaway gaps reflect growing confidence and conviction among trend participants, while exhaustion gaps indicate final capitulation or euphoria before sentiment reversal. This psychological foundation influences the reliability and persistence of price movements following gap formation.
Runaway gaps exhibit specific technical characteristics that enable reliable identification and trading application. The primary characteristic involves gap positioning within established trends, occurring after initial breakout phases but before trend completion. This middle-trend positioning provides traders with continuation confirmation and directional bias for subsequent price movements.
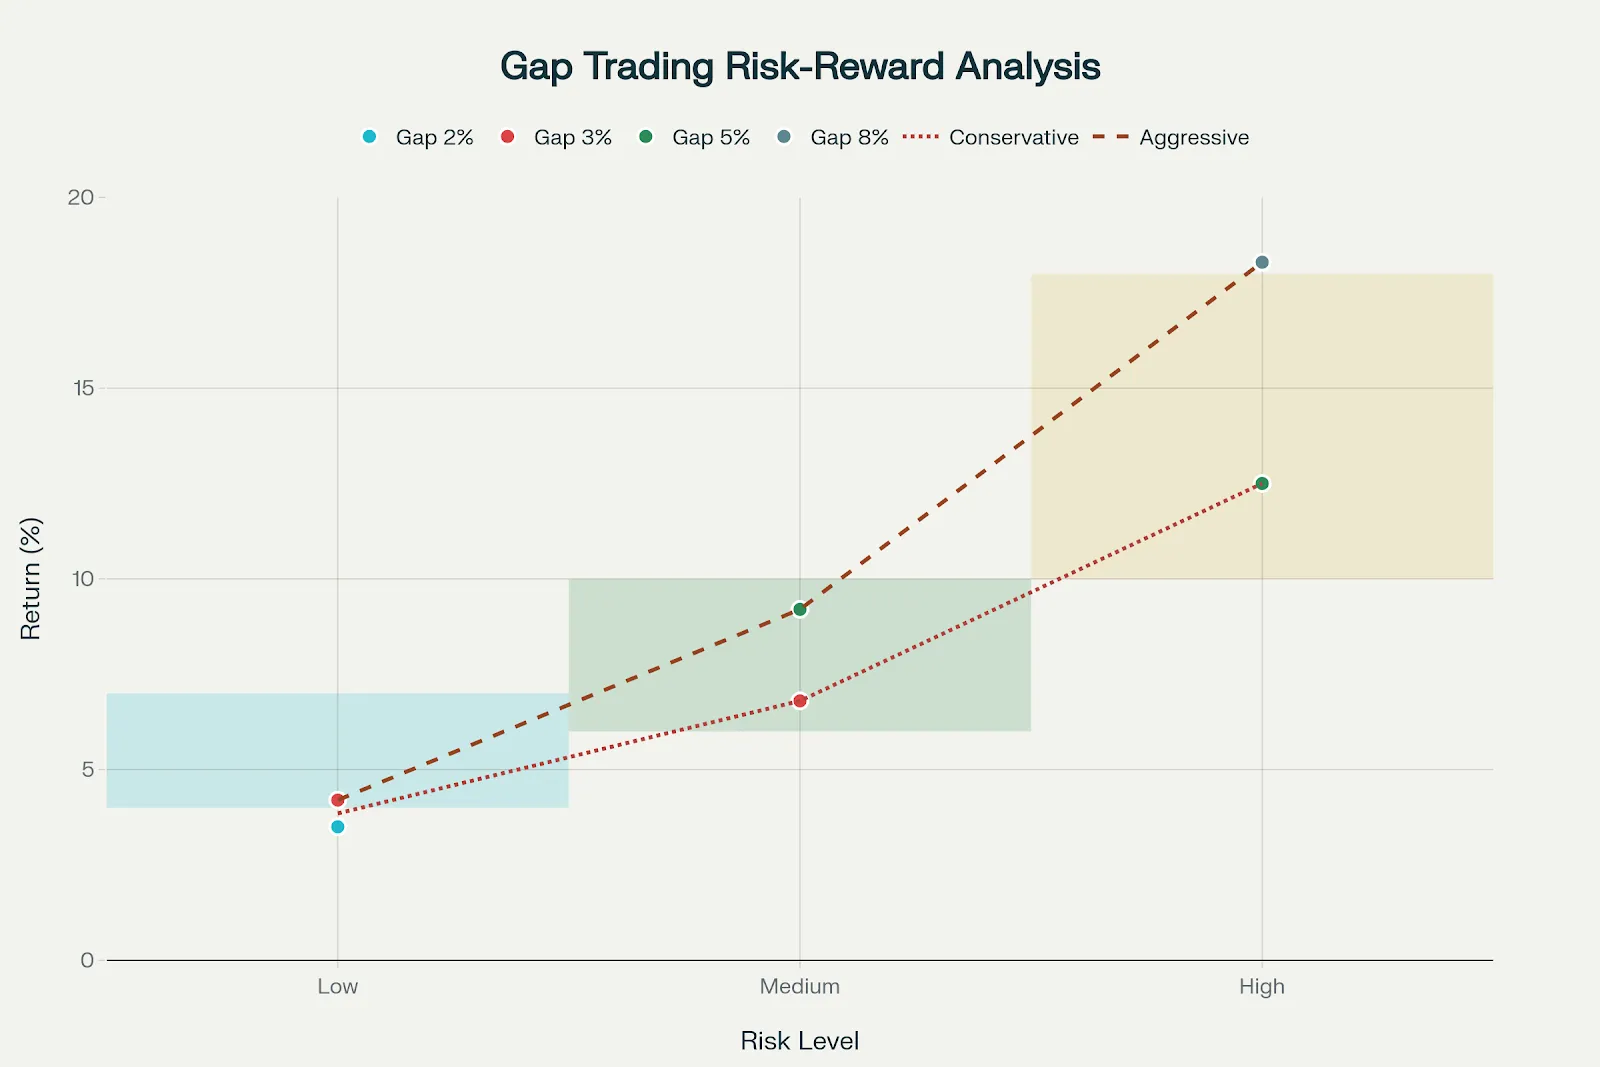
Gap size - Meaningful runaway gaps typically measure between 2-5% of the security's current price, with larger gaps indicating stronger momentum and institutional participation. Gaps smaller than 2% often lack sufficient momentum for sustained follow-through, while gaps exceeding 8-10% may indicate exhaustion rather than continuation patterns.
Volume expansion characteristics distinguish authentic runaway gaps from false signals. Genuine runaway gaps occur with volume levels 150-300% above the 20-day average, indicating broad market participation and institutional conviction. This volume surge should persist throughout the gap day and subsequent sessions, confirming ongoing momentum rather than temporary price dislocation.
Clean gap structure enhances reliability and trading effectiveness. Quality runaway gaps show clear space between the previous session's high/low and the current session's low/high, with no overlapping price ranges. Overlapping candles or partial fills within the first few hours often indicate weaker momentum and reduced continuation probability.
Trend context requirements ensure proper gap classification and trading application. Runaway gaps must occur within well-defined trends that have persisted for at least 2-3 weeks, with clear higher highs and higher lows (uptrend) or lower highs and lower lows (downtrend). Recent consolidation periods or flag patterns preceding the gap often enhance continuation probability.
Market breadth confirmation strengthens runaway gap signals in stock trading. Individual stock gaps occurring during broader market strength (rising indices, positive sector performance) carry higher success probability than isolated gap movements. This correlation suggests institutional rotation and systematic buying/selling rather than stock-specific events.
Time Period | Gap Formation Probability | Success Rate | Average Gap Size | Volume Characteristics | Trading Strategy | Risk Level |
Pre-Market (9:00-9:15 AM) | 15% | 68% | 2.1% | High pre-market activity | Wait for confirmation | Medium |
Opening Hour (9:15-10:15 AM) | 45% | 75% | 3.8% | Surge + Sustained | Aggressive entry optimal | High |
Mid-Morning (10:15-11:30 AM) | 25% | 82% | 2.9% | Above average | Conservative entry | Low-Medium |
Late Morning (11:30-12:30 PM) | 10% | 78% | 2.3% | Normal to high | Volume Confirmation | Medium |
Afternoon (12:30-2:30 PM) | 8% | 65% | 1.8% | Below Average | Avoid Trading | High |
Last Hour (2:30-3:30 PM | 12% | 58% | 2.5% | Mixed Signals | Caution - may be exhaustion | Very High |
Runaway gaps manifest in two primary directional forms, each carrying specific implications for trading strategy and market psychology.
Bullish runaway gaps occur during established uptrends when opening prices gap significantly above the previous session's high, leaving empty space below current trading ranges. These gaps typically follow brief consolidation periods or pullbacks within larger upward movements, representing renewed buying interest and momentum acceleration.
Bearish runaway gaps form during established downtrends when opening prices gap substantially below the previous session's low, creating void spaces above current price levels. These gaps often emerge after temporary rebounds or sideways consolidation within larger declining movements, indicating resumed selling pressure and downward momentum continuation.
Intraday runaway gaps represent a specialized category occurring during single trading sessions, particularly in volatile markets or following significant news releases. These gaps form when prices move decisively away from opening ranges, creating spaces in shorter timeframe charts while maintaining trend direction. Indian traders often encounter intraday gaps during earnings announcements or regulatory changes affecting specific sectors.
Multi-day runaway gaps develop over several trading sessions, with prices consistently opening away from previous closes while maintaining trend direction. These gaps indicate sustained institutional participation and fundamental strength supporting continued directional movement. Multi-day patterns often provide more reliable signals due to extended confirmation periods.
Volume-based classification further categorizes runaway gaps by participation intensity.
High-volume runaway gaps (300%+ above average) typically indicate institutional involvement and carry higher continuation probability.
Moderate-volume runaway gaps (150-250% above average) suggest retail and smaller institutional participation with good but not exceptional continuation odds.
News-driven versus technical runaway gaps represent important subcategories for Indian traders. News-driven gaps result from earnings surprises, regulatory announcements, or economic events, often carrying fundamental support for continued movement. Technical gaps emerge from pure chart pattern breakouts or momentum factors, relying on market psychology and positioning for sustainability.
Visual identification of runaway gaps requires systematic chart analysis focusing on specific structural and contextual elements. Gap structure assessment begins with identifying clear empty spaces between consecutive trading sessions where no price overlap exists. The gap should create a distinct void on the price chart, with the current session's low (in uptrends) remaining above the previous session's high, or the current session's high (in downtrends) staying below the previous session's low.
Trend context verification ensures proper gap classification and trading application. Examine the chart for at least 3-4 weeks preceding the gap to confirm trend establishment through successive higher highs and higher lows (uptrend) or lower highs and lower lows (downtrend). The trend should show clear directional bias without recent reversal signals or major consolidation patterns that might indicate trend weakness.
Volume analysis provides crucial confirmation signals for authentic runaway gaps. Compare the gap day's volume to the 20-day average volume, looking for expansion of at least 150% above normal levels. Use volume indicators such as On-Balance Volume (OBV) or Volume-Weighted Average Price (VWAP) to confirm sustained participation beyond the initial gap formation.
Clean breakout structure enhances gap reliability and reduces false signal probability. Quality runaway gaps maintain their structural integrity without immediate filling attempts or significant retracement toward gap levels. Monitor the first 2-3 sessions following gap formation to ensure prices continue trending away from gap areas rather than attempting to fill the void.
Source:centerpointsecurities
Consolidation pattern recognition often precedes runaway gaps, providing early identification opportunities. Look for flag patterns, pennants, or brief sideways movements within established trends that might precede gap formation. These patterns often represent institutional accumulation or distribution phases before significant price moves.
Multiple timeframe analysis improves gap identification accuracy and trading timing. Examine daily charts for primary gap structure while using hourly charts to assess gap quality and initial follow-through. Weekly charts provide broader trend context and help distinguish runaway gaps from potential exhaustion patterns near major resistance or support levels.
Effective runaway gap trading requires structured approaches to both position entry and exit management, balancing risk control with profit maximization. Understanding the different entry methodologies and their associated risk-reward profiles enables traders to select strategies that align with their risk tolerance and market conditions.
Conservative traders benefit from waiting for initial gap reactions before committing capital. Monitor the first 30-60 minutes after market opening to assess gap sustainability and volume confirmation. Enter positions when prices pull back toward gap edges while maintaining above-average volume, providing better risk-reward ratios through improved entry prices.
Flag pattern entries offer excellent conservative opportunities following runaway gaps. After initial gap formation, prices often consolidate in flag or pennant patterns before continuing trend direction. Enter when prices break above flag resistance (uptrend) or below flag support (downtrend) with volume confirmation, utilizing the flag low as stop-loss reference point.
Volume confirmation entries require waiting for sustained volume expansion beyond the initial gap session. Enter positions when subsequent sessions maintain volume levels above 120-150% of average while prices continue trending away from gap areas. This approach filters false gaps while ensuring institutional participation sustainability.
Aggressive entry strategies target immediate momentum capture following gap formation. Market open entries involve positioning within the first 15-30 minutes after gap confirmation, utilizing market orders or limit orders near gap opening prices. This approach maximizes profit potential while accepting higher execution risk due to opening volatility.
Breakout entries focus on price continuation beyond opening ranges following gap formation. Set buy-stop orders (uptrend) or sell-stop orders (downtrend) slightly beyond the first hour's range, triggering positions when momentum continues. This method combines gap momentum with breakout confirmation for enhanced signal reliability.
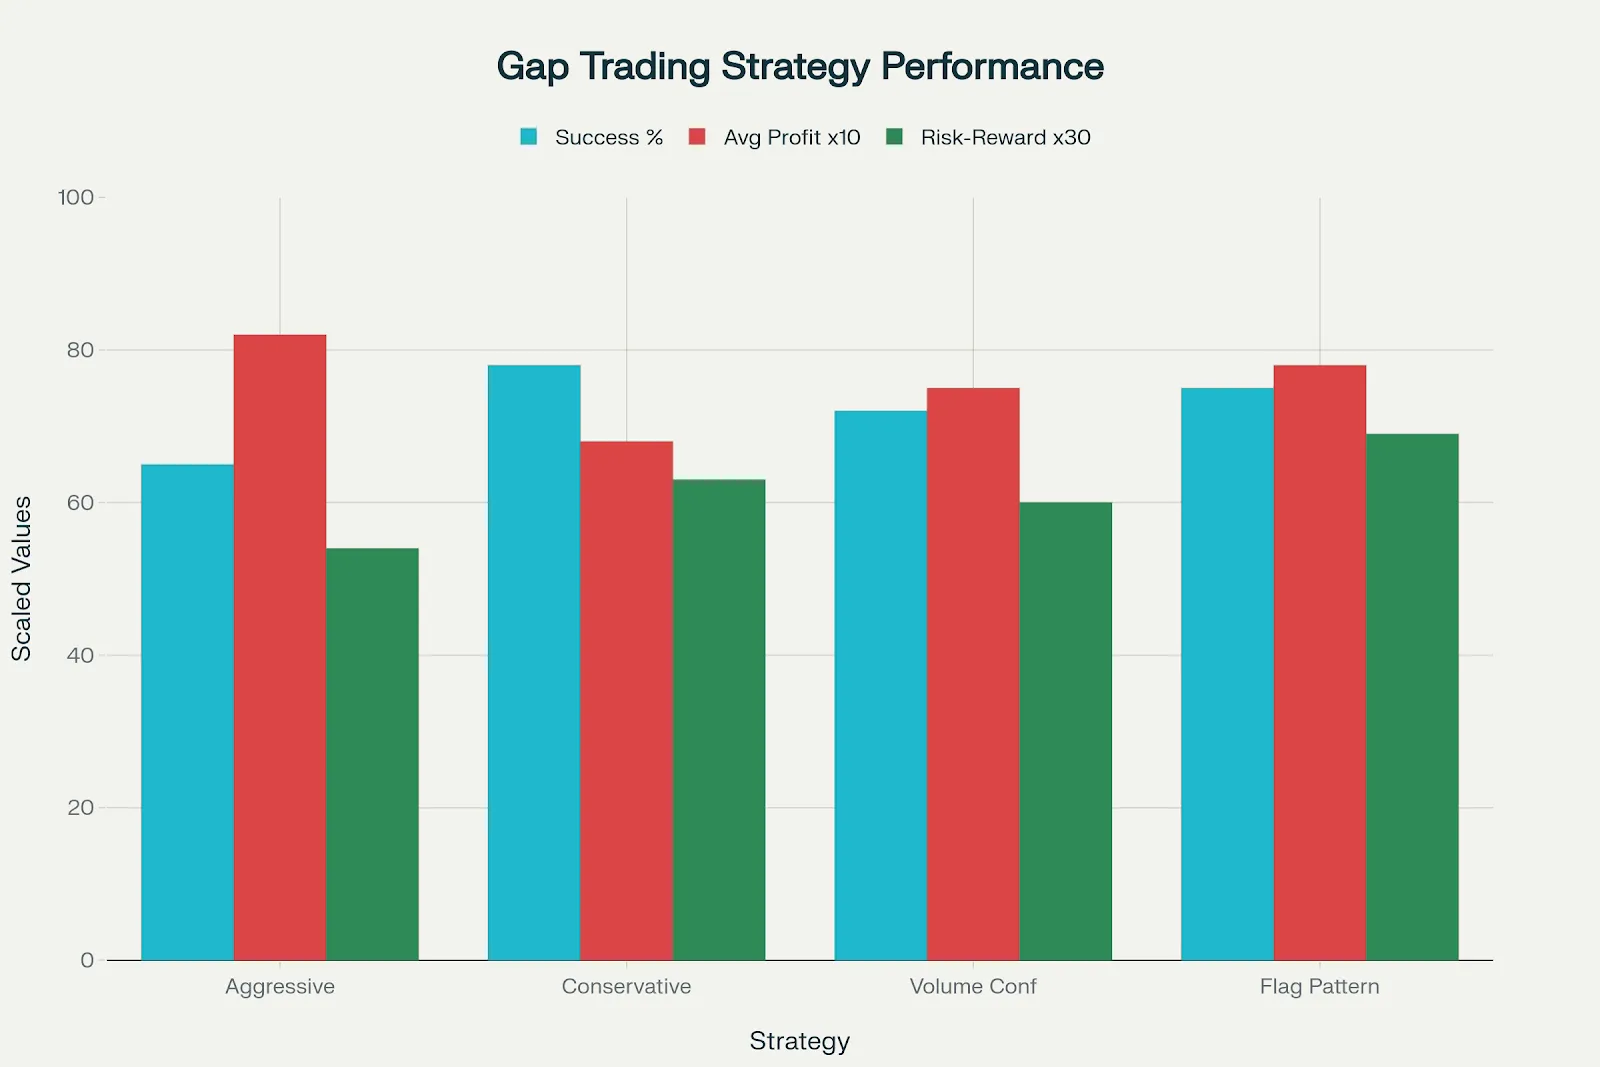
Runaway Gap Trading Strategy Performance Comparison
Gap edge stop-loss placement provides logical risk management reference points. Position stops just below gap lows (uptrend) or above gap highs (downtrend), protecting against gap fill scenarios while allowing normal market fluctuation. This approach typically requires 3-5% risk tolerance depending on gap size and market volatility.
Previous session stop-loss strategies utilize pre-gap technical levels for risk management. Place stops below previous day's lows (uptrend) or above previous day's highs (downtrend), providing additional protection buffer while maintaining logical technical reference points. This method often requires larger position size adjustments due to increased stop distance.
Time-based stops complement price-based risk management by limiting position duration when momentum fails to materialize. Exit positions if gaps fail to show continued follow-through within 2-4 hours of formation, preventing extended exposure to weakening momentum.
Fibonacci extension targets provide objective profit-taking levels based on gap measurement and trend strength. Calculate extensions using gap size as the base measurement, targeting 127.2%, 161.8%, and 261.8% projections from gap completion points. These levels often coincide with natural resistance areas where institutional profit-taking occurs.
Measuring gap theory suggests runaway gaps occur approximately halfway through trend movements, providing estimated target calculations. Double the distance from trend start to gap formation, projecting this measurement beyond the gap to estimate potential trend completion zones.
Multiple target approach optimizes profit capture through staged position reduction. Take 30-40% profits at first Fibonacci target (127.2%), 40-50% at second target (161.8%), and hold remaining positions with trailing stops for extended moves. This approach balances profit realization with trend participation maximization.
Runaway gap trading presents several challenges that can lead to significant losses when not properly managed. Volume misinterpretation represents the most common analytical error among traders attempting to trade gap patterns. Many traders fail to distinguish between genuine volume expansion and temporary volume spikes caused by market opening dynamics or news reactions.
False gap identification occurs when traders mistake common gaps or opening range variations for genuine runaway patterns. This misclassification often results from insufficient trend context analysis or failure to confirm gap structure through proper technical criteria. Traders should ensure gaps meet minimum size requirements (2-3% of current price) and occur within established trends lasting at least 2-3 weeks.
Trend maturity misjudgment leads to trading exhaustion gaps as runaway patterns, particularly near major resistance or support levels. Exhaustion gaps often initially appear similar to runaway gaps but occur near trend completion rather than trend middle phases. This confusion can result in entering positions just before significant trend reversals, causing substantial losses.
Entry timing mistakes frequently occur through premature position taking without proper confirmation or delayed entries that miss optimal risk-reward ratios. Chasing gaps represents a particularly costly error where traders enter positions after substantial gap moves without waiting for consolidation or pullback opportunities. This approach often results in poor entry prices and increased stop-loss distances.
Risk management failures manifest through inadequate stop-loss placement, excessive position sizing, or failure to implement time-based exit strategies. Many traders place stops too close to gap levels, resulting in premature exits due to normal market volatility, while others use stops too distant, creating unacceptable risk-reward ratios.
Market context ignorance involves trading individual gap patterns without considering broader market conditions, sector trends, or economic factors that might influence gap sustainability. Isolated analysis without sector correlation or market breadth confirmation often leads to trading against institutional flows or major market themes.
Overtrading gap patterns results from attempting to trade every gap formation without proper filtering criteria or risk assessment. This approach leads to trading low-quality setups with poor risk-reward profiles, ultimately degrading overall trading performance despite occasional successful trades.
News catalyst misconception occurs when traders assume all news-driven gaps will continue trending, failing to recognize that news reactions often create exhaustion rather than continuation patterns. Understanding the difference between news that supports trend continuation versus news that triggers final capitulation requires experience and market context awareness.
Technical indicator overreliance can create confusion when multiple indicators provide conflicting signals around gap formations. Traders should prioritize price action and volume analysis over secondary indicators when evaluating gap quality and trading potential.
Runaway gaps represent powerful continuation signals that offer Indian traders exceptional opportunities to participate in strong trending movements across NSE and BSE markets. These price formations distinguish themselves through their occurrence during trend middle phases, accompanied by sustained volume expansion and clean gap structure that often remains unfilled for extended periods. Successful runaway gap trading requires comprehensive understanding of gap characteristics, proper trend context analysis, and disciplined risk management that protects capital while maximizing profit potential.
The trading strategies outlined provide both conservative and aggressive approaches suitable for different risk tolerances and market conditions. Conservative traders benefit from waiting for confirmation signals and pullback entries, while aggressive traders can capitalize on immediate momentum through early positioning with proper risk controls. The integration of Fibonacci extension targets with gap measurement theory provides objective profit-taking levels that optimize trade management and portfolio performance.
Risk management remains paramount in gap trading, with proper stop-loss placement, position sizing, and time-based exits forming the foundation of sustainable trading success. Common pitfalls such as volume misinterpretation, trend maturity misjudgment, and entry timing mistakes can be avoided through systematic analysis and disciplined execution of established trading rules.
The comprehensive analysis and comparison data provided serve as practical reference tools for identifying high-probability runaway gap setups while avoiding low-quality signals that can diminish trading performance. Indian traders should focus on volume confirmation, trend context, and market breadth analysis to enhance gap trading accuracy and profitability.
Future market evolution and increasing algorithmic participation may affect gap frequency and behavior, requiring continued adaptation and refinement of trading strategies. However, the fundamental principles of supply-demand imbalance and market psychology that create runaway gaps will likely remain relevant, ensuring these patterns continue providing valuable trading opportunities for prepared and disciplined traders.
Runaway gaps often signal strong momentum in the direction of the prevailing trend. They indicate that many traders are joining the move, adding confidence to trend continuation. For active traders, spotting these gaps early can provide opportunities to ride strong price moves.
Runaway gaps are typically continuation signals. They appear in the middle of a strong trend, showing that demand (in an uptrend) or supply (in a downtrend) is accelerating. Unlike exhaustion gaps, they rarely suggest reversals.
High trading volume on the day of the gap is a strong confirmation. If the volume is significantly higher than average, it indicates widespread participation and increases the reliability of the gap as a continuation signal.
Yes, runaway gaps can appear in intraday charts, especially during earnings announcements, news events, or sudden market-wide moves. Traders often use shorter timeframes to capture momentum, but risk management is critical as intraday gaps can reverse quickly.
Unlike common gaps, runaway gaps are less likely to get filled in the short term. Since they occur in the middle of strong trends, prices may continue in the same direction for a considerable period before any retracement fills the gap.
Written by Naman Agarwal
Discover investment portfolios that are designed for maximum returns at low risk.
Learn how we choose the right asset mix for your risk profile across all market conditions.
Get weekly market insights and facts right in your inbox

It depicts the actual and verifiable returns generated by the portfolios of SEBI registered entities. Live performance does not include any backtested data or claim and does not guarantee future returns.
By proceeding, you understand that investments are subjected to market risks and agree that returns shown on the platform were not used as an advertisement or promotion to influence your investment decisions.
"I was drawn to Wright Research due to its multi-factor approach. Their Balanced MFT is an excellent product."

By Prashant Sharma
CTO, Zydus
By signing up, you agree to our Terms and Privacy Policy
"I was drawn to Wright Research due to its multi-factor approach. Their Balanced MFT is an excellent product."
By Prashant Sharma
CTO, Zydus
Skip Password
By signing up, you agree to our Terms and Privacy Policy
"I was drawn to Wright Research due to its multi-factor approach. Their Balanced MFT is an excellent product."
By Prashant Sharma
CTO, Zydus
"I was drawn to Wright Research due to its multi-factor approach. Their Balanced MFT is an excellent product."
By Prashant Sharma
CTO, Zydus
Log in with Password →
By logging in, you agree to our Terms and Privacy Policy
"I was drawn to Wright Research due to its multi-factor approach. Their Balanced MFT is an excellent product."
By Prashant Sharma
CTO, Zydus
Log in with OTP →
By logging in, you agree to our Terms and Privacy Policy
"I was drawn to Wright Research due to its multi-factor approach. Their Balanced MFT is an excellent product."
By Prashant Sharma
CTO, Zydus
Answer these questions to get a personalized portfolio or skip to see trending portfolios.
Answer these questions to get a personalized portfolio or skip to see trending portfolios.
(You can choose multiple options)
Answer these questions to get a personalized portfolio or skip to see trending portfolios.
Answer these questions to get a personalized portfolio or skip to see trending portfolios.
Answer these questions to get a personalized portfolio or skip to see trending portfolios.
(You can choose multiple options)
Investor Profile Score
We've tailored Portfolio Management services for your profile.
View Recommended Portfolios Restart


