

National Pension System outcomes are often reduced to a single percentage, but there is no one declared NPS interest rate. The final corpus depends on contributions, asset allocation, the pension fund’s performance, charges, time, switching decisions and the sequence of market returns.
This guide explains how to read performance data and estimate a retirement corpus without treating an illustration as a promise.
NPS Returns Explained: What Actually Drives Your Corpus
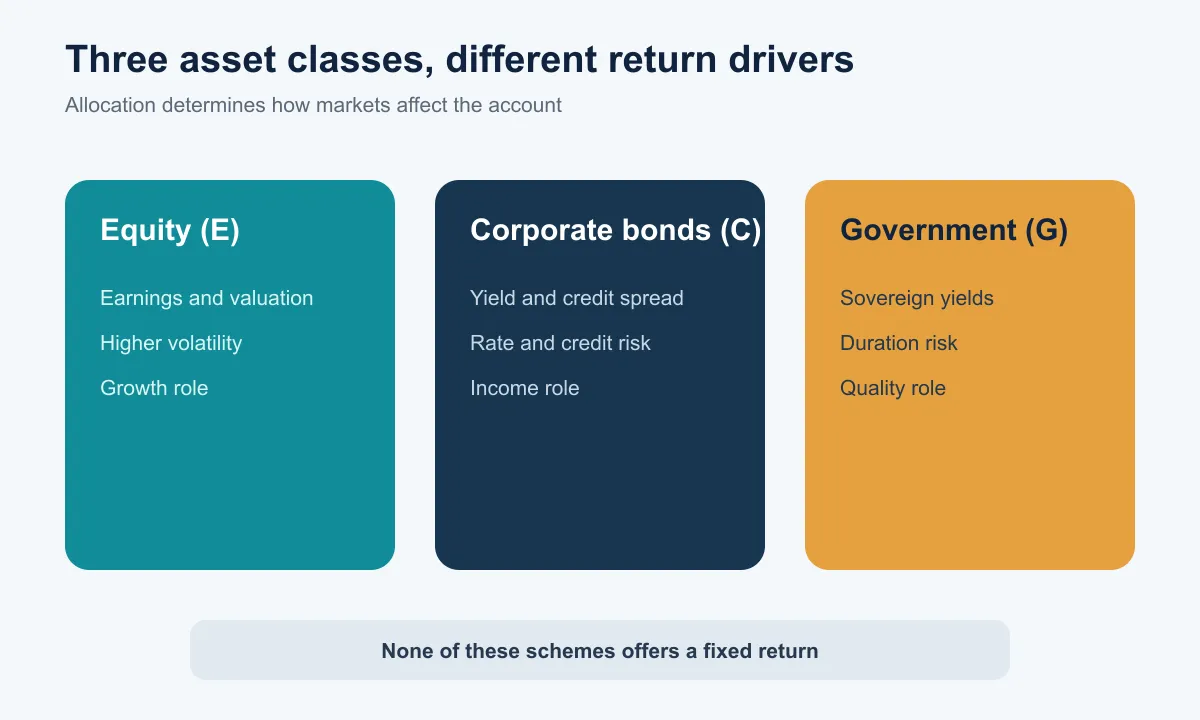
NPS returns are changes in the net asset value of the schemes in which contributions are invested. The major common-scheme asset classes are equity (E), corporate bonds (C) and government securities (G). Their weights determine how market movements flow into the account.
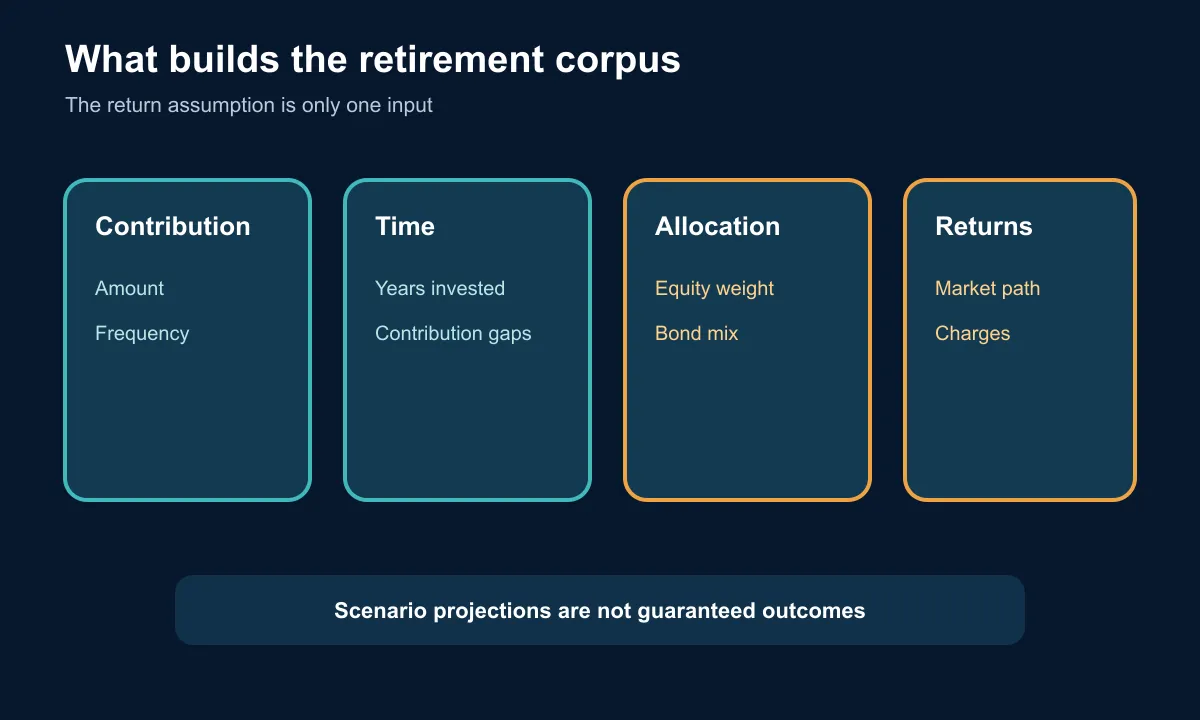
Five variables drive the ending corpus:
- Contribution amount and frequency.
- Years for which money remains invested.
- Asset allocation and how it changes with age.
- Performance of the selected pension fund and schemes.
- Charges, withdrawals and gaps in contribution.
The NPS return rate shown on a factsheet is backward-looking. A one-year return describes one measurement window; it is not the rate that will automatically apply to every contribution for the next year. Because contributions arrive over time, a subscriber’s personal return can differ from a scheme’s point-to-point return.
See what markets are pricing in
Live indices, sector moves and market breadth — the backdrop to every story we publish.
Are NPS Returns Fixed or Market-Linked?
NPS is market-linked. Equity prices, bond yields, credit spreads and portfolio decisions affect NAVs. There is no government-declared annual interest rate comparable to a small-savings product, and capital appreciation is not guaranteed.
Equity can produce strong long-term growth but may fall sharply. Corporate-bond returns reflect interest income, changes in yields and issuer credit. Government securities avoid corporate credit risk but remain sensitive to interest-rate movements; longer-duration bonds can fluctuate when yields change.
That mix means NPS Tier 1 returns can be negative over short periods even though Tier I is designed for retirement. The account structure and withdrawal conditions do not remove market risk.
NPS Returns by Asset Class
Comparing asset classes helps explain why two subscribers of the same age can experience different outcomes.
| Asset class | Main return drivers | Key risks | Typical portfolio role |
|---|---|---|---|
| Equity (E) | Earnings, valuations and market sentiment | Volatility and drawdowns | Long-term growth |
| Corporate bonds (C) | Coupon income, yields and credit spreads | Interest-rate and credit risk | Income and diversification |
| Government securities (G) | Sovereign yields and duration | Interest-rate volatility | High-quality fixed-income exposure |
NPS equity returns are usually more volatile than bond-scheme returns. A higher equity allocation can increase expected long-horizon growth but also widens the range of outcomes. Corporate and government-bond schemes are not fixed deposits: their NAVs can rise or fall as market yields move.
Pension funds manage separate schemes within regulatory investment guidelines. Compare like with like—Scheme E with Scheme E over identical dates—not an equity scheme at one manager with a government-bond scheme at another.
Historical NPS Performance: How to Read It
Official NPS Trust reports show returns by pension fund, scheme and horizon. Returns beyond one year are generally annualised; since-inception figures start from each scheme’s first cash flow. Different inception dates make direct comparisons imperfect.
Read NPS historical returns using four checks:
- Compare identical asset classes and dates.
- Use several horizons, including weak and strong market periods.
- Compare with the stated benchmark, not only competing managers.
- Examine consistency and risk, not merely the highest trailing number.
NPS CAGR expresses the annualised compound rate that links a starting NAV with an ending NAV. It smooths the path and can hide interim drawdowns. For subscribers making repeated contributions, extended internal rate of return (XIRR) is often more relevant because it accounts for the timing of each cash flow.
Past NPS historical returns cannot establish future performance. Recent leaders can change when equity styles rotate, interest rates shift or credit conditions change.
How Compounding Affects NPS Corpus
Compounding means future gains can be earned on earlier contributions and accumulated gains. Time matters because later years operate on a larger base. Regular contributions during weak markets also purchase more units at lower NAVs, although that does not guarantee profit.
At an illustrative 9% annual return, investing ₹10,000 each month for 25 years could grow to roughly ₹1.12 crore if contributions are assumed at month-end and compounding is monthly. Total contributions are ₹30 lakh; the remainder is the mathematical effect of the assumed return.
The result is highly sensitive to inputs:
| Assumption | Approximate corpus after 25 years |
|---|---|
| ₹10,000 monthly at 7% | ₹81 lakh |
| ₹10,000 monthly at 9% | ₹1.12 crore |
| ₹10,000 monthly at 11% | ₹1.57 crore |
These are illustrations before considering actual charges, return sequence, changing allocations and taxes. An NPS calculator is useful for scenario testing, not prediction. Wright Research’s financial calculators can help compare assumptions.
Get research like this in your inbox
The week’s research that mattered, in five minutes. Joined by 2L+ investors.
NPS Return Calculation With an Example
Suppose a Tier I account begins a year with ₹8,00,000. The subscriber contributes ₹1,20,000 through the year and the closing value is ₹10,05,000. Simply dividing the ₹85,000 increase by the opening value is misleading because contributions were invested on different dates.
For a single lump sum, NPS CAGR can be calculated as:
(Ending value ÷ Beginning value)^(1 ÷ years) − 1
For multiple dated contributions, use XIRR with negative cash flows for contributions and the current value as a positive terminal cash flow. The result approximates the subscriber’s annualised money-weighted return.
The scheme’s NPS return rate and the subscriber’s XIRR answer different questions. Scheme return measures fund performance over a defined period; XIRR measures the experience created by actual contribution dates, switches and withdrawals.
Active Choice vs Auto Choice
Under common non-government schemes, Active Choice lets subscribers set allocations within regulatory caps. PFRDA states that equity can be up to 75%, while corporate bonds and government securities can each be up to 100%, subject to total allocation equalling 100%.
Auto Choice applies a predefined life-cycle allocation that reduces equity with age. Available variants differ in starting equity and the speed of reduction. Auto Choice can suit subscribers who do not want to manage allocation; it is not automatically superior.
| Choice | Subscriber controls | Main consideration |
|---|---|---|
| Active | Asset-class percentages | Requires monitoring and disciplined rebalancing |
| Auto | Selects a lifecycle variant | Standard age path may not match total household assets |
Allocation drives NPS equity returns exposure more directly than the label “Active” or “Auto.” PFRDA guidance says investment choice and allocation can generally be changed four times in a financial year, while the pension fund can generally be changed once.
NPS vs EPF vs Mutual Funds: Return Context
NPS, EPF and mutual funds solve different problems. EPF has a declared annual rate under its framework and is tied to eligible employment. NPS is a regulated retirement account with market-linked schemes and exit rules. Mutual funds offer a wide range of market-linked strategies and generally more flexible redemption, subject to scheme terms and taxes.
| Feature | NPS Tier I | EPF | Mutual funds |
|---|---|---|---|
| Return | Market-linked | Declared under EPF framework | Market-linked |
| Asset choice | Prescribed NPS schemes | Managed under EPF rules | Wide scheme universe |
| Liquidity | Retirement-focused restrictions | Statutory withdrawal rules | Generally higher, scheme-dependent |
| Retirement payout | Exit rules may require annuity | Lump-sum framework | Investor decides withdrawals |
Comparing NPS Tier 1 returns directly with an equity mutual fund is incomplete unless allocation and risk are matched. A mixed NPS portfolio should not be expected to mirror a 100% equity fund. Investors can explore mutual fund research for a like-for-like comparison.
What Investors Should Track Beyond Returns
Returns matter, but retirement readiness depends on more than the highest trailing performance. Track:
- Contribution adequacy relative to the retirement goal.
- Equity and duration risk across the entire household portfolio.
- Pension-fund consistency against its benchmark.
- Charges, nominee details and account records.
- Inflation-adjusted corpus rather than only nominal value.
- Exit rules, lump-sum choices and annuity requirements.
- The annuity option, provider quote, survivor benefit and inflation protection.
Annuity selection affects income after exit, not the pre-exit NPS Tier 1 returns. A higher accumulated corpus can still produce unsuitable retirement cash flow if the chosen annuity structure conflicts with household needs.
The Wright Research advisory service can help place NPS alongside EPF, mutual funds, insurance, liabilities and retirement spending rather than reviewing the account in isolation.
Is your portfolio built for what’s coming?
Get a free AI-powered review of your holdings — risk, overlap and quality in minutes.
FAQ
Can NPS subscribers change their pension fund manager?
Yes. Under current PFRDA guidance for the All Citizen and Corporate models, a subscriber can generally change the pension fund once in a financial year. Verify current CRA procedures and any sector-specific conditions before submitting the request.
How does annuity selection affect retirement income from NPS?
The annuity rate, single-life or joint-life structure, return-of-purchase-price option and survivor benefit determine periodic income. Greater guarantees or benefits can reduce the starting pension. Compare quotes and insurer terms at exit.
Can an NPS subscriber pause contributions without closing the account?
A subscriber can stop making regular contributions without immediately submitting an exit request, but minimum-contribution or account-status rules may apply to the specific model. Restarting contributions does not recover the compounding time lost during the pause.
How often can NPS subscribers change their investment allocation?
PFRDA currently permits subscribers under the All Citizen and Corporate models to change investment choice or asset allocation up to four times in a financial year, separately for Tier I and Tier II where applicable.
The most useful way to read NPS returns is as one input into a retirement plan. Contribution rate, time, allocation, inflation and eventual annuity choices determine whether the corpus can support the required income.