The Nifty PE ratio is the price-to-earnings multiple of India's benchmark index, used to gauge market valuations. Historical cycles since 2000 show that buying when PE is below 16–18 has consistently delivered superior forward returns. Investors using active portfolio management , factor investing, value investing, and a disciplined mutual funds portfolio approach can use the Nifty PE as a directional signal to manage portfolio risk management effectively across large-cap stocks, mid-cap stocks, and small-cap stocks.
What Is the Nifty PE Ratio and How Is It Calculated?
You check your portfolio on a Monday morning, and the market is at an all-time high. Everything looks green. But somewhere in the back of your mind, a question nags at you: Is this a good time to buy more, or am I walking into an expensive market? That one question asked by millions of investors every week is exactly what the Nifty PE ratio was built to answer.
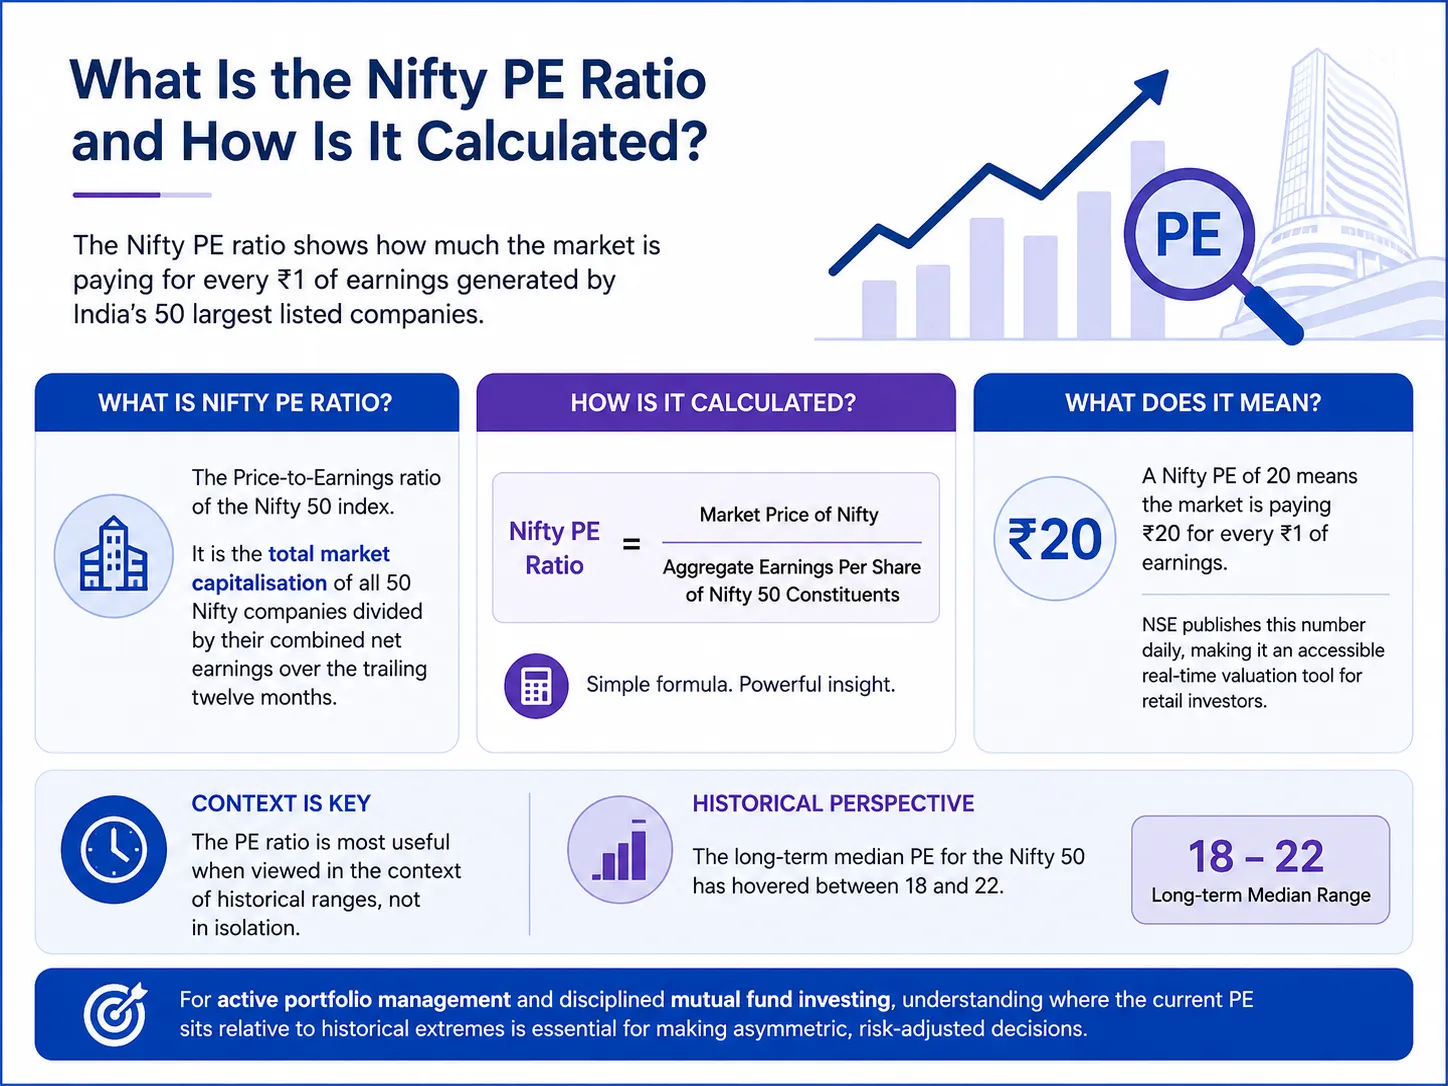
The Nifty PE ratio (Price-to-Earnings ratio of the Nifty 50 index) is the aggregate market capitalisation of all 50 Nifty constituent companies divided by their combined net earnings over the trailing twelve months. In plain English, it tells you how much the market is paying for every rupee of earnings generated by India's 50 largest listed companies.
The formula is straightforward: Nifty PE = Market Price of Nifty / Aggregate Earnings Per Share of Nifty 50 constituents.
NSE publishes this number daily, making it one of the most accessible real-time valuation tools available to retail investors. A Nifty PE of 20, for example, means the market is paying ₹20 for every ₹1 of earnings, and historically, the long-term median for the Nifty 50 has hovered between 18 and 22.
Where the PE ratio becomes genuinely useful is not in isolation, but in the context of historical ranges. For any investor practising active portfolio management or building a disciplined mutual funds portfolio , understanding where the current PE sits relative to historical extremes is foundational to making asymmetric, risk-adjusted decisions.
Historical Nifty PE Ratio: What the Data Shows Across Market Cycles Since 2000
Looking back at over two decades of data, the Nifty PE ratio has oscillated through several dramatic cycles, each one offering a clear lesson for investors willing to read the evidence.
During the dot-com bubble of 1999–2000, the Nifty PE touched extreme levels above 28, driven by irrational exuberance in technology stocks. When the bubble burst, the market corrected sharply, and the PE ratio collapsed to single digits, reaching as low as 10–12 by 2003. Those who entered during this trough, practising disciplined value investing, saw extraordinary compounding over the following years.
The 2003–2007 bull run saw the Nifty PE expand from below 12 to nearly 28 again, riding a wave of GDP growth, FII inflows, and strong corporate earnings. Then came 2008, the Global Financial Crisis, and the PE crashed to around 10–11 once more. Again, those who had a framework for portfolio risk management and did not panic sell found themselves in an exceptional position to benefit from the recovery that followed.
Market Phase |
Approximate Nifty PE Range |
Market Sentiment |
Subsequent Market Direction |
2000 Dot-comPeak |
26–28+ |
Extreme Greed |
Sharp 40–50% correction |
2003 Post-crash Trough |
10–12 |
Extreme Fear |
Multi-year bull market |
2007 Pre-crisis Peak |
26–28 |
Euphoria |
60%+ drawdown in 2008 |
2009 GFC 10–12 Panic 100%+ rally over 3 year
2015–2016 21–23 Moderate Consolidation, modest returns
2020 COVID 18–20 (earning impacted) Fear Explosive 90%+ 1-year rally
2021 Bull Peak 40+ (depressed earnings) Frenzy Correction and consolidation
2023–2025 20–24 Optimism Selective, stock- specific returns
This table is not a crystal ball, but it is a map. Every seasoned practitioner of factor investing will tell you that valuations are not a timing tool, but they are a powerful guide to expected returns over 3–5 year horizons.
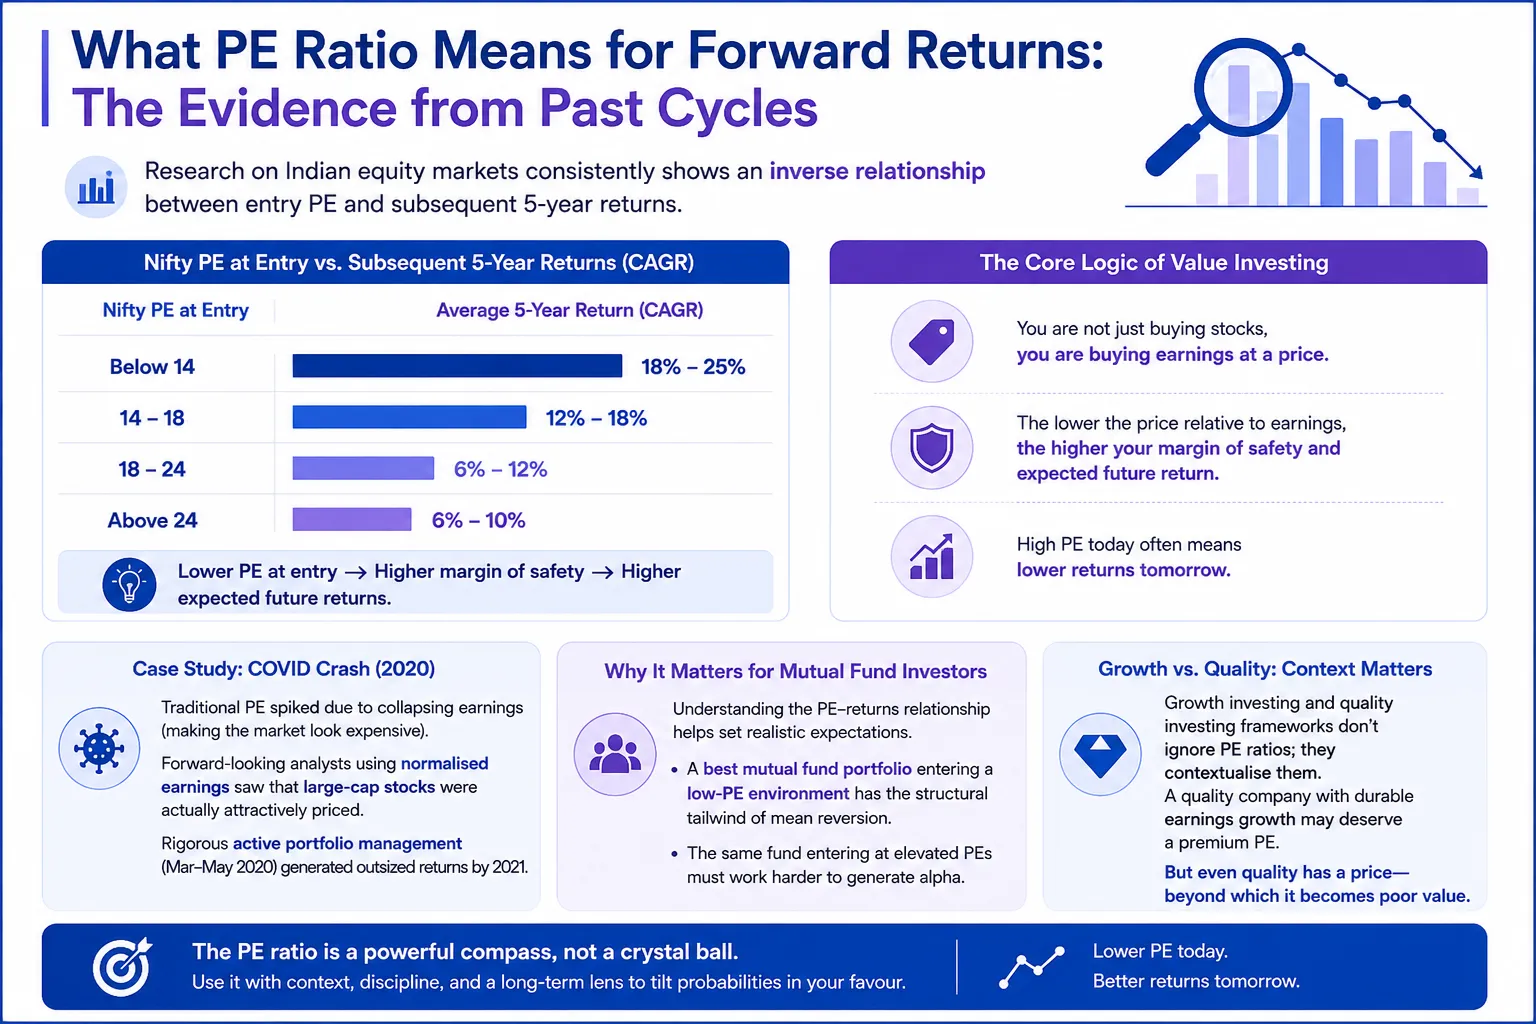
What PE Ratio Means for Forward Returns: The Evidence from Past Cycles
Here is where the data becomes truly compelling and where most retail investors miss the insight entirely.
Research on Indian equity markets consistently shows an inverse relationship between entry PE and subsequent 5-year returns. When investors entered the Nifty at PE levels below 14, the average 5-year CAGR was in the range of 18–25%. When they entered above 24, forward 5-year returns dropped to 6–10%, barely ahead of fixed deposits in some periods.
This is the core logic behind value investing: you are not just buying stocks, you are buying earnings at a price. The lower the price relative to earnings, the higher your margin of safety and your expected future return.
The 2020 COVID example is particularly instructive. While traditional PE metrics spiked due to collapsed earnings (making the market look expensive on the surface), a forward-looking analyst using normalised earnings saw that large-cap stocks were actually attractively priced. Those who applied rigorous active portfolio management during March–May 2020 generated outsized returns by 2021.
For those building a best mutual fund portfolio , understanding this relationship helps set realistic expectations. A high-return mutual fund entering a low-PE environment has the structural tailwind of mean reversion working in its favour. The same fund entering at elevated PEs must work considerably harder to generate alpha.
Growth investing and quality investing frameworks don't ignore PE ratios; they contextualise them. A quality company with durable earnings growth may deserve a premium PE. But even quality has a price at which it becomes poor value.
PE Ratio vs. PB Ratio vs. Earnings Yield: Which Valuation Metric Matters Most?
The Nifty PE ratio is powerful, but no single metric tells the whole story. Serious practitioners of factor investing and portfolio risk management triangulate across multiple valuation measures.
Price-to-Book (PB) Ratio measures how much the market values the Nifty relative to the book value (net assets) of its constituent companies. While PE can be distorted by one-time earnings events, PB is more stable. Historically, when Nifty PB has been below 2.5, returns over the next 3 years have been well above average.
Earnings Yield is simply the inverse of the PE ratio (1/PE × 100). A Nifty PE of 20 gives an earnings yield of 5%. When this earnings yield is compared to the 10-year government bond yield (currently ~7%), you can assess the "equity risk premium" how much extra return equities are offering over the risk-free rate.
Metric |
What It Measures |
Limitation |
Best Used For |
PE Ratio |
Earnings multiple |
Distorted by one-time items |
Broad market cycle positioning |
PB Ratio |
Asset value multiple |
Less relevant for service/tech firms |
Banking and capital-heavy sectors |
Earnings Yield vs Bond Yield |
Equity premium |
Changes in interest rates |
Cross-asset allocation decisions |
Forward PE |
Expected earnings |
Relies on analyst forecasts |
Short-to-medium term view |
For investors managing a mutual funds portfolio across large-cap stocks, mid-cap stocks, and small-cap stocks, each segment has its own PE behaviour. Mid and small caps tend to trade at more volatile PE ranges, making active portfolio management in those spaces both riskier and potentially more rewarding.
How to Use the Nifty PE Ratio in Your Investment Strategy
The Nifty PE ratio is not a buy-sell signal. It is a probabilistic guide for one input in a larger investment framework.
Here is how sophisticated investors apply it: Think of the PE ratio as a weather forecast. A low PE doesn't guarantee sunshine; a high PE doesn't guarantee a storm. But it does shift the odds meaningfully.
Step one is to know the historical range. For the Nifty 50, the broad parameters since 2000 suggest: below 16 is historically cheap, 16–22 is fair value, and above 24 begins to signal caution. Above 28, the historical evidence for mean reversion is very strong.
Step two is to adjust your asset allocation accordingly. When PE is elevated, a practice of systematic portfolio risk management suggests tilting toward quality, reducing small-cap stock exposure (which typically carries the most valuation risk), and increasing fixed income in the mix. When PE is low, tilting toward mid-cap stocks and small-cap stocks can amplify returns significantly.
Step three is to lean on factor investing principles to identify which segments of the market offer value even within an expensive broad market. In a high-PE environment, quality investing factors return on equity, low debt, and earnings consistency tend to outperform because they offer earnings visibility even when the broader market corrects.
Wright Research's quant-driven approach to active portfolio management incorporates valuation signals, including PE-based market cycle positioning, to dynamically adjust portfolio weights. Rather than relying on gut feel or broker tips, the strategy uses rules-based signals to navigate market cycles which is why it has historically shown strong risk-adjusted performance across different PE regimes.
If you are building your best mutual fund portfolio, use the Nifty PE as a macro overlay. When PE is below 18, increase your SIP amounts. When above 24, continue SIPs (don't stop, you'd be trying to time the market) but be careful about deploying large lump sums.
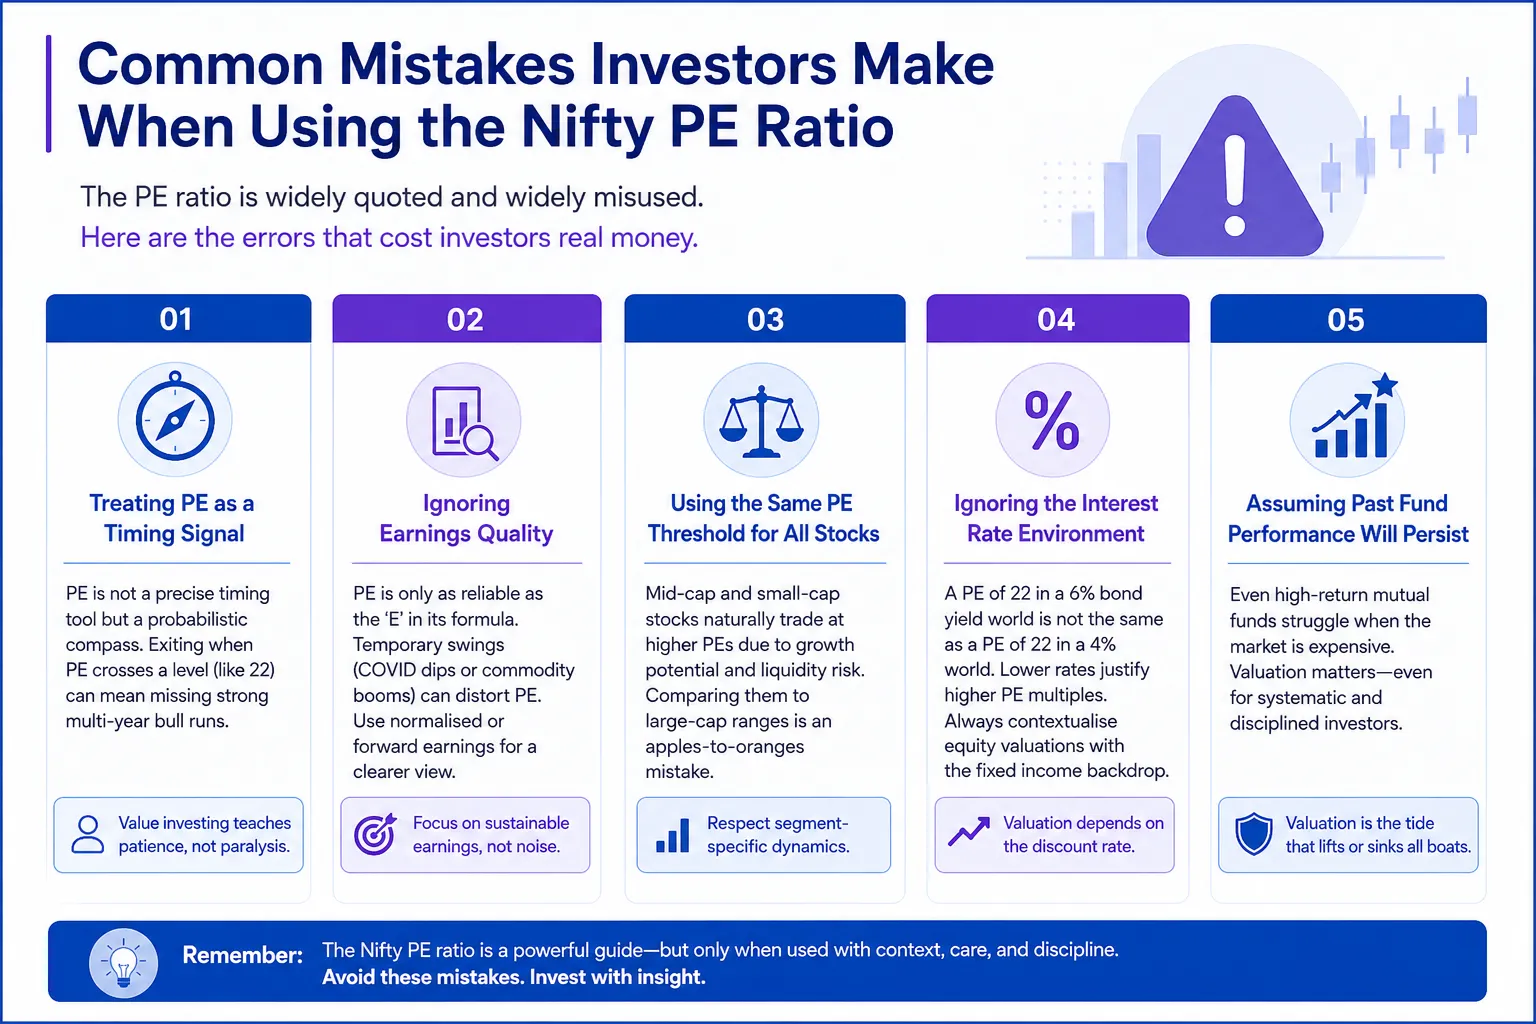
Common Mistakes Investors Make When Using the Nifty PE Ratio
The PE ratio is widely quoted and widely misused. Here are the errors that cost investors real money.
The first and most common mistake is treating PE as a precise timing signal rather than a probabilistic compass. Investors who stopped their SIPs in 2014 because PE crossed 22 missed one of the biggest multi-year bull runs. Value investing teaches patience, not paralysis.
The second mistake is ignoring earnings quality. The PE ratio is only as reliable as the "E" in its formula. If corporate earnings are temporarily depressed (like during COVID) or inflated (like during a commodity super-cycle), the PE can be misleading. Normalised or forward earnings give a more balanced picture.
The third mistake is applying the same PE threshold to mid-cap stocks and small-cap stocks as to large-cap stocks. Smaller companies historically trade at premium multiples to compensate for higher growth expectations and liquidity risk. Comparing a mid-cap PE to large-cap historical ranges is an apples-to-oranges exercise.
The fourth mistake is ignoring the interest rate environment. A Nifty PE of 22 in a 6% bond yield environment is very different from a PE of 22 in a 4% bond yield world. Lower rates justify higher PE multiples because the discount rate applied to future earnings is lower. Good portfolio risk management always contextualises equity valuations relative to the fixed income environment.
Finally, investors in high-return mutual funds often assume that a fund's past performance will persist regardless of market PE. But even the best mutual fund portfolio faces headwinds when the market enters expensive territory. Valuation matters even for systematic investors.
Current Nifty PE Ratio: Where Are We in the Valuation Cycle Today?
As of early 2026, the Nifty 50 PE ratio (on a trailing twelve-month basis) has been trading in the range of 20–24, reflecting a market that is in the "fair-to-moderately-expensive" zone relative to historical averages. This is not a zone of extreme fear or extreme greed, it is a zone that rewards disciplined stock selection and factor investing far more than passive index-riding.
Notably, the earnings growth cycle for Nifty 50 constituents has been moderating after the post-COVID surge. This means that continued market gains will increasingly need to be supported by genuine earnings expansion rather than PE multiple expansion.
For practitioners of quality investing and growth investing, this environment rewards companies with durable earnings growth, strong return ratios, and low leverage exactly the stocks that tend to perform during mid-cycle consolidation phases.
For investors in a mutual funds portfolio, this is not the time for reckless aggression or fearful exits. It is time for the process. Continue your SIPs, review your asset allocation annually, and ensure your best mutual fund portfolio is diversified across large-cap stocks for stability, mid-cap stocks for growth potential, and small-cap stocks for long-term compounding sized appropriately for your risk profile.
To explore how Wright Research structures its portfolios for different market cycles, or to understand how our quant models incorporate valuation signals into active portfolio management, speak with our team directly.
PE Ratio and Your Investment Strategy: Putting It All Together
Nifty PE Zone |
Historical Signal |
Recommended Stance for Mutual Funds Portfolio |
Below 14 |
Extreme undervaluation |
Aggressive allocation, lump sum opportunity |
14–18 |
Undervalued to fair |
Strong SIP continuation, selective lump sum |
18–22 |
Fair value |
Steady SIPs, balanced allocation |
22–26 |
Moderately expensive |
SIPs only, reduce lump sum, increase quality tilt |
Above 26 |
Historically expensive |
SIPs maintained, defensive tilt, fixed income rebalancing |
This table is a guide, not a guarantee. Markets have remained expensive far longer than logic suggested, and they have crashed faster than anyone anticipated. The PE ratio sharpens your odds; it doesn't eliminate uncertainty.
Conclusion
The Nifty PE ratio is one of the most powerful and most misread tools available to an Indian investor. Used correctly, it doesn't tell you what the market will do tomorrow. What it does tell you, with remarkable historical consistency, is the ballpark of returns you can reasonably expect over the next three to five years based on the price you're paying for earnings today.
Whether you follow value investing, growth investing, or quality investing principles, the PE ratio belongs in your toolkit. It sharpens your portfolio risk management, informs how you build your mutual funds portfolio , and guides you on sizing your positions across large-cap stocks, mid-cap stocks, and small-cap stocks. The investors who have built real, lasting wealth in Indian equities were never the ones who predicted every market move. They were the ones with process, patience, and the discipline to let valuations work in their favour. That is the edge active portfolio management done well has always delivered.
Frequently Asked Questions
What is a good PE ratio for the Nifty 50?
Historically, a Nifty PE below 16–18 has been considered undervalued and associated with strong forward returns. A PE between 18–22 reflects fair value. Above 24, the market is pricing in optimistic earnings expectations, and caution is warranted. There's no single "good" number context (earnings cycle, interest rates, growth outlook) that always matters.
Should I stop SIP when Nifty PE is above 25?
No. Stopping SIPs based on PE alone is a form of market timing, which consistently destroys long-term wealth. A high PE does signal caution, but SIPs are designed to average your cost across cycles. Instead of stopping, review your asset allocation and avoid deploying large lump sums at elevated valuations. Continue the SIP discipline.
Where can I find the current Nifty PE ratio?
The NSE India website publishes the Nifty PE ratio daily under the market data section. Several financial portals, such as Moneycontrol and Screener.in, and Value Research also track it in real time. For historical data and charts, NSE's official website provides downloadable datasets going back to the early 2000s.
What does a high Nifty PE ratio mean for stock market returns?
A high Nifty PE (above 24–26) historically signals below-average forward returns over a 3–5 year horizon. It doesn't mean the market will crash immediately; markets can stay expensive longer than expected. But the probability of earning index-beating returns reduces, and portfolio risk management becomes more critical in this environment.
How often does the Nifty PE ratio update?
The Nifty PE ratio updates every trading day after market close. NSE recalculates it based on the closing price of the Nifty 50 and the latest available earnings data of constituent companies. Earnings data is typically updated quarterly post results season, which can cause step-changes in the PE ratio around April, July, October, and January.
About the author

Our Investment Philosophy
Learn how we choose the right asset mix for your risk profile across all market conditions.
Subscribe to our Newsletter
Get weekly market insights and facts right in your inbox