The nifty PE ratio in 2026 sits near 20.2, below its long-term average, suggesting the nifty 50 valuation is fair rather than stretched. This guide explains nifty 50 PE levels, what they mean for value investing and value stocks India, and how quality investing and factor investing help you spot undervalued stocks India.
What Is the Nifty PE Ratio?
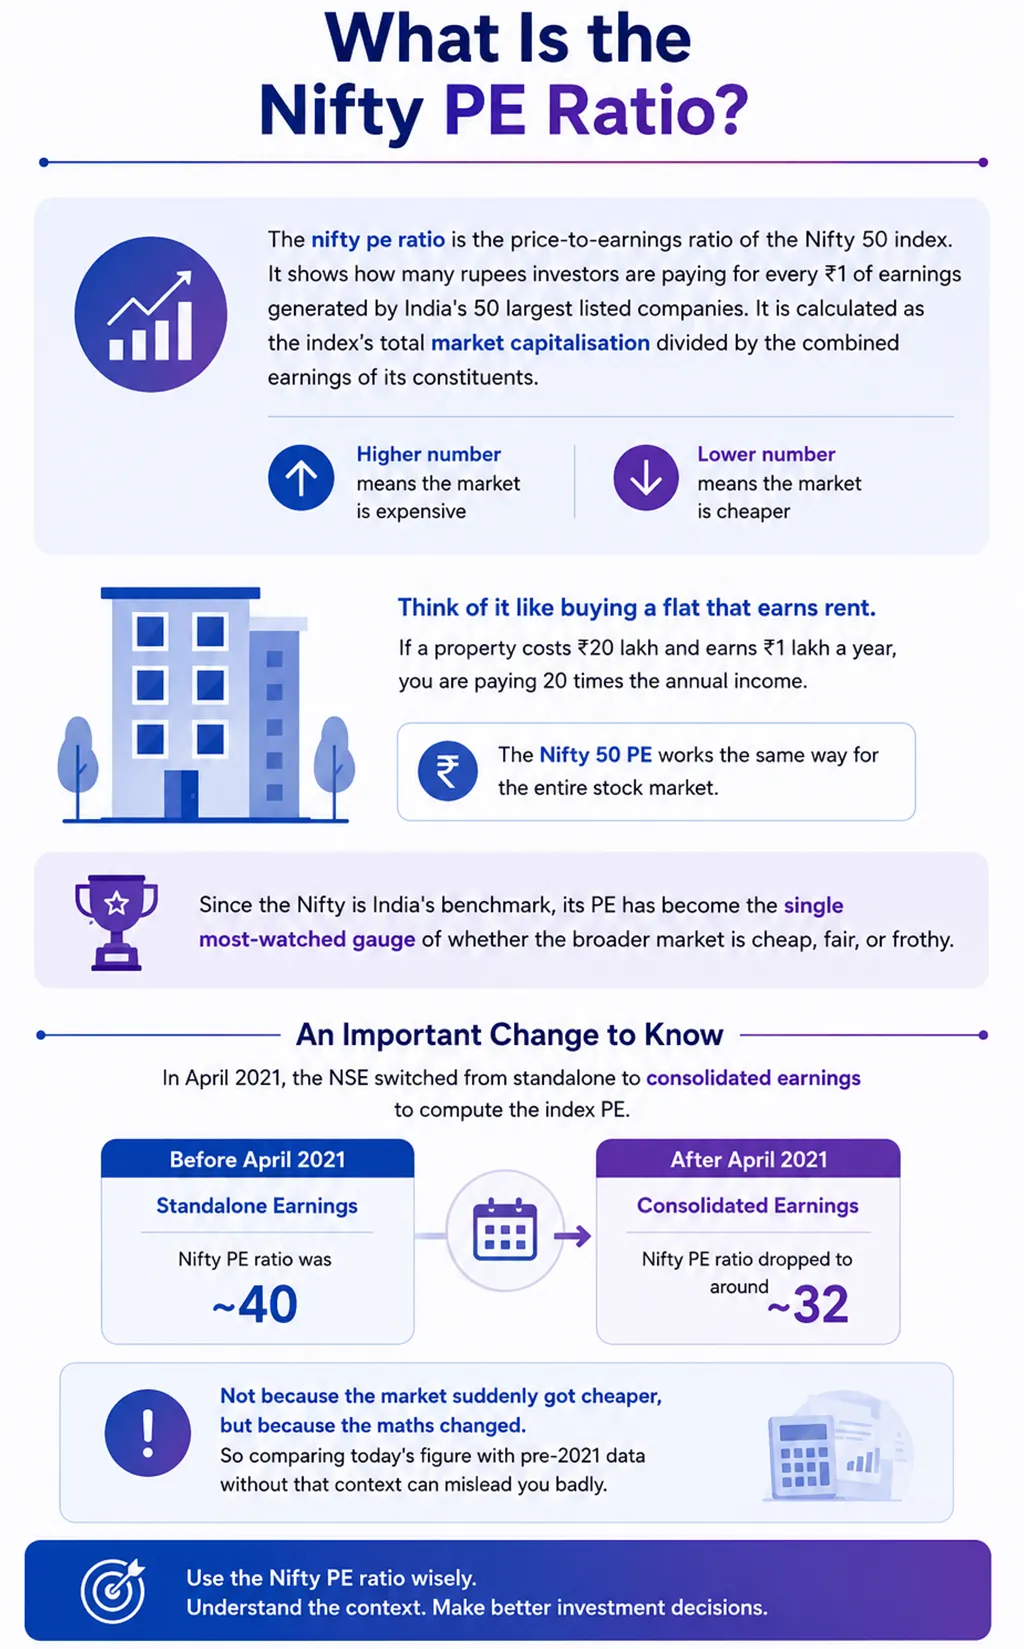
The nifty pe ratio is the price-to-earnings ratio of the Nifty 50 index. It shows how many rupees investors are paying for every ₹1 of earnings generated by India's 50 largest listed companies. It is calculated as the index's total market capitalisation divided by the combined earnings of its constituents. A higher number means the market is expensive; a lower number means it is cheaper.
Think of it like buying a flat that earns rent. If a property costs ₹20 lakh and earns ₹1 lakh a year, you are paying 20 times Pets' annual income. The nifty 50 PE works the same way for the entire stock market. Since the Nifty is India's benchmark, its PE has become the single most-watched gauge of whether the broader market is cheap, fair, or frothy.
One important detail many investors miss: in April 2021, the NSE switched from standalone to consolidated earnings to compute the index PE. Overnight, the published nifty PE ratio dropped from roughly 40 to around 32, not because the market suddenly got cheaper, but because the maths changed. So comparing today's figure with pre-2021 data without that context can mislead you badly.
Nifty 50 PE in 2026: Where Do We Actually Stand?
As of early June 2026, the Nifty PE ratio sits at roughly 20.2 on a trailing twelve-month basis. That single figure is worth sitting with, because it pushes back against the "everything is overpriced" narrative. The long-term average Nifty 50 PE is closer to 22.5, which means the index is currently trading below its own historical norm, even with the index near all-time highs in absolute terms.
Here is a snapshot of the current Nifty 50 valuation against its own history:
Metric | Value (June 2026) | Long-Term Reference |
Nifty PE ratio (TTM) | ~20.2 | Average ~22.5 |
Nifty Price-to-Book | ~3.1 | Range 2.2 to 4.9 |
Dividend yield | ~1.23% | Neutral zone (1.0% to 1.5%) |
Lowest PE on record | 17.15 (Mar 2020) | n/a |
Highest PE on record | 42.00 (Feb 2021) | n/a |
The picture that emerges is nuanced. The nifty 50 PE is not in bargain-basement territory, but it is also nowhere near the euphoria of early 2021. The dividend yield of around 1.23% sits in a neutral-to-cautious band, neither flashing a strong buy nor a clear sell. In plain terms, the Nifty 50 valuation in 2026 looks fair to mildly attractive rather than dangerously stretched.
Is the Nifty 50 Market Overvalued? Reading the Nifty 50 Valuation
So, is the market overvalued? Based purely on the nifty pe ratio, the honest answer is: not by historical standards. A common rule of thumb among Indian investors is that a PE below 15 is cheap, 15 to 20 is fair value, and above 22 is expensive. At roughly 20.2, the Nifty 50 valuation lands in the upper end of "fair", a zone where you neither pile in blindly nor run for the exit.
But here's the catch that the nifty PE ratio alone won't tell you. An index PE is an average. It hides the fact that some sectors are wildly expensive while pockets of the market remain genuinely cheap. Defensive large-caps and select financials may trade at sensible multiples, while certain high-growth themes carry rich valuations baked on optimistic earnings. This is precisely why blanket statements like "the whole market is overpriced" are usually wrong, and why disciplined value investing still has plenty of room to work even when the headline number looks full.
The other reason to stay calm: India enjoys a structural valuation premium because of its growth, young population, and rising corporate earnings. A nifty 50 PE of 20 in India is not directly comparable to a PE of 20 in a slow-growth market. Investors are paying more per rupee of earnings precisely because those earnings are expected to compound faster. The risk, of course, is that if earnings growth disappoints, that premium can compress quickly, which is exactly when value stocks India tend to hold up better than expensive momentum names.
What History Says About High Nifty PE Ratio Levels
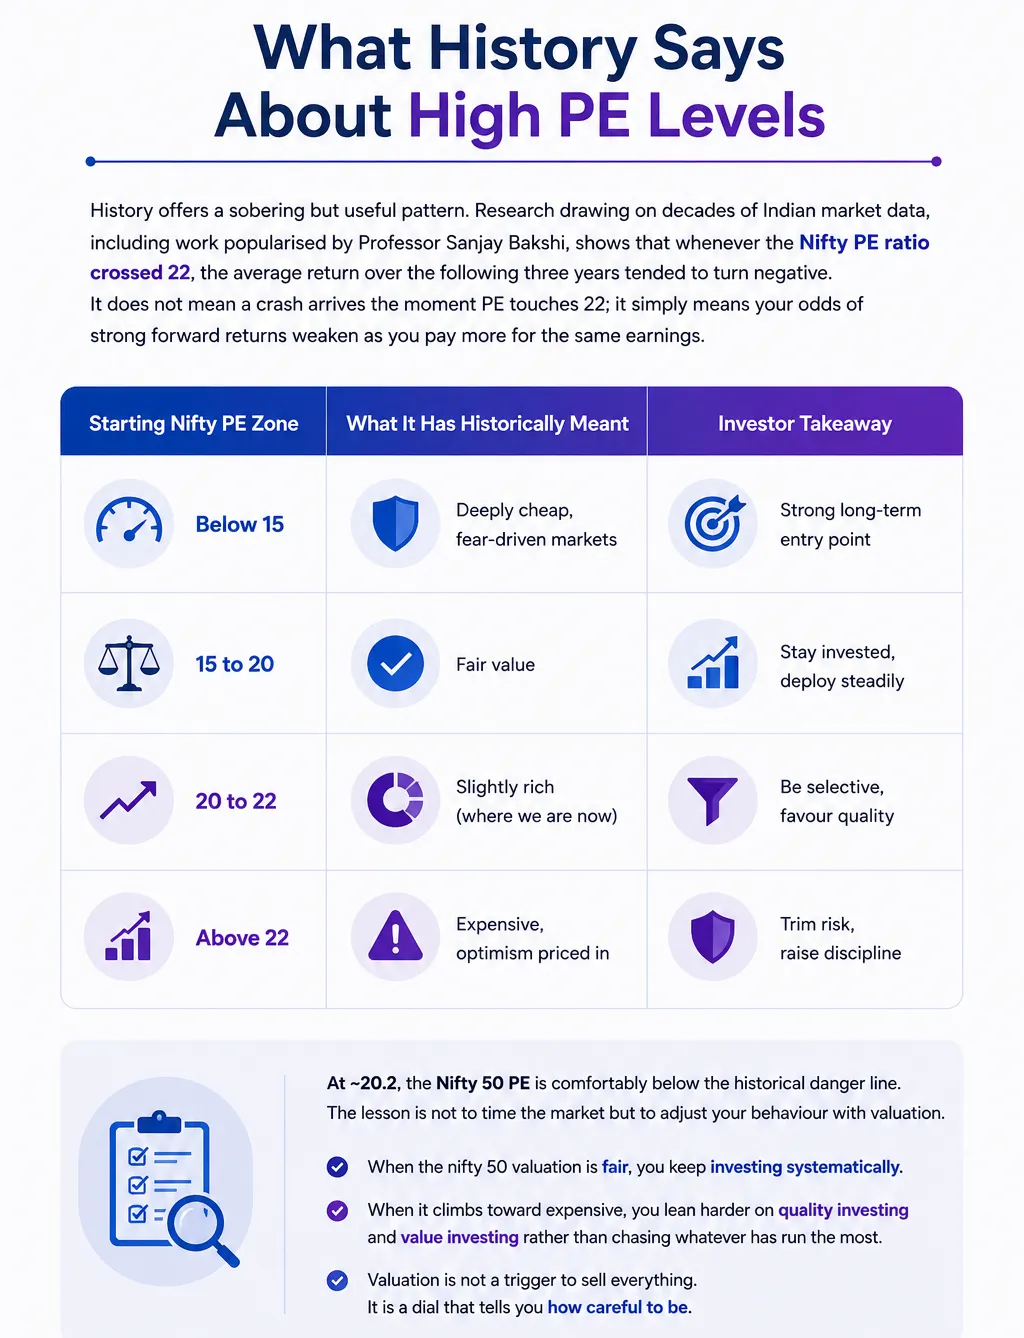
History offers a sobering but useful pattern. Research drawing on decades of Indian market data, including work popularised by Professor Sanjay Bakshi, shows that whenever the Nifty PE ratio crossed 22, the average return over the following three years tended to turn negative. It does not mean a crash arrives the moment PE touches 22; it simply means your odds of strong forward returns weaken as you pay more for the same earnings.
Starting Nifty PE Zone | What It Has Historically Meant | Investor Takeaway |
Below 15 | Deeply cheap, fear-driven markets | Strong long-term entry point |
15 to 20 | Fair value | Stay invested, deploy steadily |
20 to 22 | Slightly rich (where we are now) | Be selective, favour quality |
Above 22 | Expensive, optimism priced in | Trim risk, raise discipline |
At ~20.2, the Nifty 50 PE is comfortably below the historical danger line. The lesson is not to time the market but to adjust your behaviour with valuation. When the nifty 50 valuation is fair, you keep investing systematically. When it climbs toward expensive, you lean harder on quality investing and value investing rather than chasing whatever has run the most. Valuation is not a trigger to sell everything. It is a dial that tells you how careful to be.
Value Investing When the Market Looks Expensive
This is where value investing earns its keep. The core idea is simple: buy businesses for less than they are intrinsically worth, and let time close the gap. When the broader Nifty PE ratio is elevated, the temptation is to abandon discipline and buy the hottest stocks. Value investing does the opposite: it hunts for solid companies the crowd has overlooked, where the price has fallen out of step with the underlying earnings power.
In a market trading near fair value, value investing does not mean sitting in cash and waiting for a crash that may never come. It means tilting your portfolio toward reasonably priced, fundamentally sound businesses instead of overpaying for narrative-driven names. The beauty of this approach is that it works in almost any market: when the Nifty 50 valuation is rich, value offers a cushion; when it is cheap, value offers a launchpad.
For Indian investors specifically, value investing has a long, credible track record. Periods of high nifty pe ratio have repeatedly been followed by phases where unloved, cheaper value stocks India outperformed the expensive winners of the previous cycle. The discipline is unglamorous, but it is one of the most reliable ways to protect capital when valuations are not in your favour.
Quality Investing and Factor Investing: A Smarter Lens
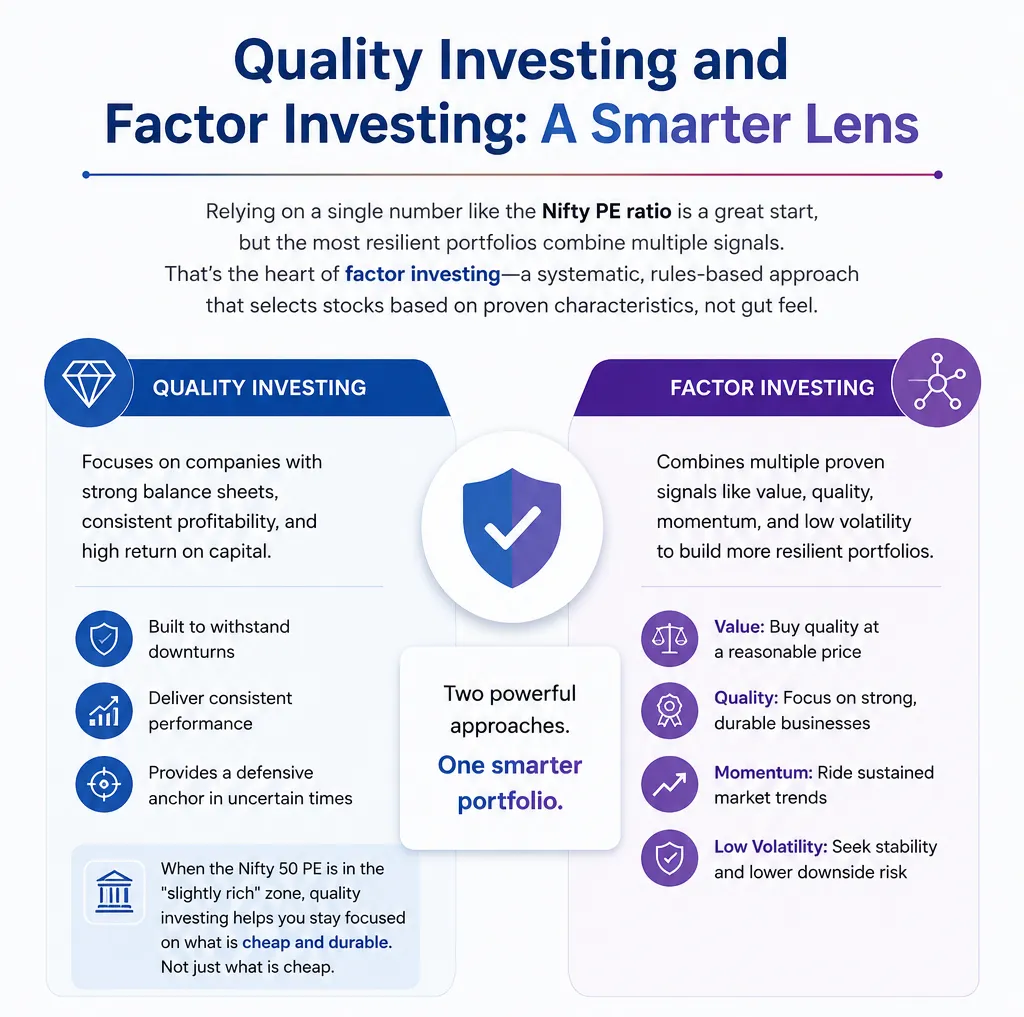
Relying on a single number like the nifty PE ratio is a great start, but the most resilient portfolios combine multiple signals. This is the heart of factor investing: a systematic, rules-based approach that selects stocks based on proven characteristics like value, momentum, quality and low volatility, rather than gut feel or tips.
Quality investing, one of the most important factors, focuses on companies with strong balance sheets, consistent profitability, and high return on capital, the kind of businesses that survive downturns instead of getting wiped out by them. When the nifty 50 PE is in the "slightly rich" zone, quality investing acts as a defensive anchor. You are not just buying what is cheap; you are buying what is cheap and durable.
Wright Research builds portfolios using exactly this philosophy. Our factor investing approach blends value, quality, and momentum signals to remove human bias from stock selection. Instead of one analyst guessing, our quant models process hundreds of data points across the market to decide what to hold and when to rebalance. The advantage is consistency: factor investing doesn't panic when the Nifty PE ratio wobbles, and quality investing keeps the portfolio leaning toward companies that can weather a valuation reset. For investors who want this discipline professionally managed, our PMS strategies are designed around these very factors.
How to Find Undervalued Stocks in India When the Market Is Fairly Valued
Spotting undervalued stocks India is less about luck and more about a repeatable checklist. A stock may look cheap on the nifty PE ratio logic, but a low PE alone can be a trap: sometimes the price is low because the business is genuinely deteriorating. Real value combines a reasonable valuation with healthy fundamentals.
What to Check | Why It Matters | The Trap to Avoid |
PE below sector peers | Signals relative cheapness | "Cheap" but shrinking earnings |
Return on equity | Confirms business quality | High debt inflating returns |
Earnings consistency | Validates the value thesis | One-off profits flattering PE |
Cash flow strength | Real, not accounting, profit | Profit on paper, no cash |
Debt levels | Survival in downturns | Hidden leverage risk |
Hunting for undervalued stocks India at the right time matters too. When the overall Nifty 50 valuation is fair, as it is in 2026, the search for genuine value stocks India becomes more rewarding, with less "everything is expensive" noise to wade through. The most disciplined investors don't try to find the single perfect stock; they build a basket of reasonably valued, high-quality businesses so that no single mistake sinks the portfolio. You can explore curated baskets built on these principles through Wright Research Smallcase portfolios.
The hardest part of finding value stocks in India is not analysis. It is patience. Value can stay unloved for quarters before the market catches on. That waiting period is exactly where most retail investors give up, and exactly where a systematic process keeps you on track.
How to Position Your Portfolio Based on the Nifty PE Ratio
Knowing the nifty PE ratio is only step one. The harder question is what you should do about it, and that depends on your goals, horizon, and risk appetite, not on a generic market call. This is where working with the best stock market advisor in India changes the game. A good advisor translates a headline number like the Nifty 50 valuation into a concrete plan for your money.
Here is a simple way to think about positioning in a fair-but-not-cheap market. First, keep investing systematically rather than trying to perfectly time the top; the Nifty 50 PE at ~20.2 does not justify sitting entirely in cash. Second, tilt new money toward quality investing and value investing instead of crowded, expensive themes. Third, let a rules-based factor investing framework handle rebalancing so emotion stays out of the decision.
Choosing the best stock market advisor in India is not about who promises the highest returns. Promises like that are a red flag. It is about transparency, a repeatable process, and alignment with your interests. If you want a partner who reads valuation signals for a living, the right time to speak with a Wright Research advisor is before the next big move, not after it. The best stock market advisor in India for you is the one whose process you understand and trust through every market cycle.
Frequently Asked Questions
What is a good Nifty PE ratio to buy at?
Historically, a nifty pe ratio below 15 is considered cheap, and an excellent long-term entry point; 15 to 20 is fair value, and above 22 is expensive. At around 20.2 in 2026, the Nifty 50 valuation is in the upper "fair" zone: reasonable for systematic investing, but a phase to favour quality over hype.
Is the Indian stock market overvalued in 2026?
By the nifty PE ratio, no: the nifty 50 PE near 20.2 is below its long-term average of about 22.5, so the market is fairly valued rather than overvalued. However, valuations vary by sector, so disciplined value investing and stock selection matter more than the headline number.
How is the Nifty 50 PE ratio calculated?
The nifty 50 PE equals the index's total market capitalisation divided by the combined trailing twelve-month earnings of all 50 companies. Since April 2021, the NSE has used consolidated earnings instead of standalone earnings, which has lowered the published Nifty PE ratio without the market actually getting cheaper.
Does a high Nifty PE mean a crash is coming?
Not necessarily. A high nifty PE ratio historically weakens three-year forward returns rather than guaranteeing a crash. The data suggests caution, not panic. The smarter response is leaning on quality investing and value investing to find resilient value stocks india, instead of exiting the market entirely on valuation alone.
What is the difference between value investing and factor investing?
Value investing focuses on buying undervalued businesses below their intrinsic worth. Factor investing is broader and systematic: it selects PE stocks using proven signals like value, momentum and quality investing together. Value is one factor within a factor investing framework, which combines several to build a more balanced, rules-based portfolio.
How do I find undervalued stocks in India right now?
Look for undervalued stocks India trading below sector peers but with strong return on equity, consistent earnings, healthy cash flow, and low debt. A low PE alone can be a trap. Building a diversified basket of value stocks India, ideally guided by the best stock market advisor in India, lowers single-stock risk.
About the author

Our Investment Philosophy
Learn how we choose the right asset mix for your risk profile across all market conditions.
Subscribe to our Newsletter
Get weekly market insights and facts right in your inbox