The Nifty Next 50 is a large-cap index fund benchmark tracking the 51st to 100th largest companies on NSE by market capitalisation. Unlike the Nifty 50, it is more volatile, sector-heavy in financials and consumer goods, and offers exposure to high-return mutual funds and popular index funds for investors looking to invest in index funds beyond the flagship index.
Introduction
Most investors who decide to invest in index funds start with the Nifty 50, and that makes sense. It's familiar, stable, and well-covered. But then you come across the Nifty Next 50 and the questions start: Is it an extension of the Nifty 50? Is it safer than a small-cap index fund ? Is it worth including in your portfolio alongside your existing large-cap index fund?
The honest answer is that the Nifty Next 50 is one of the most misunderstood indices in India. It looks like a large-cap index fund on paper, but it behaves more like a multi-cap index fund in practice, delivering sharper swings, higher highs, and deeper drawdowns than most investors expect. Understanding why it behaves this way is the difference between using it strategically and being blindsided by its volatility.
This blog breaks it down completely, from index construction to sector composition, historical performance patterns, and exactly how to access it through popular index funds and ETFs in India.
What Is the Nifty Next 50? How the Index Is Constructed
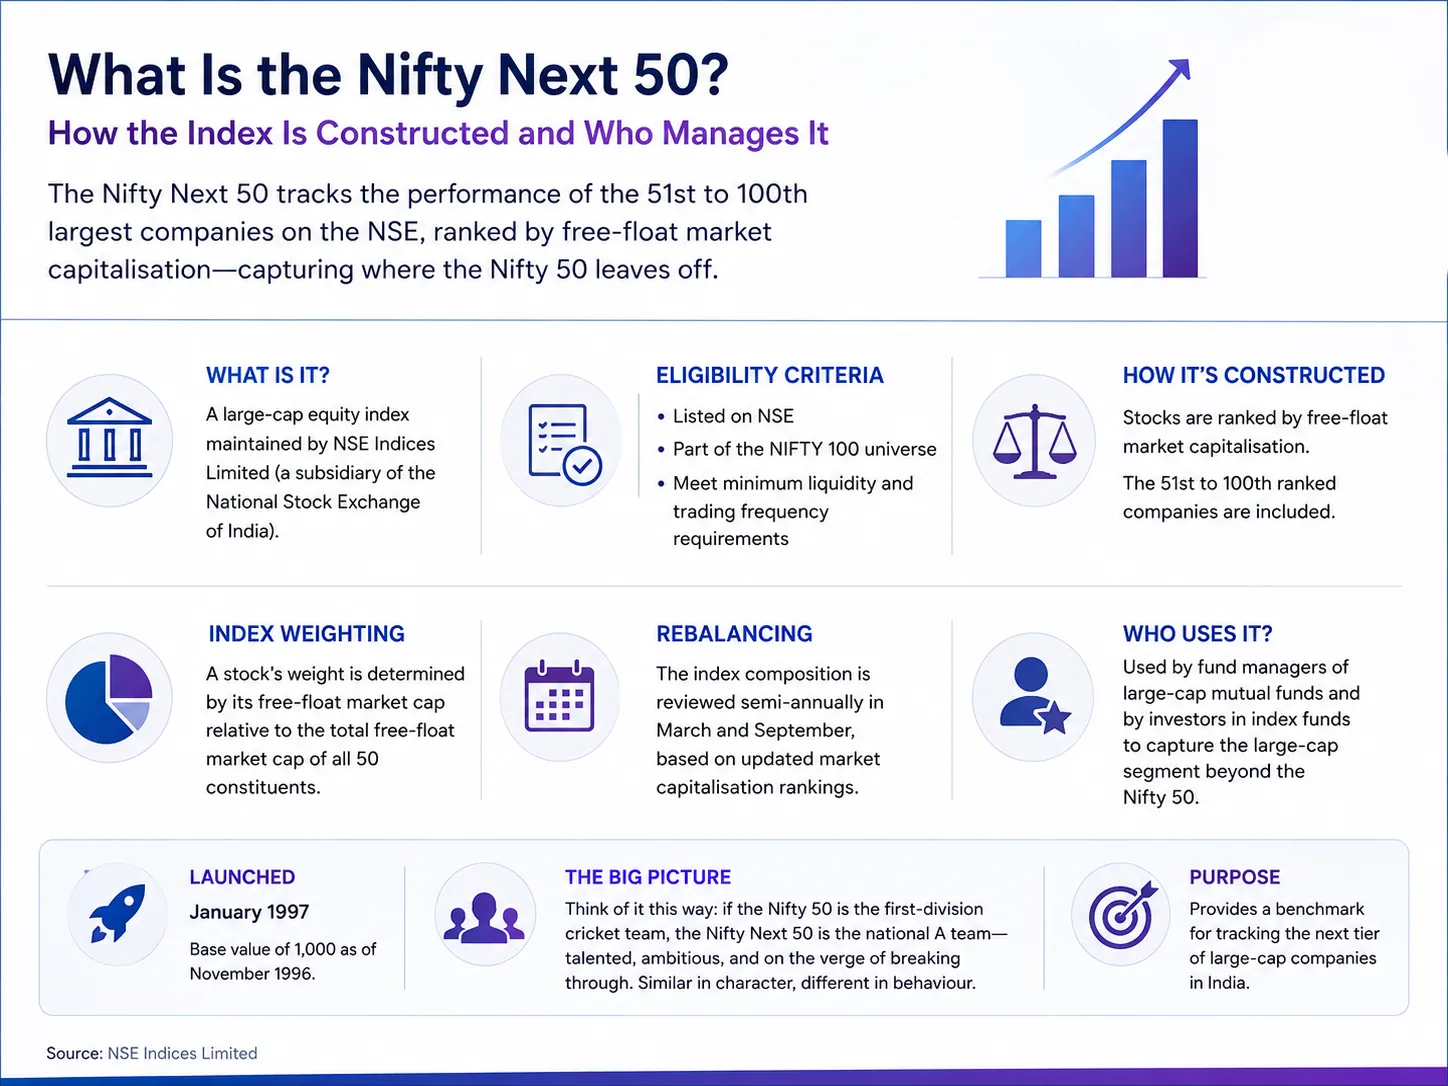
The Nifty Next 50 is a large-cap equity index maintained by NSE Indices Limited (a subsidiary of the National Stock Exchange of India). It tracks the performance of the 51st to 100th largest companies listed on the NSE, ranked by free-float market capitalisation, picking up exactly where the Nifty 50 leaves off.
To be eligible for inclusion in the Nifty Next 50, a stock must be listed on NSE, be part of the NIFTY 100 universe, and meet minimum liquidity and trading frequency requirements. NSE Indices Limited reviews the composition of the index semi-annually, in March and September, and rebalances it based on updated market capitalisation rankings.
A stock's weight in the index is determined purely by its free-float market cap relative to the total free-float market cap of all 50 constituents.
The index was launched in January 1997 and has a base value of 1,000 as of November 1996. Today, it is used as a benchmark by fund managers building large-cap mutual funds, as well as by investors who want to invest in index funds that capture the large-cap segment beyond the Nifty 50's top 50 companies.
Think of it this way: if the Nifty 50 is the first-division cricket team, the Nifty Next 50 is the national A team, talented, ambitious, and on the verge of breaking through. The composition is similar in character but very different in behaviour.
Nifty Next 50 vs Nifty 50: 4 Key Differences for Index Fund Investors
Many investors assume that since both are large-cap index fund benchmarks, they behave similarly. That assumption has cost portfolios real money during market corrections. Here are the four differences that actually matter.
Parameter |
Nifty 50 |
Nifty Next 50 |
Company Size |
India's 50 largest by market cap |
51st to 100th largest by market cap |
Volatility (Std Deviation) |
Lower (~14-16% annualised) |
Higher (~18-22% annualised) |
Sector Concentration |
Financials and IT dominate |
Financials, Consumer Goods, Healthcare |
Liquidity of Stocks |
Very high, blue-chip, institutional |
Moderate, less institutional ownership |
Role in Portfolio |
Core, stability anchor |
Satellite, growth kicker |
Behaviour in Bull Markets |
Steady, benchmark-like gains |
Can significantly outperform |
Behaviour in Bear Markets |
More resilient, shallower drawdowns |
Deeper falls, slower recovery |
The first difference, company size, is the most obvious but the least instructive. The more important distinction lies in liquidity and institutional ownership. Nifty 50 stocks are held extensively by FIIs, domestic institutions, and index-tracking popular index funds globally. When global money flows in or out, these stocks absorb the impact with less price disruption. Nifty Next 50 stocks have lower institutional coverage, meaning price movements are more exaggerated in both directions.
The fourth difference, role in portfolio, is where the insight becomes actionable. Most financial planners treat the Nifty Next 50 as a satellite allocation rather than a core holding, pairing it with a large-cap index fund or a multi-cap index fund to balance stability with growth potential.
Why Nifty Next 50 Is More Volatile Than the Nifty 50
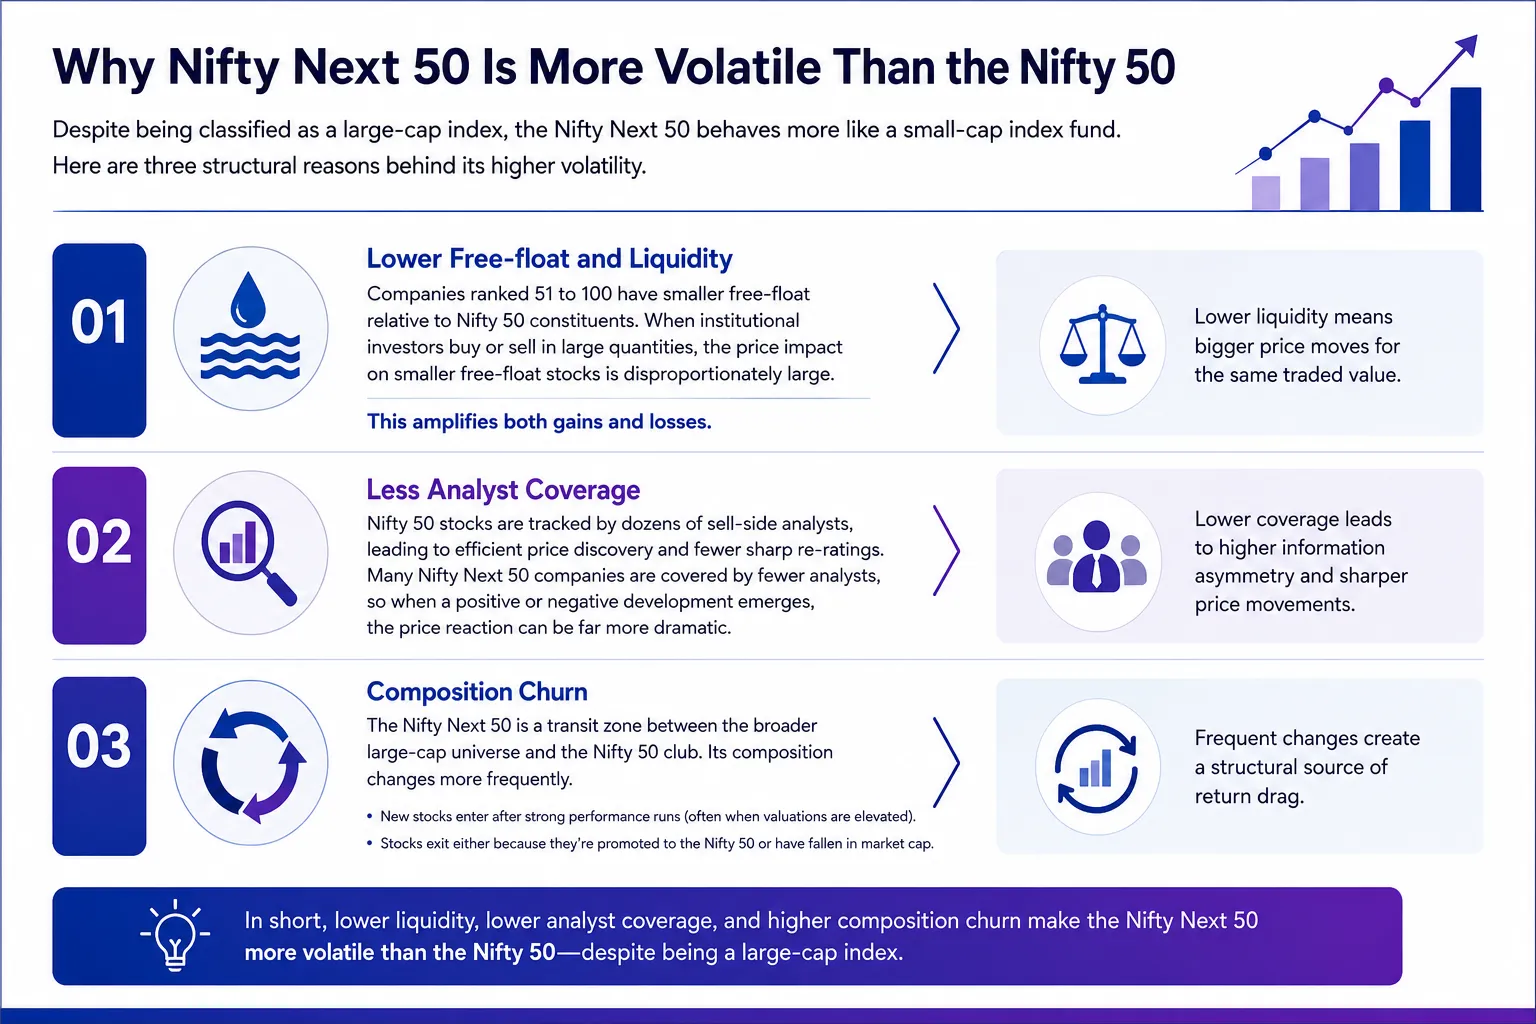
If you've looked at historical returns of index funds tracking the Nifty Next 50, you'll notice something counterintuitive: despite being classified as a large-cap index, it behaves with the kind of volatility you'd associate with a small-cap index fund . There are three structural reasons for this.
The first is lower free-float and liquidity. Companies ranked 51 to 100 have smaller free-floats relative to Nifty 50 constituents. When institutional investors buy or sell in large quantities, the price impact on smaller free-float stocks is disproportionately large. This amplifies both gains and losses.
The second reason is less analyst coverage. Nifty 50 stocks are tracked by dozens of sell-side analysts, which means prices are more efficiently discovered and less prone to sharp re-ratings. Many Nifty Next 50 companies are covered by fewer analysts, meaning when a positive or negative development emerges, the price reaction can be far more dramatic.
The third reason is composition churn. Because the Nifty Next 50 is a transit zone between the broader large-cap universe and the Nifty 50 club, its composition changes more frequently. New stocks enter after strong performance runs (often when valuations are elevated), and stocks exit either because they've been promoted to the Nifty 50 or have fallen in market cap.
This churn introduces a systematic, structural source of return drag, something investors in high-return mutual funds tracking this index should understand clearly.
The Promotion-Demotion Effect: How Stocks Move Between Nifty 50 and Next 50
This is perhaps the most structurally interesting and least discussed feature of the Nifty Next 50.
A stock enters the Nifty Next 50 when its free-float market cap rises enough to push it into the top 100 on NSE. It exits the Nifty Next 50 in one of two ways: it either gets promoted to the Nifty 50 (when it grows large enough to break into the top 50) or it gets demoted out of the NIFTY 100 universe entirely (when its market cap falls below the threshold).
The promotion effect creates a structural headwind. When a Nifty Next 50 stock gets added to the Nifty 50, every large-cap index fund and ETF tracking the Nifty 50 is forced to buy it, regardless of price. This demand pushes the stock's price up at the point of inclusion, which often means index funds tracking the Nifty 50 buy the stock at an elevated price. Meanwhile, funds tracking the Nifty Next 50 have already captured the pre-inclusion run-up and are now forced to sell the stock at the inclusion price.
The demotion effect is equally important. Stocks that fall out of the Nifty Next 50 into the broader NIFTY 500 or lower are sold by all funds that track the index, regardless of fundamentals. This creates forced selling pressure that can temporarily depress prices beyond what the business fundamentals justify.
For investors who want to invest in index funds that capture this dynamic intelligently, understanding the promotion-demotion cycle is critical, especially when evaluating how popular index funds track and handle this reconstitution.
Sector Composition: Why Nifty Next 50 Looks Very Different From Nifty 50
One of the biggest misconceptions is that the Nifty Next 50 is simply a smaller version of the Nifty 50 in terms of sector mix. It isn't.
The Nifty 50 is heavily weighted towards Financials (banks, NBFCs, insurance) and Information Technology. These two sectors together often account for over 50% of the index weight. The Nifty Next 50, by contrast, has a more diversified and in some ways more cyclical sector exposure.
Sector |
Nifty 50 Approx. Weight |
Nifty Next 50 Approx. Weight |
Financial Services |
~36% |
~22% |
Information Technology |
~13% |
~6% |
Consumer Goods (FMCG) |
~8% |
~14% |
Healthcare and Pharma |
~4% |
~10% |
Capital Goods |
~4% |
~9% |
Automobile |
~5% |
~6% |
Metals and Mining |
~4% |
~7% |
What this tells you: the Nifty Next 50 gives you significantly more exposure to large-cap stocks in sectors like FMCG, Pharma, Capital Goods, and Metals, sectors that are either more cyclical or more sensitive to domestic consumption trends. This is one reason the Nifty Next 50 outperforms during India-specific growth phases (rural demand, capex cycles, healthcare spending) while underperforming during global risk-off events, where IT and large banks hold up better.
This sectoral difference is also why large-cap mutual funds that benchmark against the Nifty 50 can look very different from those benchmarking against the Nifty Next 50, even when both fall under the "large-cap" category.
Historical Returns: When Nifty Next 50 Outperforms and When It Underperforms
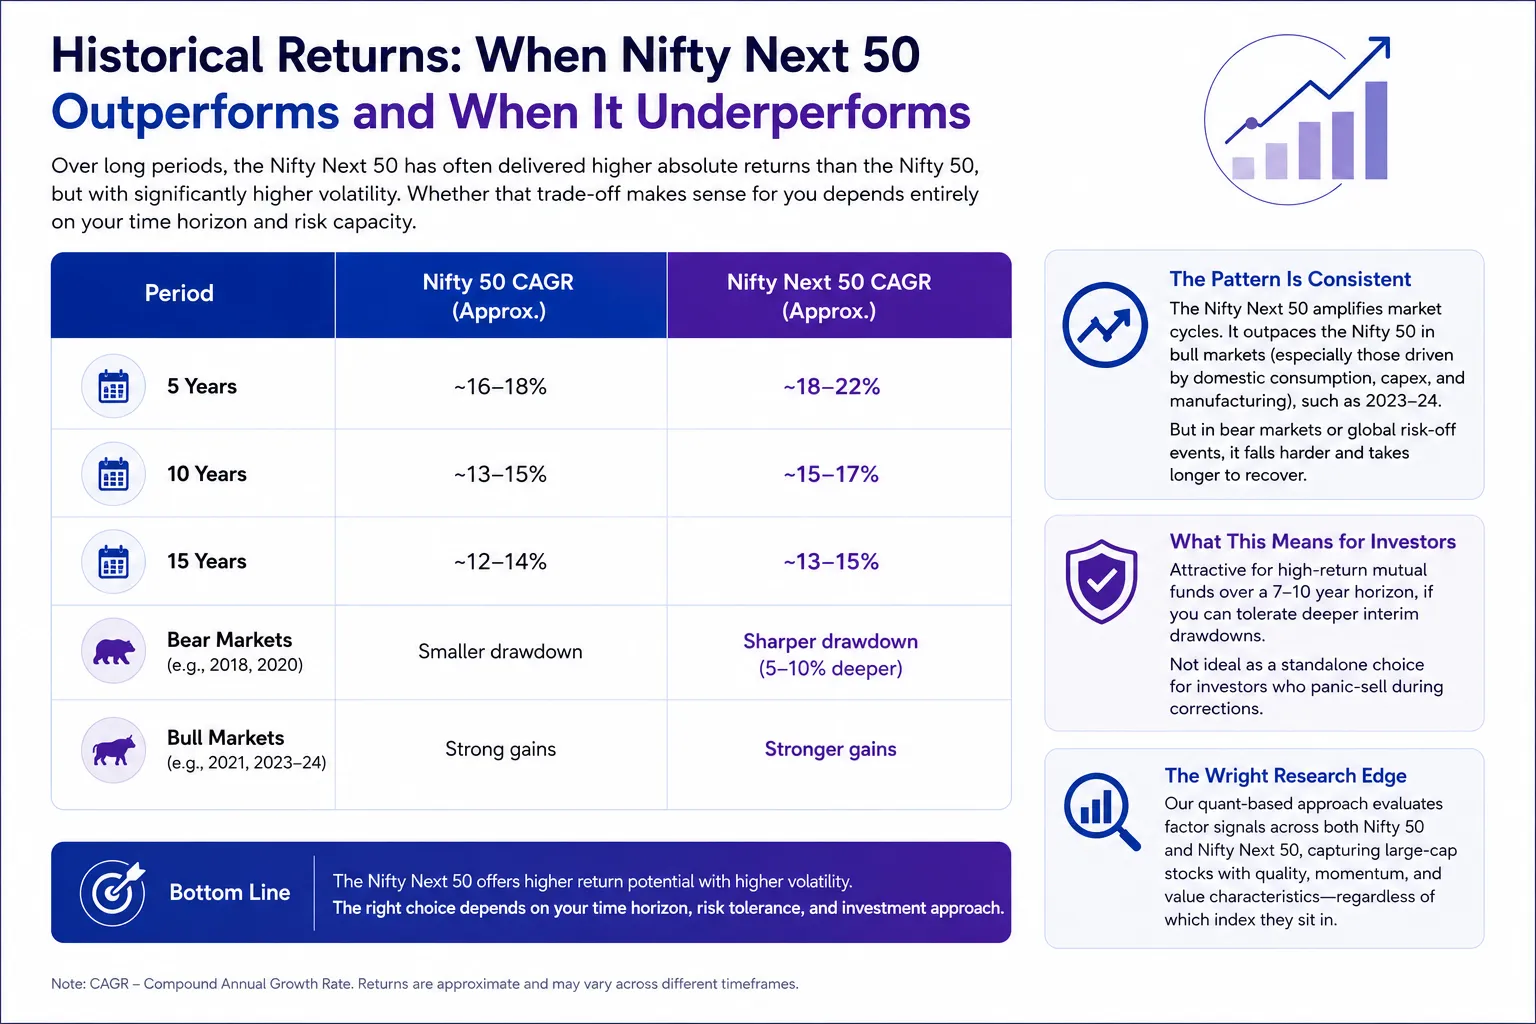
Here's where the data gets interesting. Over long periods, the Nifty Next 50 has often delivered higher absolute returns than the Nifty 50, but with significantly higher volatility. Whether that trade-off makes sense for you depends entirely on your time horizon and risk capacity.
Period |
Nifty 50 CAGR (Approx.) |
Nifty Next 50 CAGR (Approx.) |
5 Years |
~16-18% |
~18-22% |
10 Years |
~13-15% |
~15-17% |
15 Years |
~12-14% |
~13-15% |
Bear Markets (e.g., 2018, 2020) |
Smaller drawdown |
Sharper drawdown (5-10% deeper) |
Bull Markets (e.g., 2021, 2023-24) |
Strong gains |
Stronger gains |
The pattern is consistent: the Nifty Next 50 amplifies market cycles. During bull markets, particularly those driven by domestic consumption, capex, and manufacturing (themes that played out strongly in 2023-24), the Nifty Next 50 significantly outpaces the Nifty 50. During bear markets or global risk-off events, it falls harder and takes longer to recover.
This historical profile makes it an attractive component for investors building high-return mutual funds exposure over a 7-10 year horizon, provided they have the risk tolerance to sit through deeper interim drawdowns. It also makes it a poor standalone choice for investors who panic-sell during corrections, because the very characteristics that generate higher returns also generate scarier short-term losses.
Wright Research's quant-based approach evaluates factor signals across both Nifty 50 and Nifty Next 50 constituents, capturing large-cap stocks that demonstrate quality, momentum, and value characteristics regardless of which index they sit in.
How to Invest in Nifty Next 50: Popular Index Funds and ETFs in India
There are several ways to invest in index funds tracking the Nifty Next 50 in India. The most accessible are index funds (mutual fund format) and ETFs listed on NSE/BSE.
Fund Type |
Key Funds Available |
Expense Ratio (Approx.) |
Min Investment |
Index Fund (Regular) |
UTI Nifty Next 50 Index Fund, Nippon India Nifty Next 50 Junior BeES FoF |
0.25-0.40% |
Rs. 500 SIP |
ETF |
Nippon India Junior BeES, SBI Nifty Next 50 ETF |
0.10-0.20% |
1 unit (market price) |
Large-Cap Mutual Fund |
Some large-cap mutual funds include Next 50 stocks |
Varies |
Rs. 500 to Rs. 1,000 SIP |
Index funds are the simpler option for most retail investors. You invest in mutual fund units, the fund handles ETF arbitrage and rebalancing, and you get NAV-based pricing. ETFs are marginally cheaper in expense ratio but require a demat account and involve dealing with market-price vs NAV spreads.
If you're already building a portfolio with a core large-cap index fund (tracking Nifty 50) and are looking for a growth kicker, allocating 15-25% of your equity portfolio to a Nifty Next 50 index fund is a reasonable starting point, depending on your risk profile. If you're also comfortable with some mid-cap exposure, a multi-cap index fund or a NIFTY 100 index fund may offer a smoother blend.
Conclusion
The Nifty Next 50 is not a safer version of the Nifty 50, nor is it a risky small-cap bet. It occupies a distinct middle ground, offering large-cap stocks with higher growth potential, more sector diversity, and greater volatility than the flagship index. Understanding its construction, its promotion-demotion dynamics, and its historical behaviour in different market cycles is what separates investors who use it strategically from those who are surprised by it.
If you're building a portfolio and wondering whether to invest in index funds tracking this index, or whether a factor-based portfolio built on similar but more selectively filtered large-cap stocks might suit you better, Wright Research' s quant-driven approach is worth exploring.
Frequently Asked Questions
Is Nifty Next 50 better than Nifty 50 for long-term investment?
Neither is universally "better," as they serve different roles. The Nifty Next 50 has historically delivered slightly higher long-term returns but with significantly higher volatility. For investors with a 7-10 year horizon and higher risk tolerance, combining both index funds, with Nifty 50 as core and Nifty Next 50 as satellite, tends to deliver better risk-adjusted outcomes than holding either alone.
Why is the Nifty Next 50 more volatile than Nifty 50?
The Nifty Next 50 companies have lower free-float, less institutional coverage, and more sector cyclicality (FMCG, pharma, capital goods, metals) compared to the IT and banking-heavy Nifty 50. This means price reactions to news are sharper and liquidity thinner. Structurally, it behaves more like a multi-cap index fund than a typical large-cap index fund in terms of volatility.
What happens when a stock moves from Nifty Next 50 to Nifty 50?
When a stock gets promoted from the Nifty Next 50 to the Nifty 50, all index funds and ETFs tracking the Nifty 50 are required to buy it, regardless of price. This forced buying often happens after a significant price run-up, meaning the inclusion price can be elevated. Meanwhile, Nifty Next 50 funds are forced to sell at that same elevated price, which can cap further gains for existing holders.
Which is the best Nifty Next 50 index fund in India?
Among popular index funds tracking the Nifty Next 50, Nippon India Junior BeES (ETF) and UTI Nifty Next 50 Index Fund are widely used options. UTI and Nippon consistently maintain low tracking errors. For most investors, a direct-plan large-cap index fund via a mutual fund platform with a tracking error below 0.10% is the priority metric when selecting a Nifty Next 50 fund.
Is Nifty Next 50 a good index for SIP investment?
Yes. SIP is arguably the best way to invest in index funds tracking the Nifty Next 50, precisely because of its higher volatility. Rupee cost averaging means you accumulate more units during market corrections, which materially improves long-term returns. Investors in high-return mutual funds targeting the Nifty Next 50 via SIP over 7-10 years have historically seen meaningful wealth creation, provided they stay invested through volatile phases.
About the author

Our Investment Philosophy
Learn how we choose the right asset mix for your risk profile across all market conditions.
Subscribe to our Newsletter
Get weekly market insights and facts right in your inbox