


Why Every Investor Eventually Asks This Question?
You've been putting money into a large-cap fund for a couple of years. It's doing fine, nothing dramatic, steady returns, no sleepless nights. Then a friend tells you their mid-cap fund gave 35% last year, and you start wondering whether you're leaving serious money on the table.
This is the conversation that plays out in thousands of investor WhatsApp groups every bull market cycle. And it's a genuinely important question, not because one category is "better" but because understanding what drives the difference in returns is what separates smart allocation from performance-chasing.
The short answer is that large caps and mid-caps are fundamentally different businesses operating at different stages of their growth journeys. Their return profiles, risk characteristics, and behaviour in different market cycles reflect that difference. And when you understand this clearly, you also start to see why instruments like the Flexi Cap Fund, the large and mid-cap fund, and the multicap fund have become increasingly attractive for investors who don't want to make a binary choice.
This blog walks you through everything, from the regulatory definitions, historical return data, the volatility reality, and how to practically build a mutual fund portfolio that balances both.
See what markets are pricing in
Live indices, sector moves and market breadth — the backdrop to every story we publish.
How SEBI Defines Large Cap and Mid Cap: The Market Cap Rank System
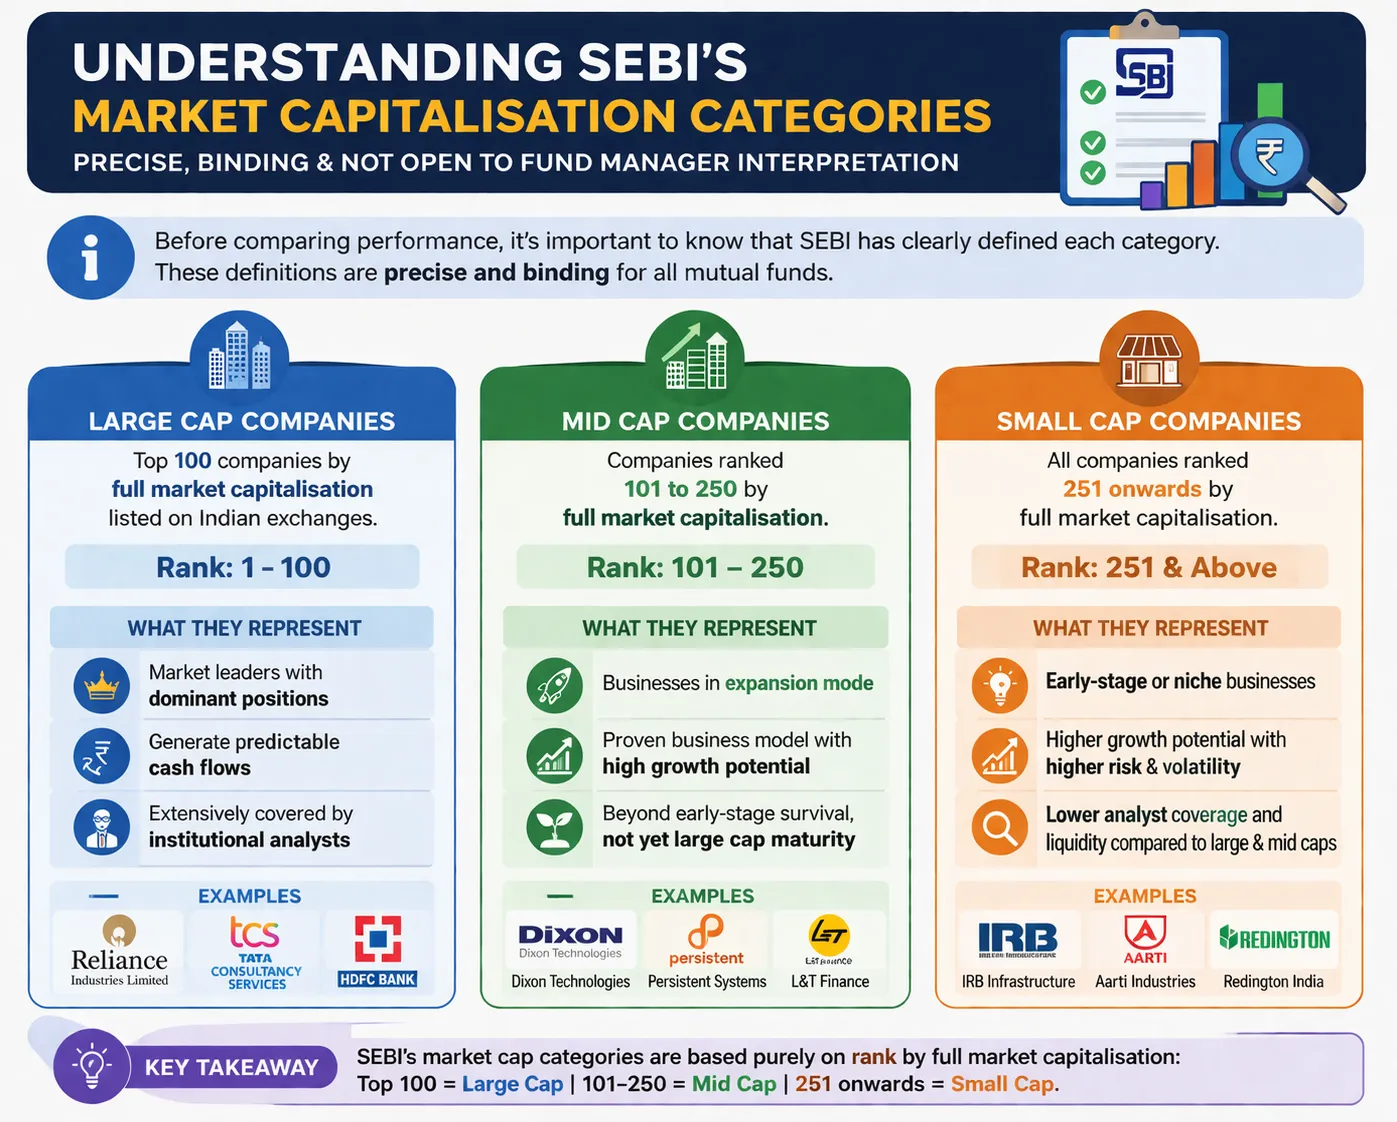
Before comparing performance, you need to understand that SEBI doesn't leave these categories open to fund manager interpretation. The definitions are precise and binding.
Large-cap companies are defined as the top 100 companies by full market capitalization listed on Indian exchanges. These are the Reliances, TCSs, and HDFCs of the market businesses that have already established dominant market positions, generate predictable cash flows, and are covered extensively by institutional analysts.
Mid-cap companies occupy ranks 101 to 250. These are businesses in expansion mode, large enough to have proven their business model, but still growing fast enough that significant value creation lies ahead. Think of mid-caps as companies that have cleared the early-stage survival test but haven't yet reached the maturity of a large cap.
Small-cap companies are everything from rank 251 onwards.
This SEBI classification, introduced in 2017 through its circular on categorization and rationalisation of mutual fund schemes, also governs what each fund category must hold. A large-cap fund must invest at least 80% of its assets in large-cap stocks. A mid-cap fund must invest at least 65% in mid-cap stocks. A large and mid-cap fund , as defined by SEBI, must hold at least 35% each in large caps and mid-cap stocks, giving it a blended mandate.
The Flexi Cap Mutual Fund category, by contrast, has no mandatory allocation constraint across market cap segments. A flexi cap fund manager can move freely 80% large cap one quarter, 60% mid cap the next, based on where they see opportunity. This is precisely what makes the best flexi cap fund choices so widely discussed among investors building dynamic portfolios.
Similarly, a multicap fund under SEBI's 2020 circular must maintain at least 25% each in large cap, mid cap, and small cap stocks, making it the most diversified by mandate of all equity fund categories.
The Return Gap: Why Mid Caps Have Historically Outperformed Large Caps Over 10 Years
This is where the data becomes genuinely interesting, and sometimes counterintuitive for newer investors.
Over long periods, 10 years and above, mid-cap indices have consistently outperformed large-cap indices in India. The Nifty Midcap 150 TRI has delivered significantly higher compounded returns than the Nifty 50 TRI over most rolling 10-year periods in the past two decades. The premium has historically been in the range of 3 to 5 percentage points annually, which compounds into a substantial wealth gap over time.
Historical Return Comparison (Indicative, Index-Level)
Period | Nifty 50 TRI (Approx. CAGR) | Nifty Midcap 150 TRI (Approx. CAGR) | Return Premium |
5-Year (2019–2024) | ~16–17% | ~22–24% | ~6–7% |
10-Year (2014–2024) | ~13–14% | ~18–20% | ~5–6% |
15-Year (2009–2024) | ~14–15% | ~17–19% | ~3–4% |
Note: Actual returns vary by specific period and measurement date. Past performance is not indicative of future results.
Why does this gap exist? Three reasons drive it structurally.
Growth runway: A mid-cap company growing revenue at 25% annually has much more room to continue doing so than a large-cap company already operating at a massive scale. Growing from ₹2,000 crore to ₹4,000 crore in revenue is far more achievable than doubling from ₹50,000 crore.
Earnings re-rating: When a mid-cap company consistently delivers earnings growth, the market doesn't just pay for those earnings; it re-rates the multiple upward as the business gains credibility. A company that moved from a 15x PE to a 30x PE on top of 20% earnings growth has delivered enormous returns. Large caps, already widely tracked and fairly priced, see much less of this multiple expansion.
Analyst coverage gap: Mid-cap companies are followed by fewer analysts, which means pricing inefficiencies exist. A skilled fund manager can identify mispriced mid-caps that the broader market hasn't yet caught up with. This is precisely why actively managed best flexi cap mutual funds and multi-cap mutual funds that tilt toward mid caps can add meaningful alpha over passive large cap exposure.
This return premium is also the reason why the best multicap mutual fund choices, which combine large, mid, and small cap exposure, tend to outperform pure large cap funds over full market cycles when measured over the right timeframe.
The Drawdown Gap: Why Mid Caps Fall Harder in Corrections
The outperformance premium of mid-caps comes with a cost that many investors intellectually acknowledge but emotionally underestimate until they live through it: mid-caps fall harder and recover more slowly in market corrections.
In the 2020 COVID crash, the Nifty Midcap 150 fell approximately 42% from its January 2020 peak, compared to roughly 38% for the Nifty 50. But the recovery trajectory also diverged; large caps recovered to their pre-crash levels faster because institutional flows returned to large, liquid names first.
In the 2018 correction cycle, mid-caps bore the brunt far more severely. The Nifty Midcap 100 lost over 30% from its January 2018 high over the following 18 months, while the Nifty 50 remained relatively more contained.
Why Mid-Caps Fall More in Risk-Off Environments
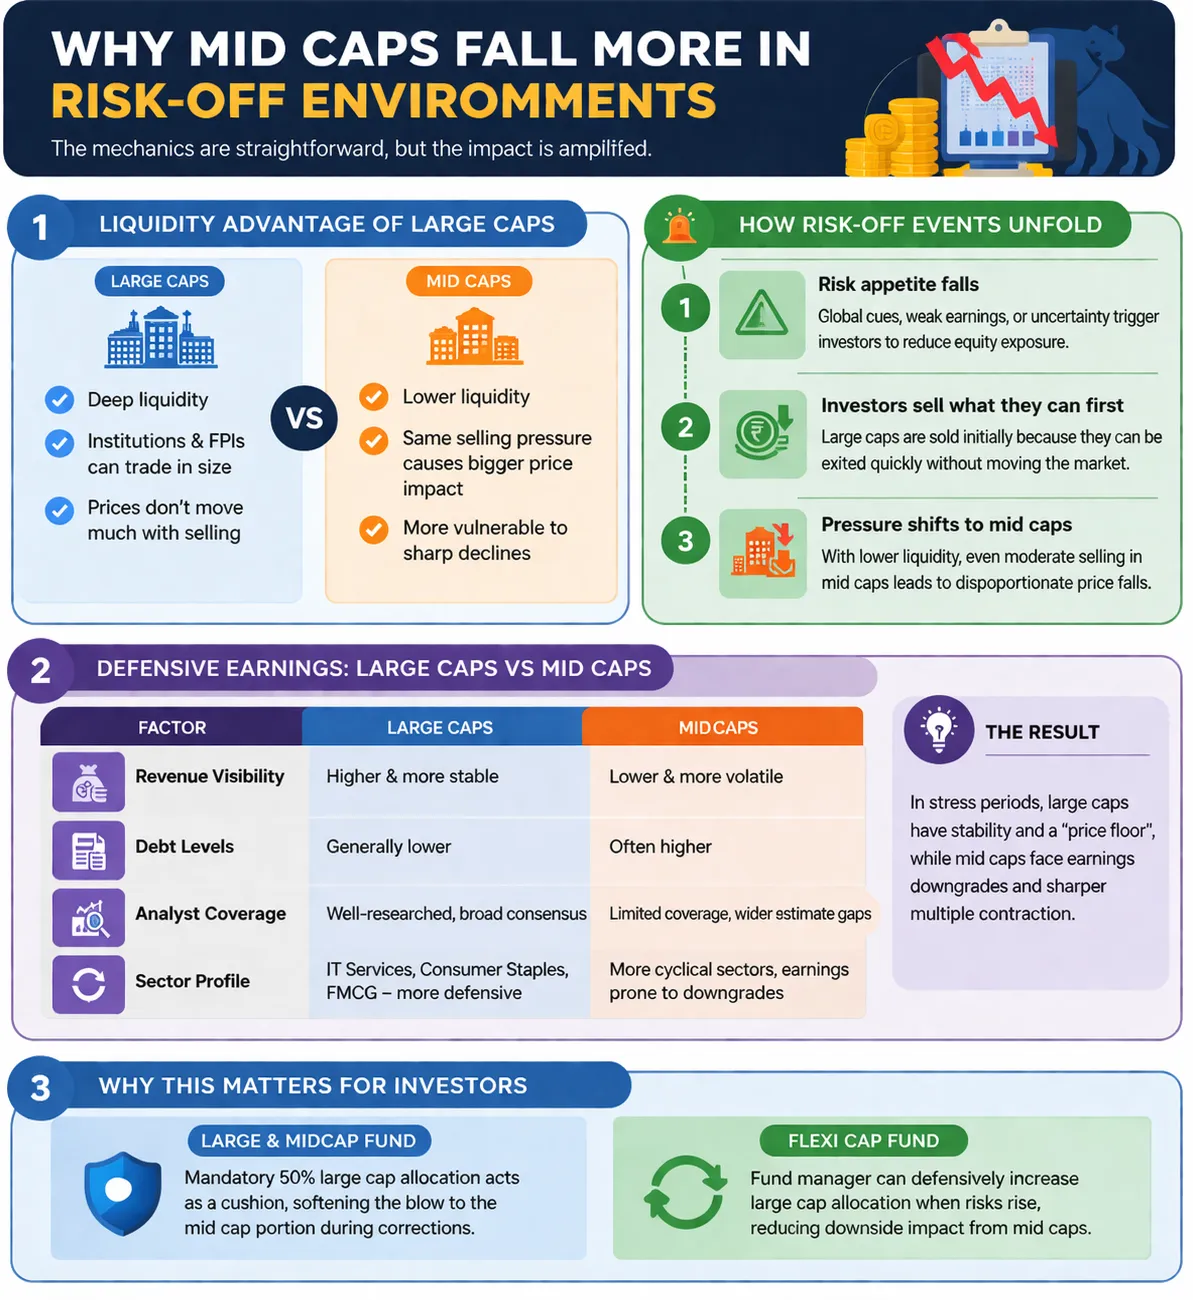
The mechanics are straightforward. Large-cap stocks have deep liquidity, and institutional investors, foreign portfolio investors, and large domestic funds can transact significant volumes without materially moving the price. When risk appetite falls, and funds need to reduce equity exposure, they sell what they can sell quickly. Mid-caps, being less liquid, see amplified price impact from the same quantum of selling.
Additionally, large-cap companies, particularly in sectors like IT services, consumer staples, and FMCG, have more defensive earnings characteristics. Revenue visibility is higher, debt levels tend to be lower, and analyst consensus provides a price floor of sorts. Mid-cap companies in more cyclical sectors are more vulnerable to earnings downgrades in stress periods, which compounds the price pressure.
This volatility reality is precisely why the large and midcap fund category exists as a regulated SEBI category, which allows investors to capture midcap growth while the mandatory large cap allocation provides a cushion during corrections. Similarly, the Flexi Cap Fund structure gives fund managers the ability to defensively shift toward large caps when valuations suggest caution, something that pure mid-cap fund managers cannot do.
Large Cap Stability vs Mid Cap Growth: What Each Offers in Different Market Cycles
Think of a market cycle as having four distinct phases: early recovery, mid-cycle expansion, late-cycle exuberance, and correction. Each phase rewards different kinds of equity exposure differently.
Early Recovery Phase (post-correction, economic rebound beginning): This is typically where mid-caps begin to accelerate meaningfully. After a correction has compressed valuations, mid-caps with strong balance sheets and earnings visibility start getting re-rated quickly. Multi-cap mutual funds and flexi-cap funds that increased mid-cap exposure near the bottom tend to capture this move efficiently.
Mid-Cycle Expansion Phase (broad economic growth, earnings upgrades across the board): Both large caps and mid caps perform well here, but mid caps often run faster. This is the phase where chasing mid-cap performance feels most justified and where investors who didn't own them feel they're "missing out." The best multicap fund choices with a higher mid-cap weight tend to shine in this environment.
Late-Cycle Exuberance Phase (valuations stretched, earnings growth decelerating): Large caps tend to hold up better here because the quality of earnings is higher, and institutional buyers continue to support them. Mid-cap valuations, having run up faster, are more vulnerable to any negative earnings surprise.
Correction Phase (risk-off, liquidity preference): As discussed above, large caps demonstrate relative resilience. The large and mid-cap fund structure's mandatory large-cap allocation of a minimum 35% provides meaningful downside buffering here.
Understanding this cycle dynamic is also why building a mutual fund portfolio purely around mid-caps or purely around large caps creates avoidable concentration risk. The complementary nature of these two categories is a feature, not a compromise.
Get research like this in your inbox
The week’s research that mattered, in five minutes. Joined by 2L+ investors.
Expense Ratios, Liquidity and Tracking Error: The Practical Differences
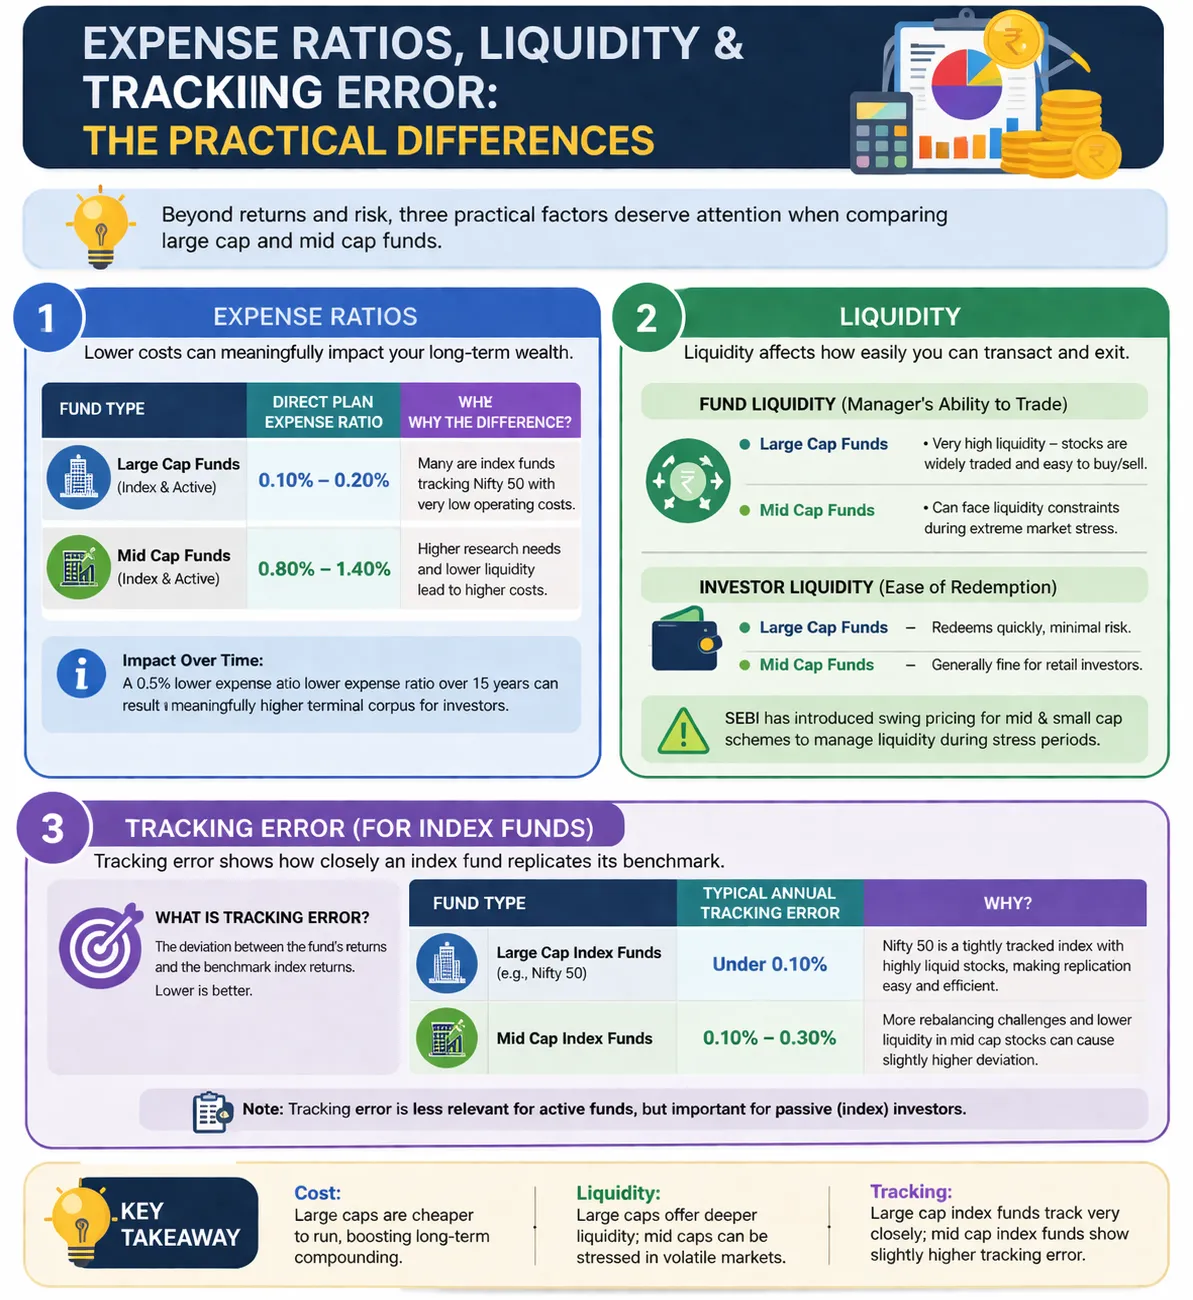
Beyond returns and risk, three practical factors deserve attention when comparing large-cap and mid-cap funds.
Expense Ratios: Large-cap funds, particularly index funds tracking the Nifty 50, have among the lowest expense ratios in the mutual fund universe, often as low as 0.10–0.20% for direct plans. Actively managed large-cap funds typically charge 0.80–1.20% for direct plans. Mid-cap funds, which require more active research and have higher transaction costs due to lower liquidity, typically charge 0.80–1.40% for direct plans. Over a 15-year horizon, a 0.5% difference in expense ratio can translate to a meaningful difference in terminal corpus.
Liquidity: This matters at two levels: fund liquidity (how easily the fund manager can transact) and investor liquidity (how quickly you can redeem). Large-cap funds have high portfolio liquidity because the underlying stocks are deeply traded. Mid-cap funds can face liquidity constraints during extreme market stress, which is why SEBI has introduced swing pricing mechanisms for mid and small-cap schemes. For most retail investors with reasonable portfolio sizes, redemption liquidity is not a practical concern. But for HNI investors or institutional allocators managing large amounts, it becomes relevant.
Tracking Error (for Index Funds): If you're investing in a large-cap index fund, tracking error refers to how closely the fund replicates its benchmark. The Nifty 50 is a tightly tracked index, and most quality large-cap index funds maintain very low tracking error (under 0.10% annually). Mid-cap index funds can have slightly higher tracking error due to rebalancing challenges in less liquid stocks. This is less relevant for active funds, but worth noting for passive investors.
How to Combine Large Cap and Mid Cap Mutual Funds in Your Portfolio: Allocation by Risk Profile
The most practical question for most investors isn't "which is better?" but "how much of each should I hold?" And the answer depends on three factors: your investment horizon, your actual risk tolerance (not the one you claim on a KYC form), and your current life stage.
Framework: Allocating by Investor Profile
Investor Profile | Suggested Large Cap Allocation | Suggested Mid Cap Allocation | Instrument Options |
Conservative (5–7 yr horizon, low volatility tolerance) | 60–70% | 20–30% | Large-cap index fund + Large & Mid Cap Fund |
Moderate (7–10 yr horizon, can stomach 30% drawdowns) | 40–50% | 30–40% | Flexi Cap Fund + Midcap fund |
Aggressive (10+ yr horizon, long-term wealth builder) | 25–35% | 40–50% | Multicap Fund + Dedicated midcap fund |
This is indicative and not personalised advice. Consult a SEBI-registered advisor before making allocation decisions.
This is also where the Flexi Cap Mutual Fund and the best multicap mutual fund categories become genuinely useful. Rather than managing the large-cap / mid-cap ratio yourself, you're delegating that decision to a fund manager with the mandate to optimize it based on market conditions.
The large and midcap fund category is particularly elegant for investors who want mandatory exposure to both segments within a single fund. You always hold at least 35% large cap (stability) and at least 35% mid cap (growth), with the remaining 30% left to the fund manager's discretion.
For investors who prefer to be more hands-on with their mutual fund portfolio construction, combining a Nifty 50 index fund (for low-cost large-cap core) with an actively managed mid-cap fund (for alpha potential) has been a historically effective approach. This barbell strategy balances the cost efficiency of passive large-cap exposure with the active management premium that mid-cap market inefficiencies can justify.
Top Large Cap and Mid Cap Funds to Consider in 2025–26
Note: The following is for informational and educational purposes only. It is not a buy or sell recommendation. Past performance is not indicative of future results. Please consult a SEBI-registered investment advisor before investing. Investments in mutual funds are subject to market risk.
Top Large & Mid Cap Funds (SEBI Category: Large & Mid Cap)
Fund Name | 3-Year Return (Approx.) | 5-Year Return (Approx.) | Expense Ratio (Direct) |
Mirae Asset Large & Midcap Fund | ~18–20% | ~20–22% | ~0.57% |
Kotak Equity Opportunities Fund | ~17–19% | ~20–22% | ~0.47% |
Canara Robeco Emerging Equities | ~16–18% | ~19–21% | ~0.47% |
Edelweiss Large & Mid Cap Fund | ~17–19% | ~19–21% | ~0.36% |
Top 5 Multicap Funds for Long-Term (SEBI Category: Multi Cap)
Fund Name | 3-Year Return (Approx.) | 5-Year Return (Approx.) | Expense Ratio (Direct) |
Nippon India Multi Cap Fund | ~24–26% | ~22–24% | ~0.84% |
Quant Active Fund | ~22–25% | ~27–30% | ~0.58% |
ICICI Prudential Multicap Fund | ~20–22% | ~20–22% | ~0.93% |
Mahindra Manulife Multi Cap Fund | ~19–21% | ~20–22% | ~0.48% |
Invesco India Multicap Fund | ~17–19% | ~18–20% | ~0.57% |
Best Flexi Cap Funds (SEBI Category: Flexi Cap)
Fund Name | 3-Year Return (Approx.) | 5-Year Return (Approx.) | Current Large Cap Tilt |
Parag Parikh Flexi Cap Fund | ~18–20% | ~22–24% | High (40–50%) |
HDFC Flexi Cap Fund | ~20–23% | ~20–22% | Moderate-High |
Quant Flexi Cap Fund | ~22–25% | ~25–28% | Tactical/Dynamic |
Franklin India Flexi Cap Fund | ~16–18% | ~18–20% | Moderate |
Returns are approximate, calendar-year-based estimates. Always verify current data on AMFI, ValueResearch, or the respective AMC's website before investing.
Conclusion
The debate between large-cap and mid-cap mutual funds is ultimately a false binary. Both categories serve distinct purposes in a well-constructed mutual fund portfolio. Large caps provide the stability, liquidity, and earnings predictability that protect wealth during downturns. Mid-caps provide the growth acceleration and re-rating potential that builds it meaningfully over time.
The real question is how to allocate between them intelligently — and that's where categories like the Flexi Cap Fund, multicap fund, and large and midcap fund offer genuinely useful structural solutions. Whether you're evaluating the best flexi cap fund options, looking at tthe op 5 multicap funds for long-term wealth building, or simply trying to understand whether your current allocation makes sense, the framework in this blog should help you think more clearly.
If you'd like a portfolio analysis that looks at your current mutual funds portfolio allocation and recommends adjustments aligned to your goals.
Run the numbers on your next investment
Project returns on a lumpsum or SIP with our free calculators.
FAQs: Large Cap vs Mid Cap Mutual Funds
1. What is the main difference between large-cap and mid-cap mutual funds?
Large-cap mutual funds invest at least 80% of their corpus in the top 100 companies by market capitalisation. Mid-cap funds invest at least 65% in companies ranked 101–250. The core difference is the growth stage of the underlying companies; large caps are established and stable, mid-caps are growing and more volatile. Large-cap funds offer relative stability; mid-cap funds offer higher return potential over long horizons with higher interim volatility.
2. Are mid-cap funds better than large-cap funds for long-term investment?
Over 10-year-plus horizons, mid-cap indices have historically outperformed large-cap indices in India by 3–6% annually. However, this outperformance comes with higher drawdowns and volatility in the interim. Whether mid-cap funds are "better" depends on your time horizon and ability to stay invested during corrections without panicking. For most long-term investors, a combination of both categories through a large and midcap fund or a Flexi Cap Mutual Fund tends to be more practical than choosing one over the other.
3. What is a Flexi Cap Fund, a nd how is it different from a Large & Mid Cap Fund?
A Flexi Cap Fund has no mandatory allocation constraint the fund manager can invest any proportion across large cap, mid cap, and small cap stocks based on their market outlook. A large and mmid-capfund has a regulatory mandate to hold at least 35% each in large-cap and mid-cap stocks at all times. The best flexi cap fund choices give more flexibility to the manager; the large and midcap funds give investors a more predictable allocation framework.
4. What is a multicap fund, and how does it differ from a flexi cap fund?
A multicap fund, per SEBI's 2020 circular, must maintain at least 25% each in large cap, mid cap, and small cap stocks. This makes it the most diversified equity category by mandate. A Flexi Cap Mutual Fund has no such minimum per segment and can go to zero in small caps or large caps if the manager chooses. Multi-cap mutual funds are generally considered more diversified, but also inherently include small-cap risk. The best multicap mutual fund options tend to be run by managers who actively manage the allocation within those minimums.
5. Which is better for SIP investing — large cap, mid cap, or flexi cap?
All three categories work well with SIP (Systematic Investment Plan) because of the rupee cost averaging benefit. That said, SIP in mid-cap and flexi-cap funds tends to work particularly well because their higher volatility means you accumulate more units during corrections. Over a 10-year SIP horizon, mid-cap and best flexi cap mutual funds have historically delivered better SIP XIRR than pure large-cap funds. For most first-time investors building a mutual fund portfolio, starting with a large-cap index fund and a mid-cap Flexi Cap Fund is a sensible approach.
6. What are the top 5 multicap funds for long-term investment?
The top 5 multicap funds for long-term investment most consistently evaluated include Nippon India Multi Cap Fund, Quant Active Fund, ICICI Prudential Multicap Fund, Mahindra Manulife Multi Cap Fund, and Invesco India Multicap Fund. That said, fund selection should be based on current performance data, fund manager track record, consistency of outperformance, and alignment with your specific investment goals. Wright Research's quant-driven approach to mutual fund selection can help you identify the most suitable options for your mutual fund portfolio.


