by Siddharth Singh Bhaisora
Published On Feb. 13, 2026
The copper crisis is not that the world is about to “run out” of copper. It’s that the system is running with too little slack across the full chain,mines, concentrate, smelters, and refined metal,so even modest disruptions can trigger sharp price moves and industrial stress. In 2024, global refined copper production was 27.397 million tonnes versus refined usage of 27.328 million tonnes,a wafer-thin surplus of ~69,000 tonnes, effectively “barely balanced.”
That “barely balanced” status matters because inventories are not big enough to absorb shocks smoothly. World refined copper stocks of 1.399 million tonnes at end-2024, rising to 1.586 million tonnes by end-Nov 2025. That sounds large until you realize it’s only a small fraction of annual usage (roughly weeks, not months) and much of it can be in the wrong place, form, or brand for buyers that need deliverable metal.
The deeper issue is structural: demand is shifting from cyclical (construction booms and busts) toward infrastructure-like (grids, EV ecosystems, data centers) that tends to persist even when the economy cools. Meanwhile supply growth is slow, disruption-prone, and constrained by ore grades and permitting. The IEA explicitly flags copper as a major exception among energy-transition minerals: based on announced project pipelines, it sees an implied ~30% deficit for copper by 2035 under stated policies.
Electrification is the first engine, and it’s copper-heavy by design. A typical EV uses ~80–90 kg of copper, roughly 4× a conventional car,before you add chargers and grid upgrades that make EV adoption possible. This isn’t a one-off bump: every percentage point of EV penetration multiplies into copper demand across charging networks, substations, and distribution upgrades.

The second engine is the power grid itself,often underappreciated because it doesn’t trend on social media. Grids need copper in cables, transformers, switchgear, and transmission expansions, and the energy transition requires both more generation and more connectivity (to move renewable power from where it’s generated to where it’s consumed). The IEA has repeatedly emphasized that electricity networks require large amounts of copper and that grid buildout is a key constraint on clean-energy scaling.
The third engine is data centers and AI infrastructure. S&P Global forecasts data-center copper demand rising from ~1.1 million tonnes (2025) to ~2.5 million tonnes (2040), and notes AI-training data centers could account for a large share of that demand growth. Over time, it’s like adding a major new end-market with its own grid connections, internal power distribution, and redundancy requirements.
On paper, mine output is still rising,but not reliably enough to meet the new demand trajectory. ICSG reports world copper mine production of 22.958 million tonnes in 2024, against mine capacity of 28.364 million tonnes and a capacity utilization rate of ~80.9%. That utilization figure is the tell: when you run near practical limits, unplanned downtime matters more, maintenance delays hurt more, and every new disruption lands harder.
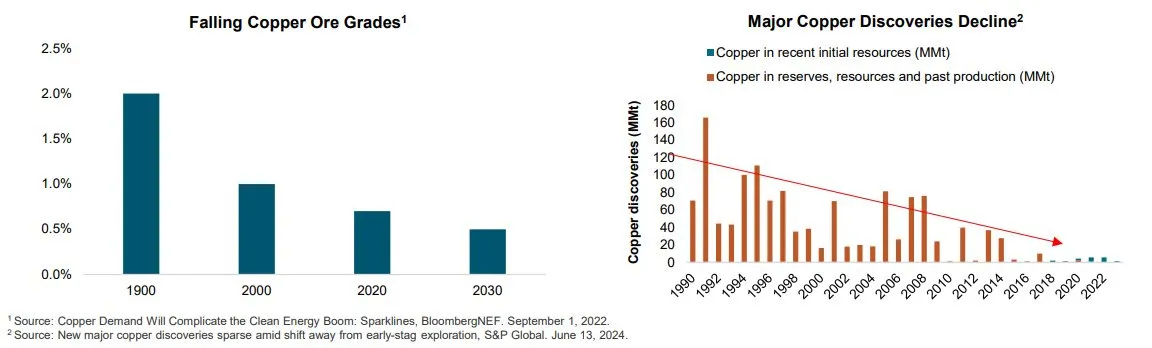
Then there’s the reality of project lead times and geology. New mines are slow because permitting, community acceptance, water constraints, and power access can take years. At the same time, ore grades are declining in many mature districts, meaning you must move more rock to produce the same copper,raising costs, energy use, and operational complexity. The IEA points to declining ore grades and long lead times as core drivers behind the projected supply gap.
The 2025 incident at Freeport-McMoRan’s Grasberg mine is a clean example of a disruption. ~591,000 tonnes of copper output was lost from Sept 2025 through end-2026, about 2.6% of 2024 global mine production. Goldman Sachs separately estimated a total loss of roughly ~525,000 tonnes tied to the disruption and downgraded supply forecasts. In a market with little slack, those are deficit-makers.
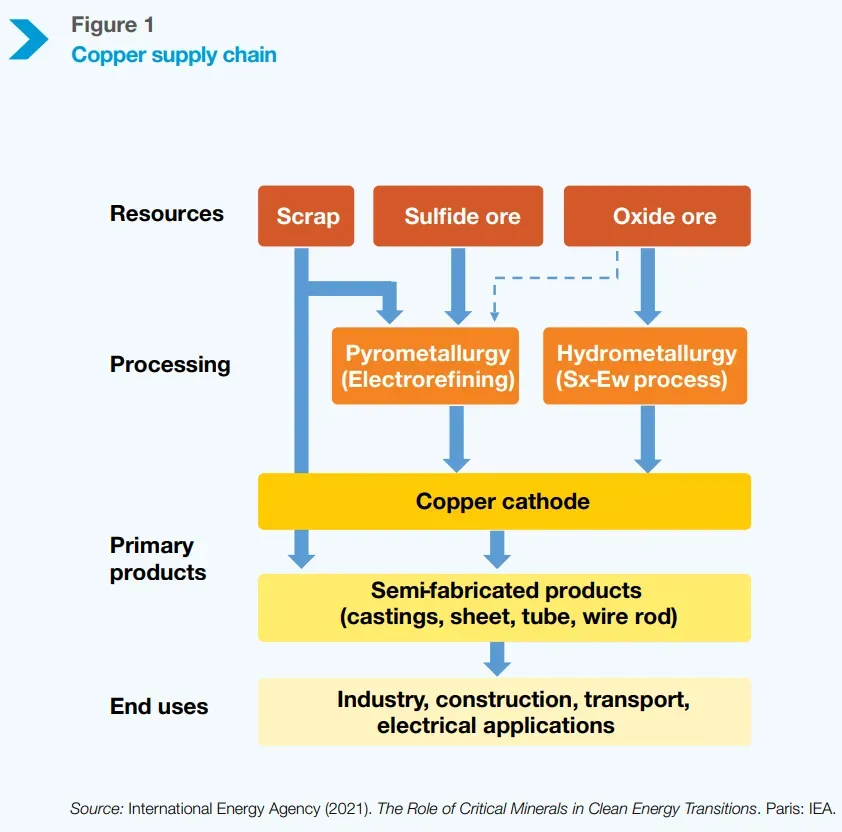
Most people track “copper prices,” but the industry’s stress often shows up first in concentrate. Mines produce either concentrate or SX-EW cathode; a huge share of global output is concentrate that must be smelted and refined. If smelting capacity grows faster than concentrate supply, the pinch hits the middle of the chain before end-users even notice,until refined availability tightens and premiums spike.
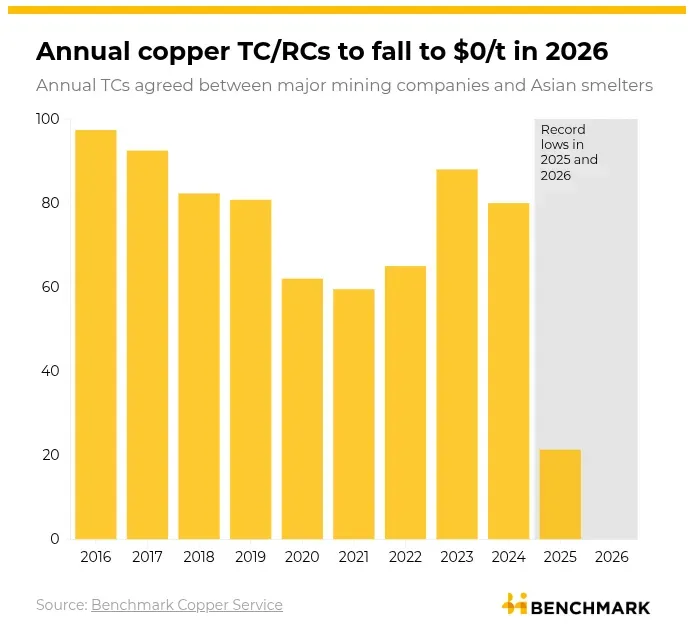
The cleanest stress indicator is TC/RC (treatment and refining charges),the fee smelters earn for turning concentrate into refined copper. When concentrate is abundant, smelters have pricing power and TC/RC rises. When concentrate is scarce, miners gain leverage and TC/RC collapses. A Chinese smelter and Antofagasta reportedly agreed annual copper concentrate TC/RCs at $0/t for 2026, far below the already-low $21.25/t (and 2.125¢/lb) benchmark for 2025.
What happens when TC/RC collapses? Smelters don’t benefit from high copper prices the way miners do, because smelter economics are driven by processing fees and by-product credits. Reuters reports that Chinese smelters have leaned on sulphuric acid by-product economics as TC/RC sank,acid prices nearly doubling by late 2025 and delivering an estimated ~$1.5 billion boost to smelters. That’s not a healthy foundation: it means the industry’s core processing link is being kept afloat by a volatile by-product market.
Headline balances can look calm even while the physical market is stressed. ICSG’s table shows that 2024 ended with a small refined surplus (~69,000 tonnes) and by the end-2024 refined stocks of 1.399 million tonnes, rising to 1.586 million tonnes by end-Nov 2025. But inventories are fragmented across exchanges, bonded warehouses, and off-market holdings, and they may not be in deliverable form or in the region where demand is most urgent.
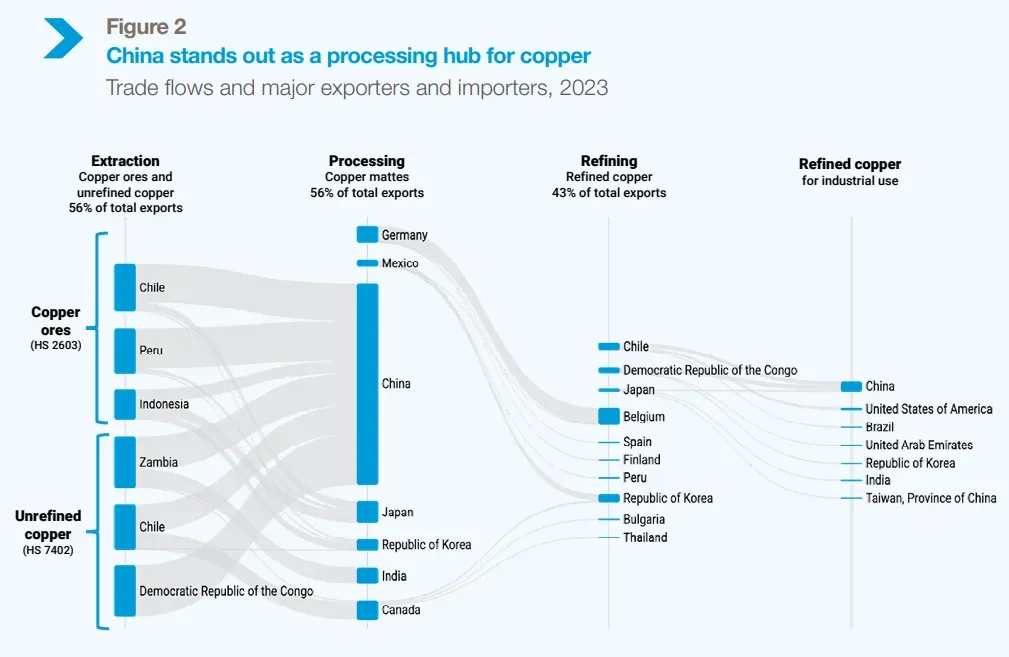
You can see this fragmentation in how trade flows have contorted. In 2025, China exported nearly 800,000 tonnes of refined copper despite being the world’s largest buyer,because regional premiums and tariff threats created arbitrage incentives that reshuffled global flows. When the world’s biggest consumer becomes a major exporter in the same year, it’s not because “copper is plentiful”; it’s because price signals are pulling metal into unusual routes.
Inventory movement into the U.S. is another distortion signal. Comex warehouse stocks at ~453,450 metric tonnes as of Jan 2, 2026, up roughly 400% since April, driven by pre-tariff shipping and positioning. That build can coincide with tightness elsewhere,meaning stocks aren’t a single global pool; they’re a set of regional reservoirs that can fill and drain for reasons unrelated to true end-use demand.
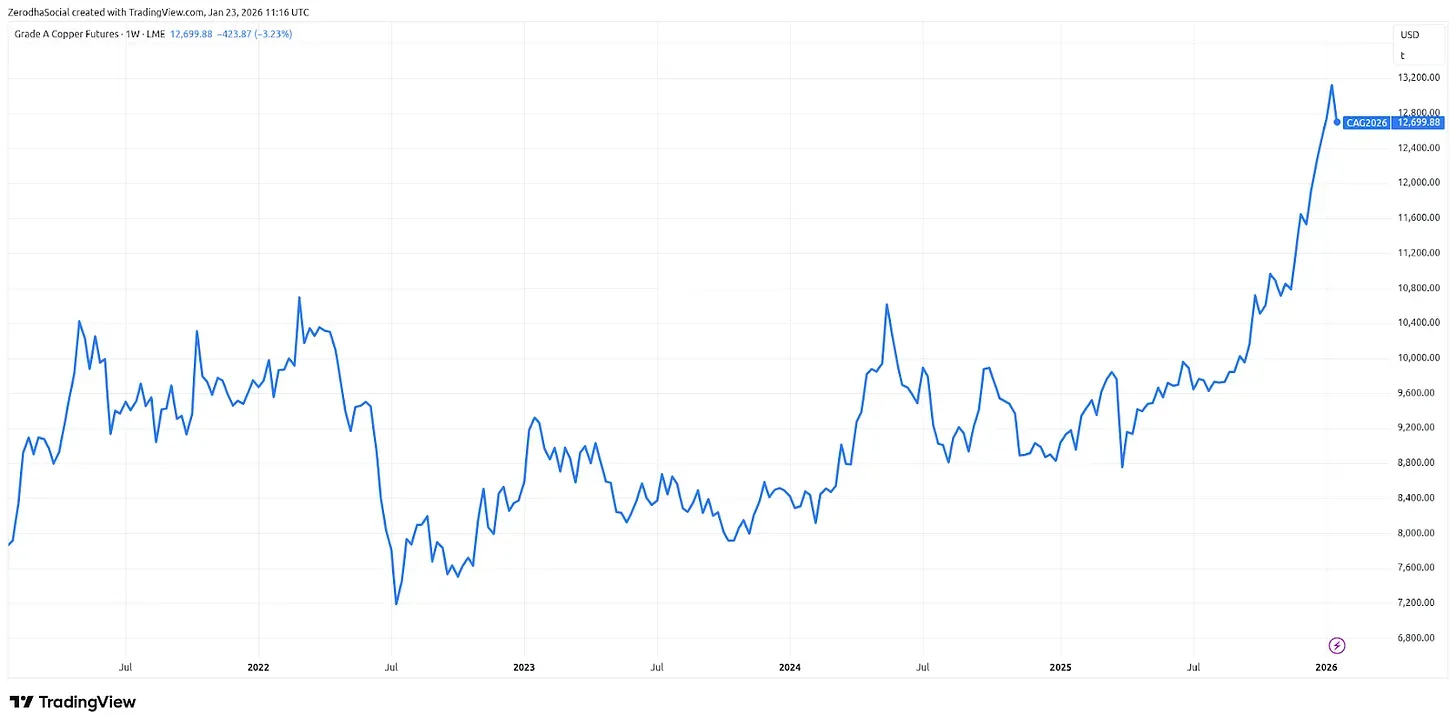
Copper’s price is reacting to the physical tightness signals,and it’s reacting fast. Benchmark reports that on January 6, 2026, LME cash copper reached almost $13,300/t, after first pushing above $13,000/t on January 5. And the rally didn’t stop there: The three-month LME copper price hit $14,527.50/t on Jan 29, 2026 (even if it didn’t hold the close), underscoring the volatility in a tight market.
The record surge to supply disruptions (including Grasberg and Chilean disruptions) and to tariff-driven stockpiling behavior in the U.S. Reuters similarly highlights how tariff uncertainty and shifting deliverable brands have pulled copper across oceans, distorting local premiums and confusing “inventory” signals.
At the same time, it’s fair to say “macro” can still whipsaw prices. Pullbacks in LME copper on risk-off sentiment and policy headlines even while longer-term supply stress persists. That’s exactly what a structural tightness regime looks like: the trend can be up, but the path is jagged because the market has little buffer.
In the near term, the market’s own official forecasters see refined tightness returning. ICSG expects the global refined copper market to move toward a ~150,000-tonne deficit in 2026, driven by slower refined production growth because concentrate availability remains tight. Importantly, ICSG notes China consumes ~58% of the world’s refined copper, which means China’s feed availability, smelter behavior, and policy choices increasingly set the global tone.
Mid-term, the core question is whether the project pipeline can be accelerated. The IEA’s warning is straightforward: under stated policies, announced copper mine projects imply a ~30% supply deficit by 2035. Closing a gap of that magnitude requires not just higher prices,it requires faster permitting, more stable investment frameworks, and fewer project failures and delays.
Long-term, the numbers turn “systemic.” S&P Global projects copper could fall ~10 million tonnes short of demand by 2040, explicitly describing shortages as a potential systemic risk as electrification, AI, and defense demand expand. Put plainly: even strong recycling growth helps, but it doesn’t eliminate the need for substantial new primary supply,because the demand expansion is large and persistent.
Copper’s “crisis” is best understood as a tight, fragile system facing structural demand growth. The hard numbers say it plainly: global refined production and usage were essentially neck-and-neck in 2024 (27.397 Mt vs 27.328 Mt) and global stocks are not large enough to comfortably absorb big shocks (1.399 Mt end-2024; 1.586 Mt end-Nov 2025).
The stress is also visible in the overall supply chain and the internal economics. TC/RC collapsing to $0/t in reported annual terms is not normal. It’s a signal that smelting capacity has outrun concentrate supply, and that the midstream is being squeezed hard enough to rely on by-products like sulphuric acid for profitability. That’s not sustainable if the by-product cycle turns.
Finally, the long-range outlook makes copper a strategic planning problem. The IEA’s ~30% implied deficit by 2035 under stated policies and S&P Global’s ~10 Mt shortfall by 2040 frame copper as a core constraint on electrification and AI infrastructure. The way out is not one silver bullet,it’s faster project timelines, more reliable supply execution, smarter midstream alignment, and a recycling ramp that helps but cannot replace new mines.

Chief Marketing & Growth Officer | Wright Research
Learn more about our Chief Marketing Officer, Siddharth Singh Bhaisora. Siddharth is a highly experienced investment advisor.
Discover investment portfolios that are designed for maximum returns at low risk.
Learn how we choose the right asset mix for your risk profile across all market conditions.
Get weekly market insights and facts right in your inbox

It depicts the actual and verifiable returns generated by the portfolios of SEBI registered entities. Live performance does not include any backtested data or claim and does not guarantee future returns.
By proceeding, you understand that investments are subjected to market risks and agree that returns shown on the platform were not used as an advertisement or promotion to influence your investment decisions.
"I was drawn to Wright Research due to its multi-factor approach. Their Balanced MFT is an excellent product."

By Prashant Sharma
CTO, Zydus
By signing up, you agree to our Terms and Privacy Policy
"I was drawn to Wright Research due to its multi-factor approach. Their Balanced MFT is an excellent product."
By Prashant Sharma
CTO, Zydus
Skip Password
By signing up, you agree to our Terms and Privacy Policy
"I was drawn to Wright Research due to its multi-factor approach. Their Balanced MFT is an excellent product."
By Prashant Sharma
CTO, Zydus
"I was drawn to Wright Research due to its multi-factor approach. Their Balanced MFT is an excellent product."
By Prashant Sharma
CTO, Zydus
Log in with Password →
By logging in, you agree to our Terms and Privacy Policy
"I was drawn to Wright Research due to its multi-factor approach. Their Balanced MFT is an excellent product."
By Prashant Sharma
CTO, Zydus
Log in with OTP →
By logging in, you agree to our Terms and Privacy Policy
"I was drawn to Wright Research due to its multi-factor approach. Their Balanced MFT is an excellent product."
By Prashant Sharma
CTO, Zydus
Answer these questions to get a personalized portfolio or skip to see trending portfolios.
Answer these questions to get a personalized portfolio or skip to see trending portfolios.
(You can choose multiple options)
Answer these questions to get a personalized portfolio or skip to see trending portfolios.
Answer these questions to get a personalized portfolio or skip to see trending portfolios.
Answer these questions to get a personalized portfolio or skip to see trending portfolios.
(You can choose multiple options)
Investor Profile Score
We've tailored Portfolio Management services for your profile.
View Recommended Portfolios Restart


