by Naman Agarwal
Published On Sept. 4, 2025
In the dynamic world of stock trading, understanding chart patterns can offer traders a solid edge in predicting market movements. Among these, the symmetrical triangle pattern stands out as a powerful technical formation that signals potential breakouts in trending markets. Particularly in the Indian stock markets, where volatility and market sentiment shift rapidly, mastering the trade of symmetrical triangles can enable precise entry and exit points, enhancing profitability.
A symmetrical triangle is a consolidation pattern that represents a market indecision phase where buyers and sellers are in balance. This pause often precedes a significant price movement either upward or downward, offering traders an opportunity to capitalize on the breakout. Unlike patterns that have a defined bullish or bearish implication, the symmetrical triangle is neutral, demanding careful analysis combined with volume and other technical indicators to predict the breakout direction. This article will guide Indian market traders through the essentials of identifying, understanding, and trading symmetrical triangles to leverage trending market conditions effectively.
A symmetrical triangle is a technical chart pattern formed by two converging trend lines one descending from the highs and one ascending from the lows that meet at an apex. This creates a triangular shape on the price chart, symbolizing a period where the price volatility compresses, and both buyers and sellers are equally active but uncertain about the next direction.
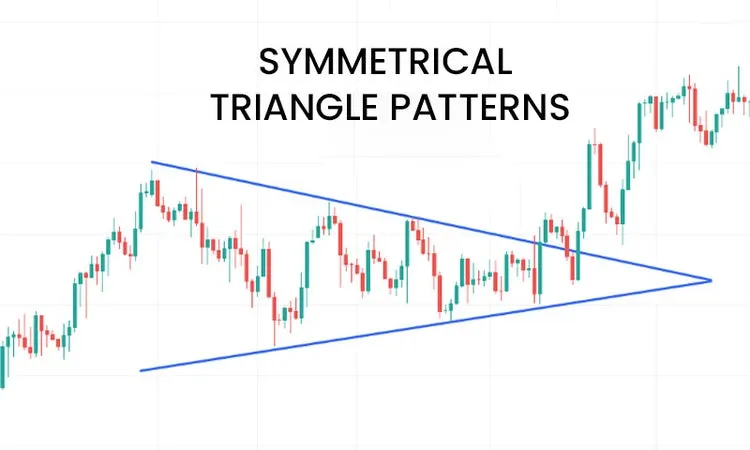
The pattern indicates a balance between supply and demand and reflects a phase where neither bulls nor bears dominate. Traders monitor this formation closely because it typically precedes a breakout, where that equilibrium is disrupted, followed by a strong price move. In the Indian markets, symmetrical triangles often occur during periods of market consolidation within broader trends.
To identify a symmetrical triangle on price charts, look for the following key characteristics:
Two converging trendlines: The upper trendline connects consecutive lower highs, whereas the lower trendline joins successive higher lows.
Price movement within the triangle narrows progressively as the pattern develops.
At least two highs and two lows that form the converging trendlines.
Volume typically decreases as the pattern forms, signifying lower volatility and market indecision.
The pattern can develop over weeks or months, so traders need patience to wait for the breakout.
In Indian market stocks like Maruti Suzuki or Bharti Airtel, this pattern has been observed during phases of consolidation before a major price movement, making it easier to spot when combined with trendlines and volume analysis.
Trading symmetrical triangle breakouts involves a systematic approach to capitalize on the potential breakout direction. Here are the core steps:
Wait for a Confirmed Breakout: Enter a trade only after the price closes beyond the upper or lower trendline on higher time frame charts.
Confirm Volume Spike: A genuine breakout is usually accompanied by a significant increase in volume, confirming the strength behind the move.
Set Price Targets: Measure the widest part of the triangle and project that distance from the breakout point to estimate the potential price target.
Stop-Loss Placement: Place stop-loss orders just inside the triangle, near the breakout point, to minimize risk if the breakout fails.
Use Additional Indicators: Combine with RSI, MACD, or On-Balance Volume (OBV) for extra confirmation.
For example, if a symmetrical triangle forms in an uptrend on NIFTY and the price breaks out with robust volume, taking a long position and setting a target based on the triangle’s height can be a profitable strategy.
Understanding the primary features of symmetrical triangles helps traders identify and trade them effectively:
Price consolidation with lower highs and higher lows.
Converging trendlines that meet at a point (apex).
Volume decline during the pattern’s formation followed by volume surge at breakout.
Neutral bias; breakout can be bullish or bearish.
Occurs in any timeframe, from intraday to monthly charts.
Breakouts usually signal continuation of the prior trend but can also indicate reversals.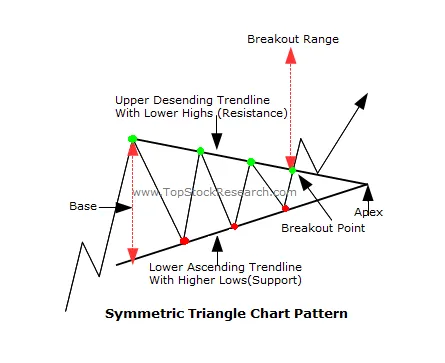
It’s essential to differentiate between symmetrical triangles and the other two popular triangle patterns: ascending and descending triangles. Each has unique characteristics and implications:
Symmetrical Triangle: Both trendlines slope towards each other; lower highs and higher lows.
Ascending Triangle: Flat upper trendline with rising lower trendline; higher lows and consistent highs.
Descending Triangle: Flat lower trendline with descending upper trendline; lower highs and consistent lows.
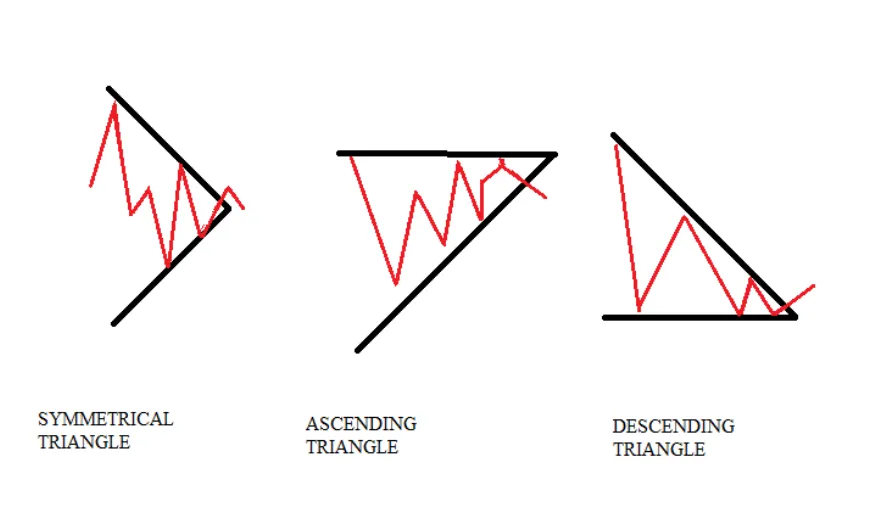
Symmetrical triangles usually form during periods of indecision and can appear mid-trend or in consolidations.
Ascending triangles often appear in uptrends and suggest bullish continuation.
Descending triangles generally show up in downtrends and signal bearish continuation.
Triangle Type | Trendline Formation | Typical Market Cycle | Breakout Direction Bias |
Symmetrical Triangle | Both trendlines slope towards each other | Consolidation in any trend | Neutral, either direction |
Ascending Triangle | Flat upper, rising lower | Uptrend continuation | Bullish |
Descending Triangle | Flat lower, descending upper | Downtrend continuation | Bearish |
A crucial element in trading symmetrical triangles is volume analysis. Volume behavior shows market psychology behind the pattern:
Volume fades during triangle formation as trading activity slows down with uncertainty.
Volume spikes sharply at breakout, signaling conviction behind the price move.
If the breakout happens on low volume, it could be a false breakout, leading to potential losses.
Traders use volume overlays or indicators like On-Balance Volume (OBV) to confirm the authenticity of the breakout.
In Indian markets, especially with volatile stocks, volume confirmation reduces risk and increases the likelihood of successful trades.
Symmetrical triangle patterns are valuable tools for traders in the Indian stock market to identify potential breakouts in trending markets. By mastering their identification, understanding characteristics, and using volume confirmation, traders can enhance their ability to execute informed and strategic trades.
While symmetrical triangles are neutral patterns, the breakout direction coupled with strong volume helps reveal probable price movements. Combining this pattern with sound risk management, stop-loss placement, and additional technical indicators makes it a powerful strategy for both intraday and swing traders.
Successful trading of symmetrical triangles demands patience and discipline to wait for breakout confirmation rather than guessing. By doing so, traders can maximize returns and mitigate risks in the dynamic environment of the Indian stock market.
Triangles, including symmetrical ones, do not inherently predict breakout direction as they are neutral patterns. The direction is confirmed only after the price breaks above or below the converging trendlines, ideally with volume confirmation.
An example is a stock forming lower highs and higher lows such that two trendlines drawn connect these points, converging to create a shape resembling a triangle—hence the name symmetrical triangle.
A symmetrical triangle itself is neutral and not inherently bullish or bearish. Its bias depends on the breakout direction, which can be upward (bullish) or downward (bearish).
A real breakout is confirmed by a closure beyond the triangle boundaries on higher time frames, accompanied by an increase in volume and sometimes supported by other technical indicators like RSI or MACD.
Yes. Volume usually decreases as the triangle forms, indicating consolidation and indecision. A spike in volume at breakout confirms the strength and authenticity of the price move.
Discover investment portfolios that are designed for maximum returns at low risk.
Learn how we choose the right asset mix for your risk profile across all market conditions.
Get weekly market insights and facts right in your inbox

It depicts the actual and verifiable returns generated by the portfolios of SEBI registered entities. Live performance does not include any backtested data or claim and does not guarantee future returns.
By proceeding, you understand that investments are subjected to market risks and agree that returns shown on the platform were not used as an advertisement or promotion to influence your investment decisions.
"I was drawn to Wright Research due to its multi-factor approach. Their Balanced MFT is an excellent product."

By Prashant Sharma
CTO, Zydus
By signing up, you agree to our Terms and Privacy Policy
"I was drawn to Wright Research due to its multi-factor approach. Their Balanced MFT is an excellent product."
By Prashant Sharma
CTO, Zydus
Skip Password
By signing up, you agree to our Terms and Privacy Policy
"I was drawn to Wright Research due to its multi-factor approach. Their Balanced MFT is an excellent product."
By Prashant Sharma
CTO, Zydus
"I was drawn to Wright Research due to its multi-factor approach. Their Balanced MFT is an excellent product."
By Prashant Sharma
CTO, Zydus
Log in with Password →
By logging in, you agree to our Terms and Privacy Policy
"I was drawn to Wright Research due to its multi-factor approach. Their Balanced MFT is an excellent product."
By Prashant Sharma
CTO, Zydus
Log in with OTP →
By logging in, you agree to our Terms and Privacy Policy
"I was drawn to Wright Research due to its multi-factor approach. Their Balanced MFT is an excellent product."
By Prashant Sharma
CTO, Zydus
Answer these questions to get a personalized portfolio or skip to see trending portfolios.
Answer these questions to get a personalized portfolio or skip to see trending portfolios.
(You can choose multiple options)
Answer these questions to get a personalized portfolio or skip to see trending portfolios.
Answer these questions to get a personalized portfolio or skip to see trending portfolios.
Answer these questions to get a personalized portfolio or skip to see trending portfolios.
(You can choose multiple options)
Investor Profile Score
We've tailored Portfolio Management services for your profile.
View Recommended Portfolios Restart


