by Naman Agarwal
Published On Sept. 11, 2025
Price action trading has gained immense popularity among Indian traders seeking to decode market movements without relying heavily on complex indicators. Among the most powerful price action signals is the rejection candle pattern, which reveals moments when the market attempts to move in one direction but gets firmly rejected by opposing forces. Understanding rejection candles can transform your trading approach, providing clear entry and exit signals while helping you identify key support and resistance levels. This comprehensive guide explores how to identify, analyze, and profit from rejection candle patterns in the dynamic Indian markets.
The rejection candle pattern represents one of the purest forms of market psychology visible on charts. When you see a candle with a long wick extending in one direction and a small body, you're witnessing a battle between buyers and sellers where one side ultimately prevailed. This visual representation of market sentiment makes rejection candles invaluable for timing entries, setting stop-losses, and understanding potential reversal points.
A rejection candle pattern occurs when price tests a particular level during a trading session but gets rejected, closing significantly away from that extreme. The pattern is characterized by long wicks or shadows extending in the direction of the rejection, with relatively small real bodies. These patterns demonstrate that while one group of market participants (bulls or bears) attempted to push prices in their favor, the opposing force was strong enough to reject that move.
The anatomy of a rejection candle consists of several key components. The wick or shadow represents the rejected price area, showing where the market briefly traveled but couldn't sustain. The body indicates the opening and closing relationship, which should be relatively small compared to the total range. The direction of the rejection wick tells us which side of the market was rejected.
Rejection candles are particularly significant because they occur at crucial market junctures. When price approaches important support or resistance levels, trend lines, moving averages, or psychological levels, rejection candles often form as these areas act as decision points for market participants. The longer the rejection wick relative to the body, the stronger the rejection signal becomes.
 How to Identify a Rejection Candle
Identifying rejection candles requires understanding their key characteristics and knowing where to look for them. The first characteristic is the wick-to-body ratio. A true rejection candle should have a wick that's at least twice the length of the real body, though stronger signals often show wicks three or four times longer than the body.
The location of the rejection is crucial. Rejection candles are most meaningful when they appear at significant price levels such as major support and resistance zones, trend lines, Fibonacci retracement levels, moving averages, or psychological round numbers. Random rejection candles in the middle of nowhere carry less weight than those occurring at these key levels.
The context of the rejection matters significantly. A rejection candle appearing after an extended move in one direction carries more weight than one occurring during sideways consolidation. Similarly, rejection candles at the end of pullbacks in trending markets often signal continuation opportunities.
Volume analysis enhances rejection candle identification. Higher volume during the formation of a rejection candle suggests more conviction behind the rejection, making the signal more reliable. Conversely, rejection candles formed on light volume may indicate less commitment from market participants.
The color of the rejection candle body can provide additional insight. While both green and red rejection candles can be valid, the color that aligns with the rejection direction typically provides stronger signals. For example, a rejection of higher prices (long upper wick) accompanied by a red body suggests stronger bearish sentiment than if the same rejection had a green body.
Several specific candlestick patterns fall under the rejection candle category, each with unique characteristics and implications. Understanding these variations helps traders identify the most suitable trading opportunities.
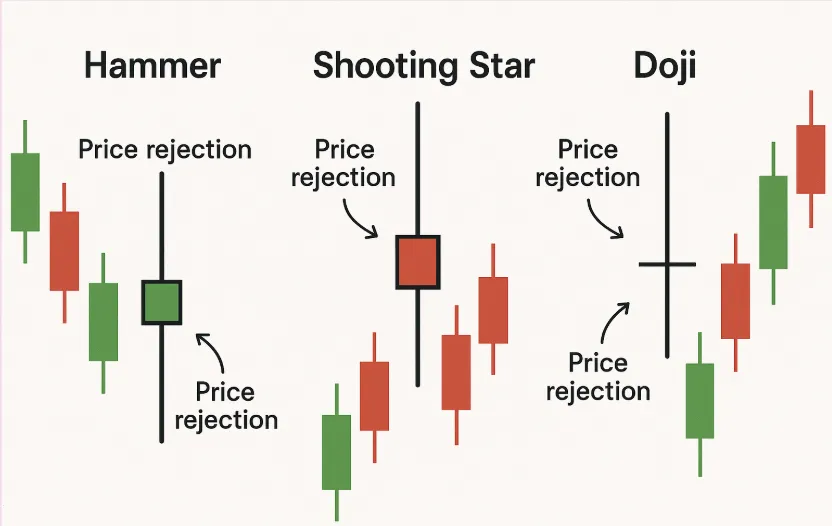
The Hammer represents a bullish rejection pattern that appears during downtrends. It features a small body at the upper end of the trading range with a long lower wick, indicating rejection of lower prices. The hammer suggests that sellers pushed prices down during the session, but buyers stepped in aggressively, rejecting the lower levels and closing near the session highs.
The Shooting Star is the bearish counterpart to the hammer, appearing during uptrends. It displays a small body at the lower end with a long upper wick, showing rejection of higher prices. This pattern indicates that buyers initially pushed prices higher, but sellers entered aggressively, rejecting the higher levels and forcing a close near session lows.
The Inverted Hammer appears during downtrends but, unlike the regular hammer, has a long upper wick and small body. While it shows rejection of higher prices, its appearance at the bottom of a downtrend can signal potential bullish reversal as it indicates buyers are testing higher levels.
The Hanging Man looks identical to a hammer but appears during uptrends. Despite its hammer-like appearance, its location at the top of an uptrend gives it bearish implications, suggesting potential weakness as sellers test lower levels.
Doji variations with long wicks also qualify as rejection patterns. The Dragonfly Doji shows rejection of lower prices with its long lower wick, while the Gravestone Doji demonstrates rejection of higher prices with its extended upper wick.
Pin bars represent another category of rejection candles, characterized by very small bodies and prominent wicks extending in one direction. These patterns are particularly popular among price action traders for their clear visual representation of rejection.
Successful trading of rejection candle patterns requires systematic approach combining pattern recognition with proper risk management and market context analysis. The foundation of any rejection candle strategy lies in waiting for confirmation rather than jumping into trades immediately upon pattern formation.
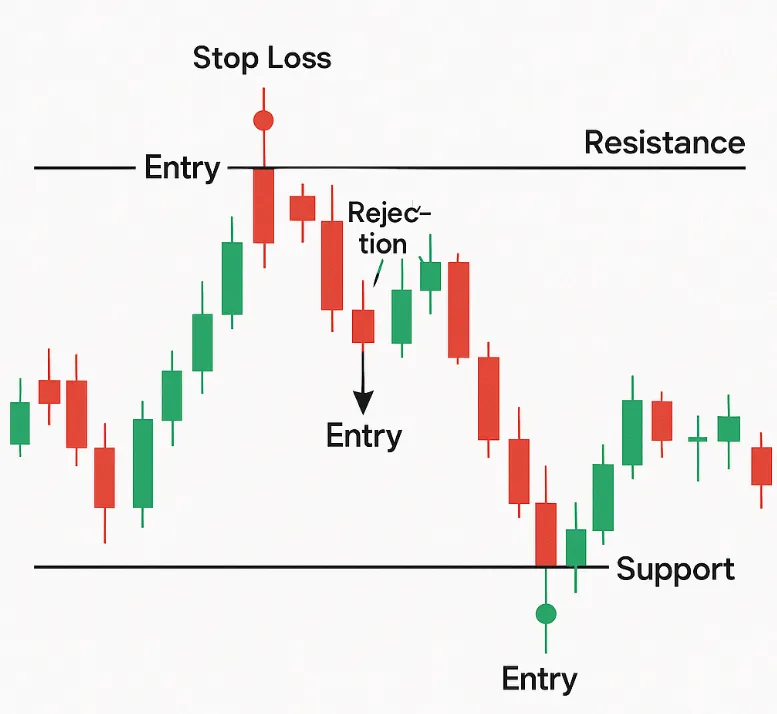
Entry Strategy: The most conservative approach involves waiting for the next candle to confirm the rejection. For bullish rejection candles like hammers, traders wait for the subsequent candle to close above the rejection candle's high before entering long positions. For bearish rejection patterns like shooting stars, confirmation comes when the next candle closes below the rejection candle's low.
Aggressive Entry: More experienced traders might enter during the formation of the rejection candle itself, particularly when trading intraday timeframes. This approach requires real-time monitoring and quick decision-making but can provide better risk-reward ratios.
Stop-Loss Placement: Stop-losses should be placed beyond the rejection wick, providing a buffer for normal market fluctuations. For bullish rejection patterns, stops go below the low of the rejection wick. For bearish patterns, stops are placed above the high of the rejection wick. The distance should account for the instrument's average volatility and market conditions.
Target Setting: Profit targets can be determined using multiple approaches. Technical traders often target the next significant support or resistance level, while others use risk-reward ratios of 2:1 or 3:1. Fibonacci extensions and measured moves from the rejection point also provide logical target areas.
Market Context Integration: Successful rejection candle trading considers broader market context. In trending markets, traders focus on rejection candles in the direction of the trend during pullbacks. In ranging markets, rejection candles at range extremes offer higher probability trades.
Indicator Confluence: While rejection candles are powerful standalone signals, combining them with technical indicators enhances success rates. RSI divergences, MACD crossovers, or moving average interactions occurring alongside rejection patterns provide additional confirmation.
Timeframe Analysis: Multiple timeframe analysis strengthens rejection candle trades. A rejection candle on a daily chart carries more weight when supported by similar patterns on weekly charts or when intraday timeframes show detailed rejection action.
Understanding rejection candle patterns becomes clearer through real market examples that demonstrate both successful implementations and potential pitfalls. These examples illustrate how market context, timing, and execution affect trading outcomes.
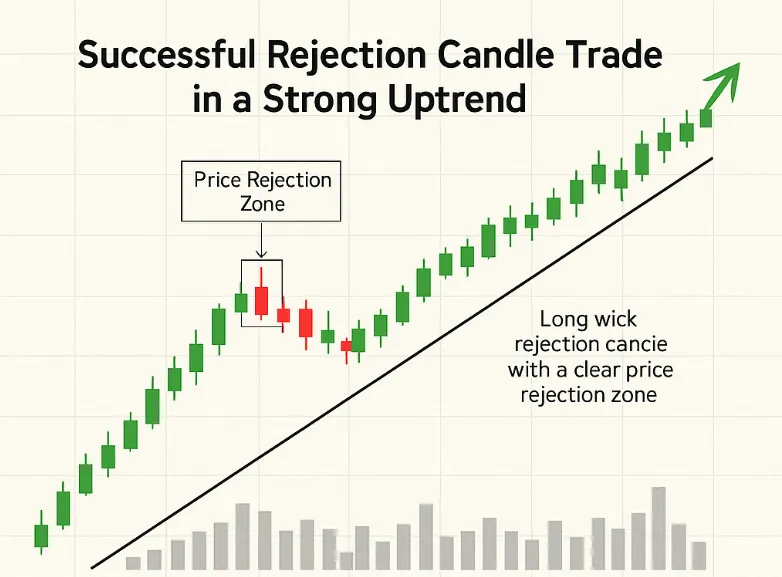
Successful Example - Nifty Support Bounce: Consider a scenario where Nifty approaches a major support level after a prolonged decline. A hammer formation appears with a long lower wick extending well below the support zone, followed by a small body closing near the session highs. The subsequent candle opens higher and closes above the hammer's high, providing confirmation. Traders entering long positions after confirmation with stops below the hammer's low capture a significant bounce as the index rallies back toward resistance levels.
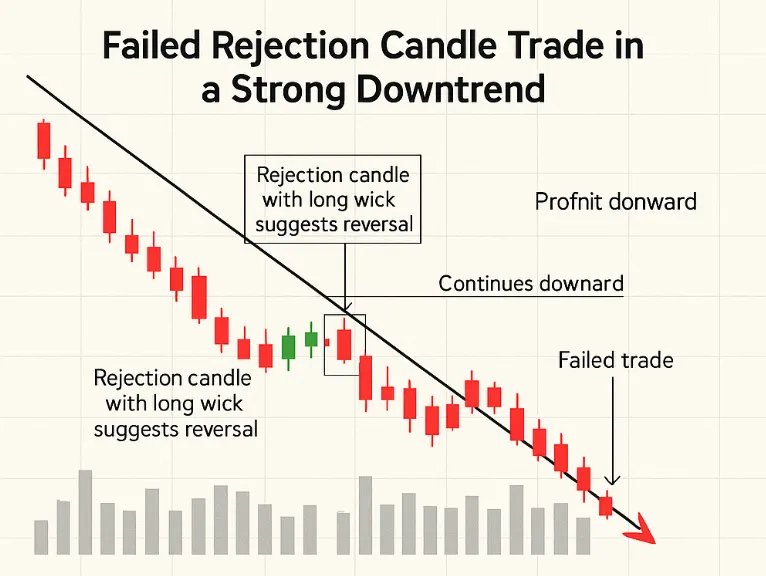
Failed Example - False Rejection: Not all rejection candles lead to successful trades. Consider a hammer appearing at what seems like support during a downtrend. However, the broader market context shows continued selling pressure, and the rejection candle forms on relatively light volume. Despite initial confirmation with a higher close the next day, the rally fails quickly, and prices break below the hammer's low within a few sessions. This example highlights the importance of considering market context and volume confirmation.
Complex Example - Multiple Rejections: Sometimes, multiple rejection candles appear in sequence, creating confusion for traders. In a ranging market, both hammers at support and shooting stars at resistance might form repeatedly. Successful navigation requires patience to wait for the clearest setups and proper position sizing to handle multiple small losses while capturing significant moves when range breaks occur.
These examples demonstrate that while rejection candles provide valuable signals, successful trading requires comprehensive analysis including market context, volume confirmation, and proper risk management. The pattern's location, the strength of the rejection (wick length), and subsequent price action all contribute to trade success or failure.
The rejection candle pattern represents one of the most reliable and visually clear trading signals available to price action traders. Its ability to capture market psychology at crucial turning points makes it invaluable for Indian traders navigating volatile markets. However, success with rejection candles requires more than pattern recognition; it demands understanding of market context, proper risk management, and patience to wait for high-probability setups.
The key to mastering rejection candle trading lies in focusing on quality over quantity. Rather than trading every rejection pattern that appears, successful traders concentrate on those occurring at significant levels with proper confirmation and favorable risk-reward profiles. This selective approach, combined with solid money management principles, can transform rejection candles from mere chart patterns into consistent profit opportunities.
As Indian markets continue evolving with increased retail participation and algorithmic trading, rejection candles remain relevant because they reflect fundamental market dynamics that persist regardless of technological advances. The battle between buyers and sellers, fear and greed, support and resistance - these elements continue creating the rejection patterns that observant traders can exploit.
Remember that rejection candles work best as part of a comprehensive trading strategy rather than standalone signals. Combine them with sound market analysis, proper position sizing, and disciplined execution to maximize their effectiveness in your trading arsenal.
No, rejection candles can be either bullish or bearish depending on the direction of rejection and market context. A hammer showing rejection of lower prices is bullish, while a shooting star showing rejection of higher prices is bearish. The key is understanding what price level is being rejected and the surrounding market conditions.
Rejection candles are among the more reliable candlestick patterns, especially when they appear at significant support or resistance levels with volume confirmation. However, like all technical patterns, they're not infallible and work best when combined with proper market context analysis and risk management. Success rates improve significantly when rejection candles align with other technical factors.
Yes, beginners can learn to trade rejection candles, but they should start with demo accounts and focus on the most obvious patterns at major levels. The visual nature of rejection candles makes them easier to identify than many other patterns. However, beginners must emphasize risk management and avoid trading every rejection candle they see.
Rejection candles work across all timeframes, but higher timeframes generally provide more reliable signals. Daily and weekly rejection candles carry more weight than intraday patterns. However, intraday traders can successfully use hourly and 4-hour rejection candles for shorter-term trades. The key is maintaining consistency in timeframe analysis.
Rejection candles can be particularly effective in volatile markets because volatility often creates clear wicks showing rejection at key levels. However, traders must adjust their stop-loss distances to account for increased volatility and be more selective about which patterns to trade. High volatility can also create false rejection signals, making confirmation even more important.
Discover investment portfolios that are designed for maximum returns at low risk.
Learn how we choose the right asset mix for your risk profile across all market conditions.
Get weekly market insights and facts right in your inbox

It depicts the actual and verifiable returns generated by the portfolios of SEBI registered entities. Live performance does not include any backtested data or claim and does not guarantee future returns.
By proceeding, you understand that investments are subjected to market risks and agree that returns shown on the platform were not used as an advertisement or promotion to influence your investment decisions.
"I was drawn to Wright Research due to its multi-factor approach. Their Balanced MFT is an excellent product."

By Prashant Sharma
CTO, Zydus
By signing up, you agree to our Terms and Privacy Policy
"I was drawn to Wright Research due to its multi-factor approach. Their Balanced MFT is an excellent product."
By Prashant Sharma
CTO, Zydus
Skip Password
By signing up, you agree to our Terms and Privacy Policy
"I was drawn to Wright Research due to its multi-factor approach. Their Balanced MFT is an excellent product."
By Prashant Sharma
CTO, Zydus
"I was drawn to Wright Research due to its multi-factor approach. Their Balanced MFT is an excellent product."
By Prashant Sharma
CTO, Zydus
Log in with Password →
By logging in, you agree to our Terms and Privacy Policy
"I was drawn to Wright Research due to its multi-factor approach. Their Balanced MFT is an excellent product."
By Prashant Sharma
CTO, Zydus
Log in with OTP →
By logging in, you agree to our Terms and Privacy Policy
"I was drawn to Wright Research due to its multi-factor approach. Their Balanced MFT is an excellent product."
By Prashant Sharma
CTO, Zydus
Answer these questions to get a personalized portfolio or skip to see trending portfolios.
Answer these questions to get a personalized portfolio or skip to see trending portfolios.
(You can choose multiple options)
Answer these questions to get a personalized portfolio or skip to see trending portfolios.
Answer these questions to get a personalized portfolio or skip to see trending portfolios.
Answer these questions to get a personalized portfolio or skip to see trending portfolios.
(You can choose multiple options)
Investor Profile Score
We've tailored Portfolio Management services for your profile.
View Recommended Portfolios Restart


