On February 28, 2026, the United States and Israel launched joint military strikes against Iran under Operation Epic Fury. Iran retaliated with missile and drone strikes on U.S. and Israeli targets, as well as on Gulf states hosting U.S. forces. Within days, the conflict shut down tanker traffic through the Strait of Hormuz, the narrow waterway through which approximately 20% of global seaborne oil and LNG supply transits daily. The International Energy Agency has described this as the largest supply disruption in the history of the global oil market.
The market reaction was immediate. Brent crude oil rose from $72.48 on February 27 to above $112 by late March, a gain of over 55% in a single month. This marked the largest monthly increase for Brent since the contract’s inception in 1988. U.S. West Texas Intermediate crude gained approximately 53% over the same period. At its peak, Brent briefly touched $119 per barrel, while the Dubai physical delivery price, which tracks actual cargo from the Middle East, surged 76% to $126, reflecting the severity of the physical supply disruption.
U.S. gasoline prices crossed $4 per gallon for the first time since 2022. In California, prices exceeded $5 per gallon during the second week of March. The Energy Information Administration projected that crude prices would remain above $95 per barrel for at least two months, with retail gasoline prices averaging $3.34 per gallon for the year and spiking approximately 60–70 cents higher in the spring months.
The disruption extends beyond crude oil. Iranian strikes hit Qatar’s Ras Laffan LNG complex on March 18, causing a 17% reduction in Qatar’s LNG production capacity. Repairs are estimated to take 3–5 years. LNG spot prices in Asia increased by over 140%. Fertiliser prices rose by up to 40% because energy costs account for roughly 70% of production costs for urea and ammonia. Global helium supply, critical for semiconductor manufacturing, MRI machines, and aerospace was also constrained, as Gulf states are major producers.
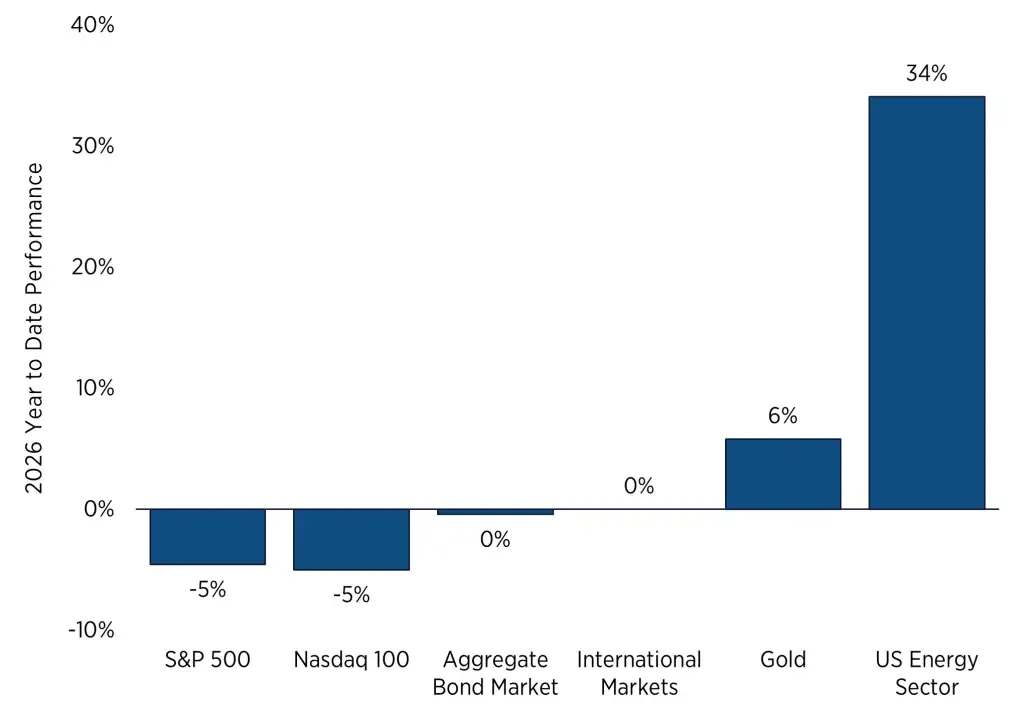
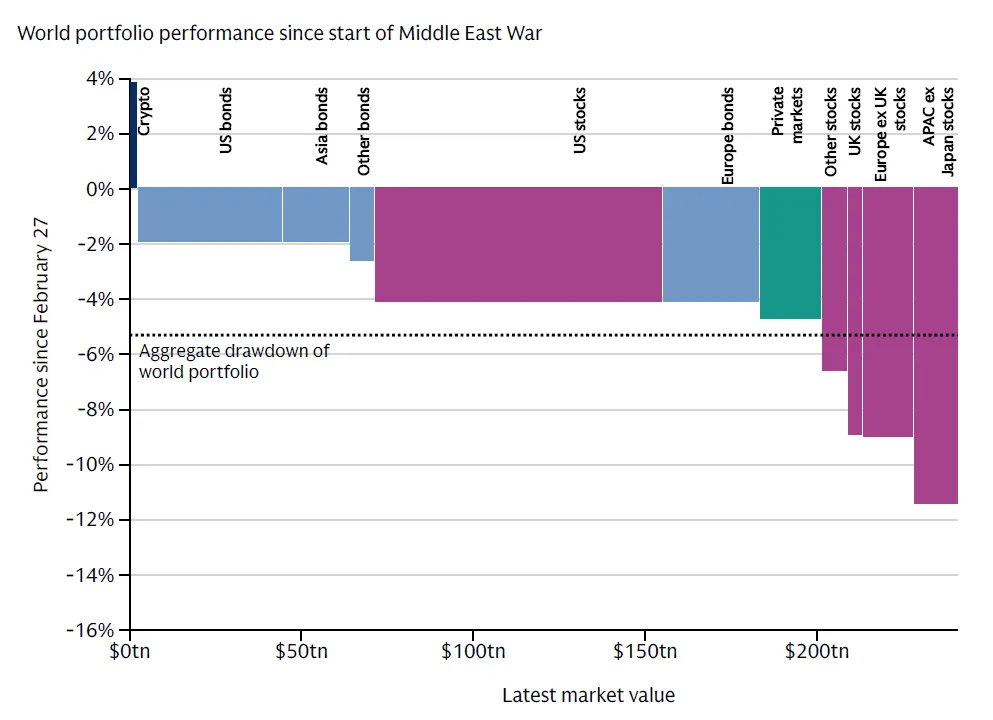
Stock markets have declined but not collapsed. The S&P 500 logged its worst single day since the war began in mid-March, and the Nasdaq 100 entered correction territory. However, the aggregate drawdown of the global investable portfolio, estimated at $300 trillion across all asset classes has been approximately -5% since the start of the conflict. For a standard 60/40 portfolio (60% S&P 500 equities, 40% 10-year U.S. Treasury bonds), losses have been described by analysts as relatively modest compared to the 2022 drawdown.
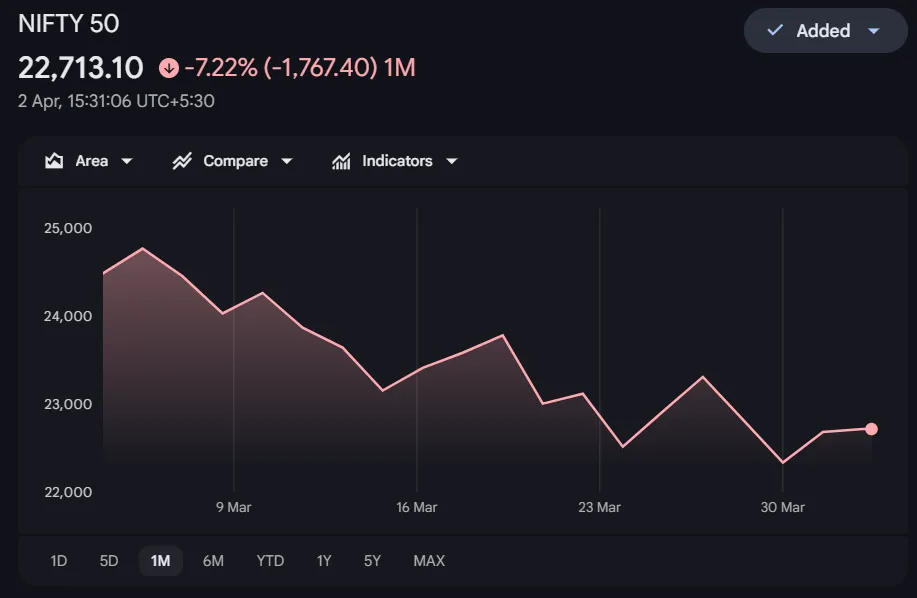
India’s benchmark Nifty 50 fell more than 10% in March, with foreign institutional investors selling over $12 billion in Indian equities during the month, the worst monthly sell-off on record. Indian benchmark indices have dropped more than 12% since January, with most of the decline concentrated in the weeks since the war began. The Nifty 50’s price-to-earnings ratio has fallen to 19.6 times, a level seen only twice in the past decade: during the early months of the Covid-19 pandemic in 2020 and the Russia-Ukraine war in 2022.
There are 2 reasons equities have held up. First, macroeconomic conditions entering 2026 were strong. GDP tracking estimates were above 3%, supported by the fiscal effects of the Big Beautiful Bill, and the global economy was in the middle of a cyclical acceleration. Markets went from optimistic to less optimistic but have not turned outright bearish. Second, investors are cautious about over-reacting. The Liberation Day tariff shock earlier in the year saw markets aggressively reprice growth, only for a policy reversal to trigger a sharp rebound. That experience has made portfolio managers reluctant to sell aggressively into geopolitical volatility.
The bond market tells a different story. Short-term yields have spiked sharply as markets price in higher near-term inflation from the energy shock. The 10-year US Treasury yield jumped to 4.46% on March 27, its highest level since July 2025. The 30-year mortgage rate climbed to 6.38% by March 26. The rate shock has been concentrated in the front end of the curve; longer-dated bond moves have been more contained than during the 2022 inflation surge. The critical difference is the starting point: real yields for longer-term government bonds were already at approximately 2%, compared with negative 100 basis points in early 2022 before the Russia-Ukraine shock.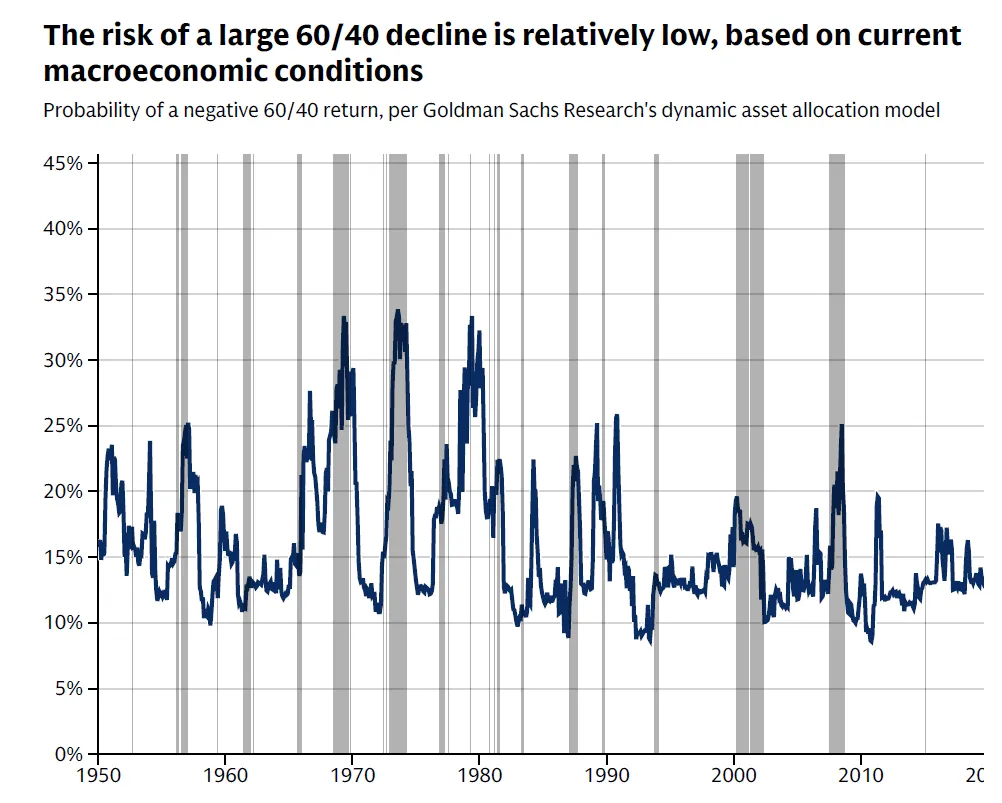
The problem for traditional portfolios is that when inflation is the primary risk, stocks and bonds can decline together, eliminating the diversification benefit that 60/40 allocations are designed to provide. During one session in late March, the S&P 500, Treasury bonds, and gold all fell simultaneously, a correlation breakdown that exposed the limits of conventional portfolio construction after 15 years of tech-driven returns.
India is particularly vulnerable to this conflict. The country imports approximately 85% of its crude oil needs, and roughly half of those imports transit through the Strait of Hormuz. The closure of this waterway has directly amplified energy costs, widened the current-account deficit, and put upward pressure on inflation across the Indian economy.
The equity market impact has been severe. Multiple global brokerages have downgraded their outlook. Goldman Sachs estimates that a 20% rise in Brent crude prices would cut earnings across the Asian region by 2%, with Indian companies among the most affected. Société Générale expects India’s underperformance relative to global peers to deepen given its high dependence on imported energy, while Natixis has labelled Indian assets as the “most at risk” in the region. Nomura cut its year-end Nifty 50 target by 15%, and Citi lowered its forecast to 27,000 from 28,500, both citing the impact of surging oil prices and supply shocks from the Middle East.
The fiscal response has been costly. The Indian government cut central excise duties on petrol and diesel by 10 rupees per litre to prevent pump prices from surging further. Petroleum Minister Hardeep Singh Puri acknowledged this would be a significant hit to government tax revenue. Analysts at Nomura estimated the annual fiscal impact of this cut at approximately 1.65 trillion rupees ($17.6 billion). The diversion of government spending from productive capital expenditure toward subsidies sends a negative signal to foreign investors and risks widening the fiscal deficit.
The sectoral impact within India has been uneven. Defence stocks, including Hindustan Aeronautics Limited and Bharat Dynamics, have surged on the back of an emergency procurement announcement of approximately ₹80,000 crore ($9.5 billion). Upstream oil producers like ONGC have benefited from higher crude prices. Gold has also attracted strong domestic demand.
On the other side, aviation stocks such as IndiGo and SpiceJet have come under heavy pressure from rising jet fuel costs, and automakers like Maruti face margin compression from higher input costs. Paint manufacturers, for whom crude-linked derivatives account for 20–25% of input costs, are also exposed if oil prices remain elevated.
The IPO market has effectively frozen. PhonePe halted its listing plans in mid-March, and overall fundraising activity has slowed sharply as investor appetite has evaporated. Pharmaceutical exports to West Asia and North Africa, worth approximately $1.75 billion annually, face disruptions from higher logistics costs and rerouting of shipping. Over 220,000 Indian nationals have been repatriated from Gulf Cooperation Council states, creating a reverse migration trend that is redirecting capital and labour toward Tier-2 and Tier-3 Indian cities.
The rupee has weakened as demand for U.S. dollars rises to pay for costlier oil imports. A weaker rupee feeds back into inflation, creating a cycle that constrains the Reserve Bank of India’s ability to cut interest rates. For Indian investors, the combination of foreign capital outflows, rupee depreciation, energy-driven inflation, and earnings downgrades has created a challenging environment in the near term. However, historical patterns suggest that geopolitical shocks in the Indian market have been followed by strong recoveries over the past 3 decades, the Sensex has averaged approximately 28% returns within three months of comparable corrections and 38% within six months.
The conflict has revived concerns about stagflation, the combination of rising inflation and slowing economic growth. Higher energy prices feed into headline inflation, compress consumer spending power, increase input costs across energy-intensive industries, and weigh on corporate profit margins. Global economists have downgraded growth forecasts and upgraded inflation expectations across virtually every major economy.
Federal Reserve officials now appear to see the first 2026 rate cut pushed to the third quarter at the earliest. The complication is that the standard policy tool for fighting inflation are higher interest rates which can slow growth further. This limits central bank flexibility at a time when the economy needs both lower prices and sustained demand.
The oil price shock is comparable in magnitude to the 2022 Ukraine-war energy shock, which ultimately delivered a 25% drawdown in equity markets over its full arc. However, the 2022 disruption was sanctions-driven and could be managed through rerouting and substitution. The 2026 disruption involves a physical chokepoint closure. Analysts estimate the world has lost 4.5–5 million barrels per day of oil supply due to the war, amounting to roughly 5% of global supply. That figure is projected to double by mid-April as strategic petroleum reserves and temporary supply exemptions are depleted.
Energy equities and commodities have appreciated sharply. Defence stocks surged in the first days of the conflict. Gold climbed above $5,400 per ounce as investors sought safety, although it has since pulled back as central banks raised short-term rates in response to inflation risk.
Infrastructure assets with real cash-flow growth potential have attracted interest. These benefit from two converging forces: increased inflation and inflation volatility supporting their relative valuations, and growing concerns about AI-driven disruption to software incumbents pushing capital toward heavy assets, low obsolescence. U.S. and Asian bonds have held up in positive territory.
The worst-performing asset classes since February 27 have been APAC ex-Japan equities, European ex-UK equities, and UK equities, all heavily exposed to energy import costs. Asia appears most vulnerable to the supply disruption given its dependence on Gulf hydrocarbon imports. Europe also faces meaningful exposure.
The baseline expectation among major investment banks is that markets will eventually recover. The probability of a sustained 60/40 decline remains relatively low by historical standards because growth, while downgraded, has not collapsed, inflation has not become fully unanchored, and policy easing continues. Machine-learning models tracking the likelihood of negative 12-month 60/40 returns remain at moderate levels.
However, the uncertainty around that baseline is high, and the recommended approach is to build portfolio robustness now, before the market fully prices in growth risk or higher long-term inflation expectations. The framework suggested by several research desks is to split portfolio allocation roughly into thirds: one-third in innovation-exposed assets (equities tied to technology and AI, but with greater selectivity given disruption risk), one-third in inflation-protection assets (real assets, gold, inflation-linked bonds, shorter-duration value stocks such as infrastructure), and one-third in risk-mitigation assets (bonds, defensive equity styles such as low-volatility and quality equities, select safe-haven currencies, and alternatives).
Within equities, the sectors with structural tailwinds include defence, security, aerospace, and industrial resilience, where government spending can drive multi-year demand regardless of the war’s duration. Gold remains a medium-term diversifier for both inflation and foreign-currency risk, as the dollar strength seen during the conflict is expected to reverse over time. Inflation-linked bonds, particularly medium-term maturities, offer opportunities where real yields have risen but inflation expectations have not yet caught up.
The direct fiscal costs are substantial. U.S. military expenditure on the conflict is estimated at $18–25 billion to date, with a $200 billion Congressional supplemental request pending. Israel has spent approximately $6.4 billion. The U.S. has ordered the release of 172 million barrels from the Strategic Petroleum Reserve, part of a coordinated 400-million-barrel global release, the largest in history.
The strategic cost is less quantifiable but potentially larger. Every carrier group, intelligence analyst, and logistical chain committed to the Middle East is a resource unavailable for the Indo-Pacific. This matters because the long-term competitive challenge for the United States is in Asia, not the Gulf. The concern is that prolonged engagement in the Middle East depletes military readiness and strategic capital at the expense of posture in the Taiwan Strait and broader competition with China.
Across 40 major geopolitical events spanning 85 years, the S&P 500 has lost an average of 0.9% in the first month but recovered to gain 3.4% over the subsequent six months.
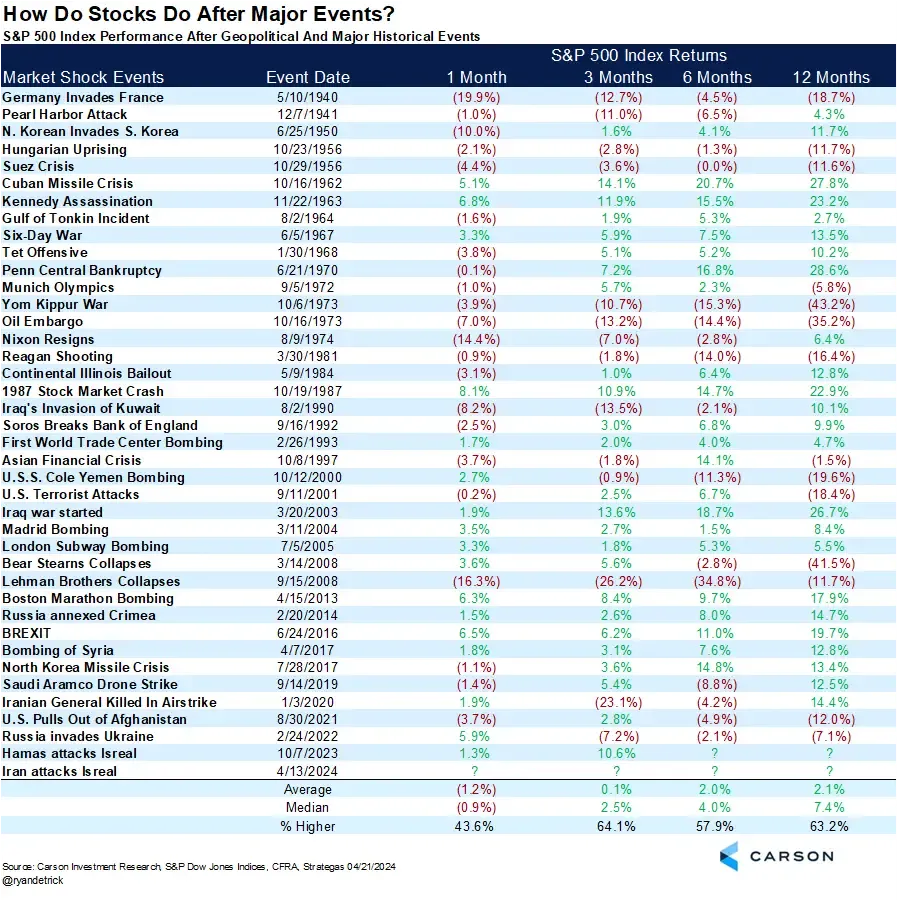
Markets have historically posted gains during wartime, including double-digit increases during both Gulf Wars within 3 to 6 months of the onset. The defence sector has typically led during these periods.
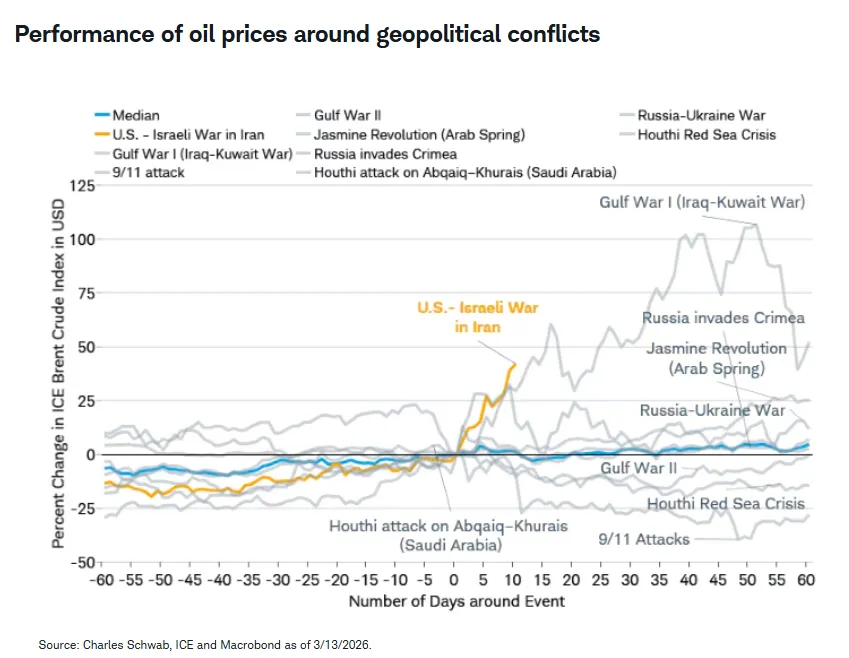
The critical variable is duration. A short, contained conflict that reopens the Strait of Hormuz would allow energy prices to normalise relatively quickly, enabling equity and bond markets to recover. A prolonged conflict that keeps the Strait closed into mid-April and beyond would trigger a second, more severe wave of supply disruption as strategic reserves are exhausted and shut-in production capacity degrades. In that scenario, a recession becomes a credible risk rather than a tail event, and portfolio losses would deepen materially.
The investors most harmed by geopolitical crises have historically been those who sold into the downturn and missed the recovery. For portfolios that were properly constructed before the conflict by being diversified across asset classes, sized to time horizon, and not dependent on short-term liquidity, the historical evidence favours staying the course. For those with near-term liquidity needs or concentrated equity exposure, this is the time to review and stress-test, not to react.
Discover investment portfolios that are designed for maximum returns at low risk.
Learn how we choose the right asset mix for your risk profile across all market conditions.
Get weekly market insights and facts right in your inbox

It depicts the actual and verifiable returns generated by the portfolios of SEBI registered entities. Live performance does not include any backtested data or claim and does not guarantee future returns.
By proceeding, you understand that investments are subjected to market risks and agree that returns shown on the platform were not used as an advertisement or promotion to influence your investment decisions.
"I was drawn to Wright Research due to its multi-factor approach. Their Balanced MFT is an excellent product."

By Prashant Sharma
CTO, Zydus
By signing up, you agree to our Terms and Privacy Policy
"I was drawn to Wright Research due to its multi-factor approach. Their Balanced MFT is an excellent product."
By Prashant Sharma
CTO, Zydus
Skip Password
By signing up, you agree to our Terms and Privacy Policy
"I was drawn to Wright Research due to its multi-factor approach. Their Balanced MFT is an excellent product."
By Prashant Sharma
CTO, Zydus
"I was drawn to Wright Research due to its multi-factor approach. Their Balanced MFT is an excellent product."
By Prashant Sharma
CTO, Zydus
Log in with Password →
By logging in, you agree to our Terms and Privacy Policy
"I was drawn to Wright Research due to its multi-factor approach. Their Balanced MFT is an excellent product."
By Prashant Sharma
CTO, Zydus
Log in with OTP →
By logging in, you agree to our Terms and Privacy Policy
"I was drawn to Wright Research due to its multi-factor approach. Their Balanced MFT is an excellent product."
By Prashant Sharma
CTO, Zydus
Answer these questions to get a personalized portfolio or skip to see trending portfolios.
Answer these questions to get a personalized portfolio or skip to see trending portfolios.
(You can choose multiple options)
Answer these questions to get a personalized portfolio or skip to see trending portfolios.
Answer these questions to get a personalized portfolio or skip to see trending portfolios.
Answer these questions to get a personalized portfolio or skip to see trending portfolios.
(You can choose multiple options)
Investor Profile Score
We've tailored Portfolio Management services for your profile.
View Recommended Portfolios Restart


