


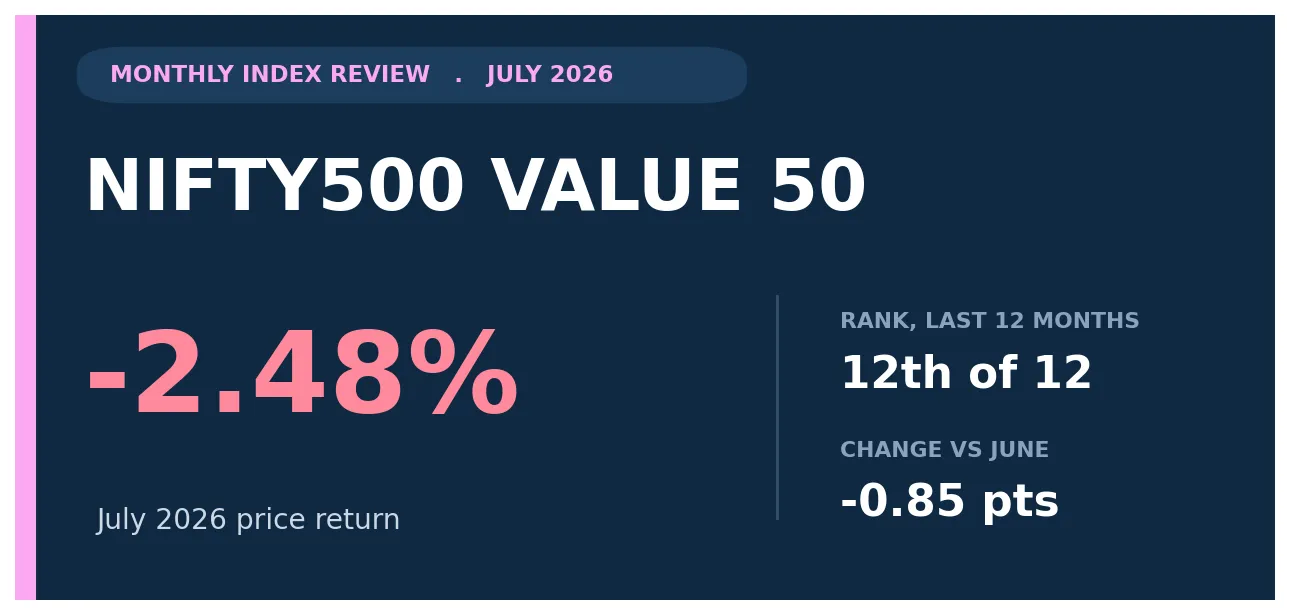
The Nifty500 Value 50 fell -2.48% in July 2026. The Nifty500 Value 50 , a factor index of 50 Nifty 500 stocks selected on value metrics, lost ground in a month when the large cap Nifty 50 rose 1.09%, so the reading below is set against both its own history and the broad market.
This review covers what the -2.48% move meant in context: where July ranked within the past year, how it read against the Nifty 50 and the Sensex, how it compared with June, and how it fits the record of July outcomes for this index. Every figure is drawn from the monthly returns history of the Nifty500 Value 50. A single month rarely settles a trend, but it shows whether the recent direction is being confirmed or challenged.
What Was the Nifty500 Value 50's Return in July 2026?
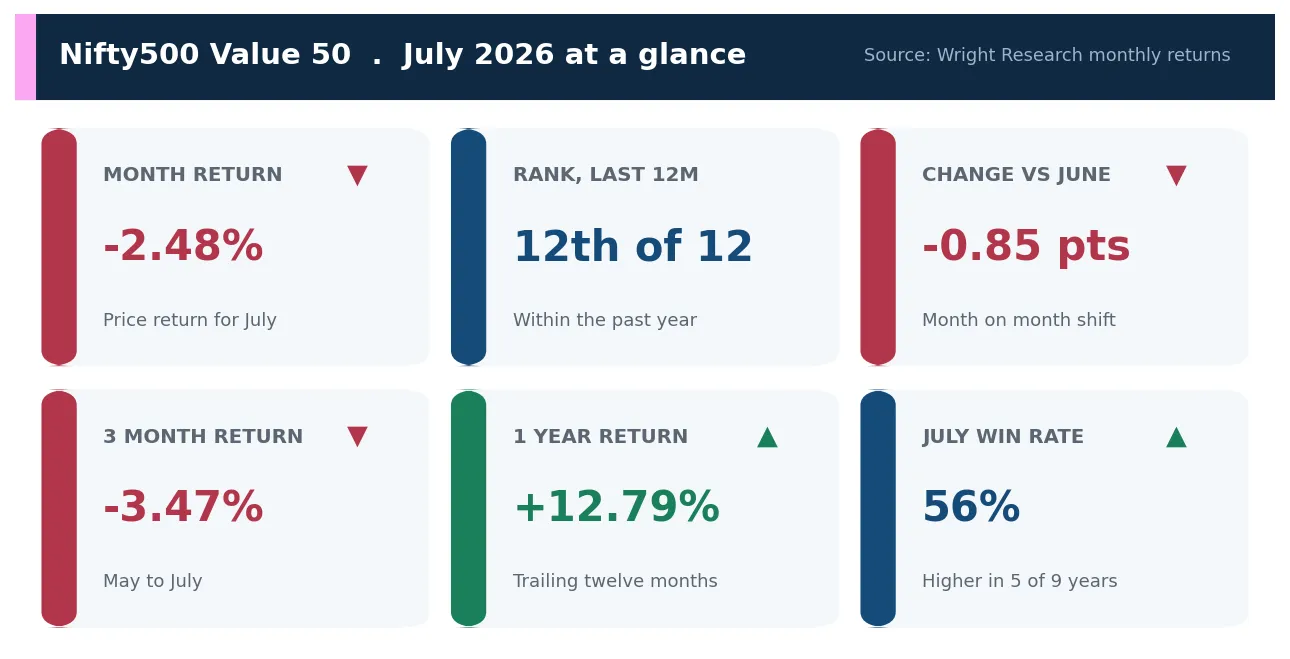
The Nifty500 Value 50 delivered a price return of -2.48% in July 2026. Within the trailing 12 months, from August 2025 through July 2026, that reading ranked 12th of twelve. The trailing 12 month average monthly return worked out to about +1.04%, so July sat below the average month of the past year.
The size of the move matters alongside its direction. At -2.48%, July was a down month that subtracted from the index. The rank within the past year shows how the month compared with the recent run of returns rather than with the long term trend, which the trailing and history sections below address. On a total return basis the figure would differ once dividends are added, though the monthly history used here is measured on price return.
Because the Nifty500 Value 50 is a rules based index, its monthly return reflects the combined move of its constituents rather than any single stock. A month like July therefore captures how the whole basket behaved. The Nifty500 Value 50 sits toward the value factor end of the market, so its month tends to move more with rotation toward cheaper value oriented stocks than with the broad large cap average. Reading July through that lens explains why its return can differ from the headline index even when the market moves in one direction.
For an investor the practical question is whether the month was strong enough to change the picture. A 12th place ranking over twelve months is a soft reading that keeps the index near the lower end of its recent range. The sections that follow test that first impression against the market, against the prior month, and against the long July record.
See what markets are pricing in
Live indices, sector moves and market breadth — the backdrop to every story we publish.
How Did the Nifty500 Value 50 Compare With the Nifty 50 and Sensex in July 2026?
In July 2026 the Nifty500 Value 50 returned -2.48%, the Nifty 50 rose 1.09%, and the Sensex rose about 2.10%. Measured against the large cap Nifty 50, the index lagged by about 3.57 percentage points. That places this index behind the large cap benchmark for the month, a sign that its segment or factor tilt was out of favour.
The table sets the three benchmarks side by side for July 2026. The Sensex figure reflects the tilt toward the very largest stocks, the Nifty 50 figure represents the broad large cap experience, and the Nifty500 Value 50 figure shows how its particular basket fared. Reading the gap in percentage points is the quickest way to see whether the month rewarded this index relative to the market.
| Index | July 2026 return | Gap vs this index |
|---|---|---|
| Nifty500 Value 50 | -2.48% | reference |
| Nifty 50 | +1.09% | +3.57 pts |
| Sensex | +2.10% | +4.58 pts |
For an index investor the gap is practical. A fund tracking the Nifty500 Value 50 would have trailed a plain Nifty 50 fund by about 3.57 points in July, before costs. Over long periods factor and segment indices move in cycles relative to the large cap benchmark, so one month is best read as a signal about which part of the market led, rather than a lasting verdict.
July 2026 was a large cap led month at the headline level, since the Sensex finished ahead of the Nifty 50. Where the Nifty500 Value 50 sits relative to those two benchmarks is a read on breadth. When a broader or higher risk basket beats the Nifty 50, market breadth was wide and gains spread beyond the largest names; when it lags, the month was concentrated in a handful of heavyweights. This month the Nifty500 Value 50 lagged the Nifty 50, which points to a narrow market that favoured the largest stocks over its basket.
How Did July Compare With June and the Recent Trend?
The month on month picture weakened. The Nifty500 Value 50 returned -1.63% in June 2026 and -2.48% in July, a change of about -0.85 percentage points. That is a shift toward weaker momentum.
Set against the full run of trailing windows, the one month return was -2.48%, the three month return was -3.47%, the six month return was -0.65%, the one year return was +12.79%. With the trailing 12 month average month at about +1.04%, July came in below the typical month of the past year. The contrast between the one month figure and the longer windows is the key tension: it separates a single strong or weak month from a confirmed trend.
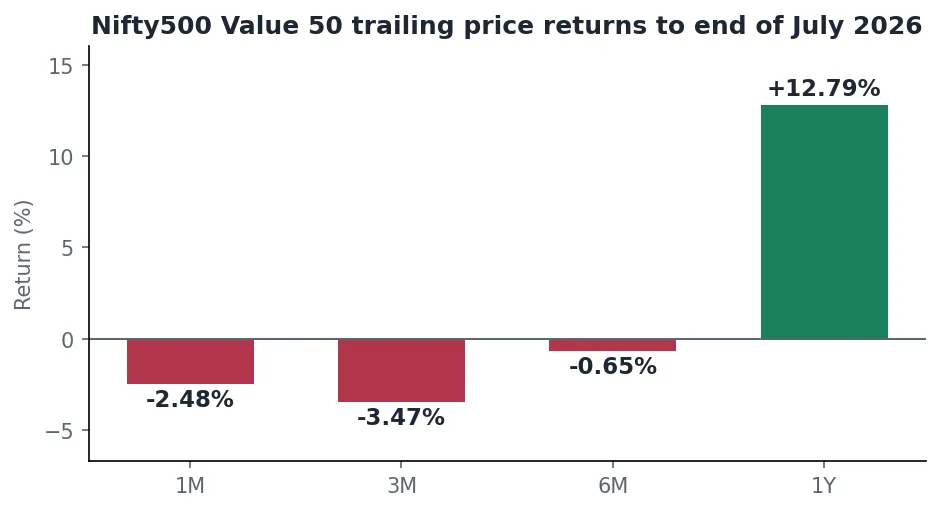
| Window to end July 2026 | Nifty500 Value 50 price return | Period |
|---|---|---|
| 1 month | -2.48% | Latest month |
| 3 months | -3.47% | May to July |
| 6 months | -0.65% | February to July |
| 1 year | +12.79% | Trailing twelve months |
The trailing table frames July within the medium term. The one year window is positive, so the recovery has already reached the twelve month view.
The six month window still carries the imprint of early 2026, when the Nifty500 Value 50 fell across several consecutive months alongside the broader market. That is why a firmer July can sit next to a weaker six month figure. The distance between the one month reading and the six and twelve month readings is the clearest measure of how much of the earlier drawdown remains, and it is the gap an investor should watch narrow before treating the recovery as established.
Get research like this in your inbox
The week’s research that mattered, in five minutes. Joined by 2L+ investors.
What Does July History Tell Us About the Nifty500 Value 50?
July has a track record for the Nifty500 Value 50. Across the 9 completed Julys from 2017 to 2025 the index closed higher in 5 of them, a win rate near 56%. The average July return has been about +4.34% over the last 3 years, +2.69% over the last 5 years, +1.22% across all 9 years of history.
Against that seasonal record, July 2026 at -2.48% was below the long run July average by about 3.70 percentage points. On a year on year basis the month came in under July 2025, which returned -0.11%, a swing of about -2.37 percentage points.
Seasonal patterns describe tendencies rather than promises. The chart below plots each July for the index against its average July, which makes it easy to see whether 2026 followed the usual seasonal direction and by how much it differed in size. A month can keep the seasonal direction while landing well away from the average, and that combination is exactly what an investor should weigh against the trailing trend before drawing a conclusion.
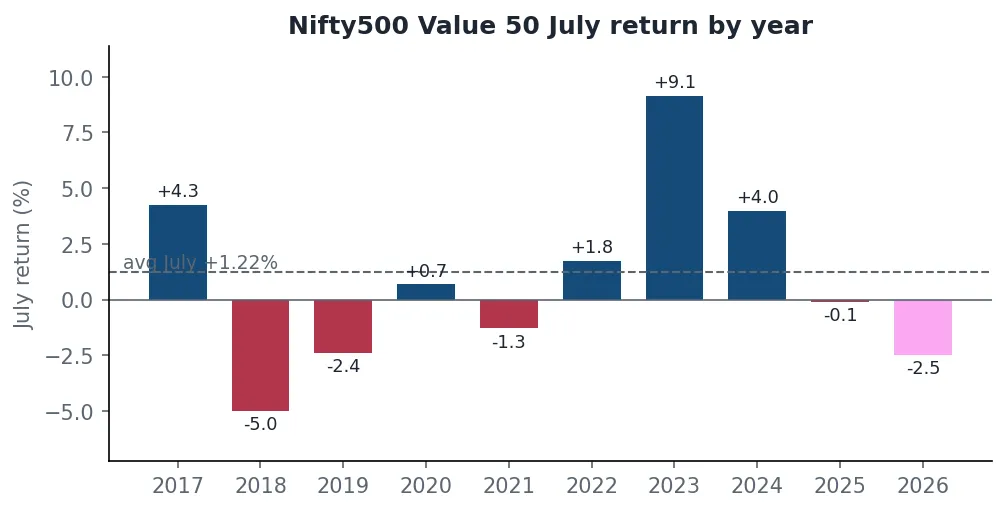
| Year | Nifty500 Value 50 July return |
|---|---|
| July 2017 | +4.26% |
| July 2018 | -5.00% |
| July 2019 | -2.39% |
| July 2020 | +0.68% |
| July 2021 | -1.29% |
| July 2022 | +1.75% |
| July 2023 | +9.13% |
| July 2024 | +3.99% |
| July 2025 | -0.11% |
| July 2026 | -2.48% |
What Should Investors Take Away From the Nifty500 Value 50 in July 2026?
July 2026 gave three readings for the Nifty500 Value 50. First, the month returned -2.48% and ranked 12th of the past twelve months. Second, relative to the market it lagged the Nifty 50 by about 3.57 points, which places its factor or segment tilt out of favour for the month. Third, the trailing windows show a recovery that has reached the one year view.
For a long term investor the useful framing is that one month sets direction but not trend. The figures to watch from here are the trailing three and twelve month windows for the Nifty500 Value 50, since those confirm whether July marked a turn or a pause. The seasonal and benchmark context above is a guide to tendencies, not a forecast.
There is also a portfolio lesson in the month. The Nifty500 Value 50 represents the value factor part of the market, and its July gap against the Nifty 50 is a live example of how that tilt behaves relative to a plain large cap holding. Investors who hold this index alongside a core allocation should size it with that cyclicality in mind, since the same factor or segment that hurt in July can move the other way in a different regime. The monthly review is a way to monitor that tilt, not a signal to trade on a single month.
Track the factors behind this research
Momentum, value, quality and low-vol — updated factor performance for Indian markets.
What Are the Key FAQs About the Nifty500 Value 50 in July 2026?
What was the Nifty500 Value 50 return in July 2026?
The Nifty500 Value 50 posted a price return of -2.48% in July 2026 and ranked 12th of the trailing 12 months.
How did the Nifty500 Value 50 compare with the Nifty 50 in July 2026?
The Nifty500 Value 50 returned -2.48% while the Nifty 50 rose 1.09%, so the index lagged the large cap benchmark by about 3.57 percentage points.
How did the Nifty500 Value 50 compare with June 2026?
The index returned -1.63% in June 2026 and -2.48% in July, a change of about -0.85 percentage points.
What is the average July return for the Nifty500 Value 50?
Across the 9 completed Julys in the data the average July return has been about +1.22%, with a win rate near 56%.
Is the Nifty500 Value 50 return quoted here a price or total return?
The figures are price returns from the monthly returns history and do not include dividends. They are historical and do not guarantee future results.


