


You open your portfolio app in 2026 and see a headline screaming "Foreigners dump ₹2.3 lakh crore." Your stomach drops. But your Nifty holdings are barely down. Confusing, right? For years, the rule was simple: when foreign money left, Indian markets crashed. That rule just broke. The drying up of FII inflows India that investors once feared is now being quietly absorbed by domestic money. This blog unpacks the FII vs DII story of 2026, what it means for your mutual funds portfolio, and how to position yourself. Wright Research tracks these flows daily to build smarter, data-led portfolios.
What Are FII and DII Flows?
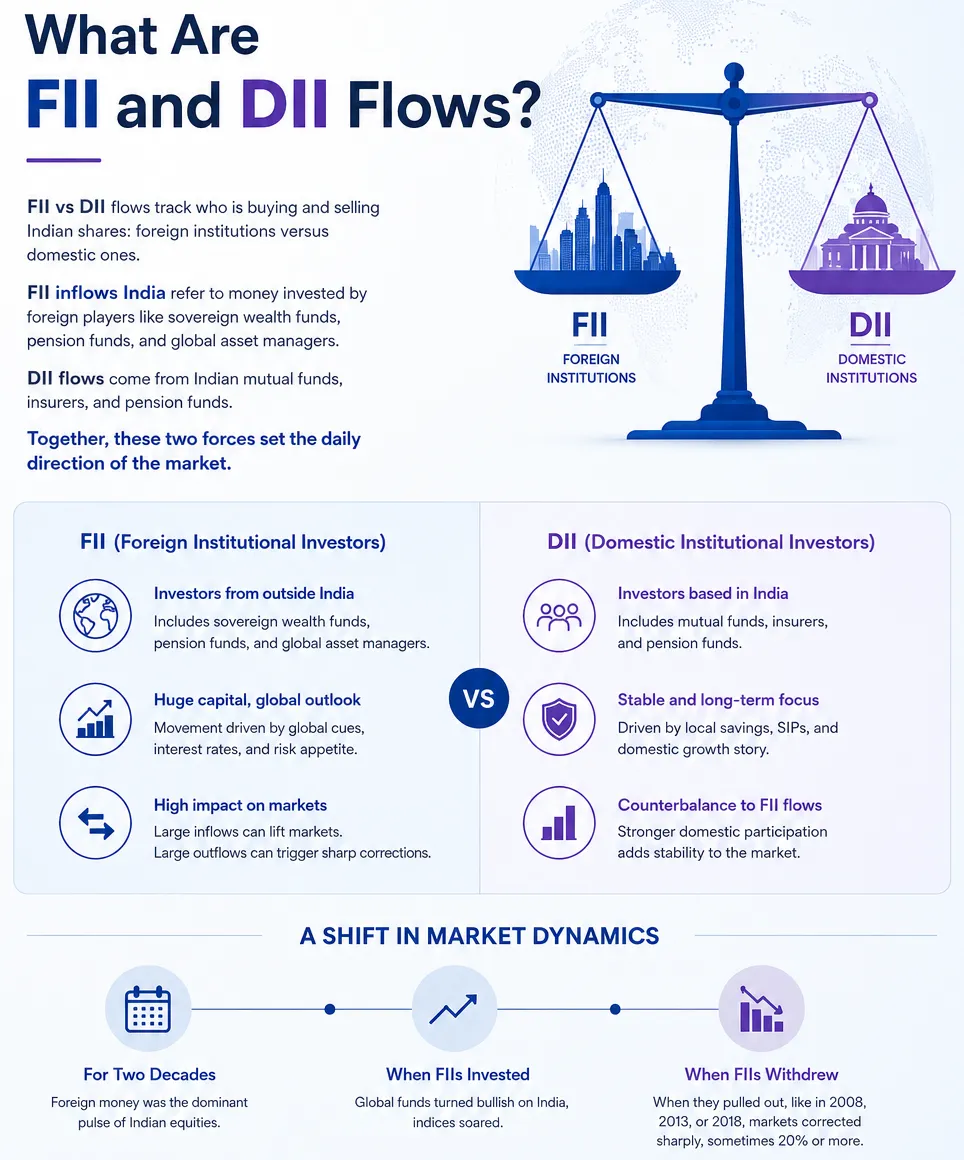
FII vs DII flows track who is buying and selling Indian shares: foreign institutions versus domestic ones. FII inflows India refer to money invested by foreign players like sovereign wealth funds, pension funds, and global asset managers. DII flows come from Indian mutual funds, insurers, and pension funds. Together, these two forces set the daily direction of the market.
For two decades, foreign money was the dominant pulse of Indian equities. When global funds turned bullish on India, indices soared. When they pulled out, like in 2008, 2013, or 2018, markets corrected sharply, sometimes 20% or more. Retail investors and even large traders learned to watch the daily FII number like a weather forecast.
That dynamic has shifted. Domestic institutions, powered by record SIP contributions into the mutual funds industry, now have enough firepower to counterbalance foreign exits. Understanding this rebalancing is essential before you make any decision about your mutual funds portfolio or move into portfolio management services in 2026.
See what markets are pricing in
Live indices, sector moves and market breadth — the backdrop to every story we publish.
How Do FII and DII Flows Move the Market?
Stock prices move on net buying pressure. When FIIs and DIIs are both buying, prices rise fast. When one sells heavily and the other can't absorb it, prices fall. The "market impact" of these flows depends entirely on the balance between the two.
Here's the simple mechanism in three steps. First, money enters or exits through the cash and derivatives segments of NSE and BSE. Second, sustained net selling by one group creates downward pressure on index heavyweights. Third, if the opposing group buys with equal or greater force, the index stays stable despite the churn.
In 2026, this third step is the whole story. In the six months to December 2025, FIIs were net sellers of roughly Rs 1.1 lakh crore, while DIIs were net buyers of around Rs 1.9 lakh crore. That gap is why your portfolio didn't crash even as foreign capital fled, a dynamic that any serious investment research services team now factors into every model.
FII vs DII Trends in 2026: Key Data and Ownership Shifts
The numbers tell a dramatic story. Total net outflows by foreign investors reached just under ₹2.3 lakh crore between January and May 2026, contrasting sharply with 2025, when international funds pulled out a total of ₹1.7 lakh crore. Foreign selling accelerated rather than eased.
Yet the indices held. In May alone, DII net inflows topped ₹82,600 crore, ensuring that the heavy waves of international portfolio liquidation did not cause chaotic market corrections. The domestic wall did its job.
The ownership shift is structural, not temporary. FII ownership of Indian equities fell to 14.7% in April 2026, a 14-year low, while DII ownership reached 18.9%, a record high, per JM Financial's May 2026 report.
Metric | 2025 | 2026 (Jan to May) |
FII net flows | minus ₹1.7 lakh cr (full year) | minus ₹2.3 lakh cr |
FII ownership of equities | approx 16% | 14.7% (14-yr low) |
DII ownership of equities | approx 17% | 18.9% (record high) |
DII role | Strong support | Near-total absorber |
Market reaction | Resilient | Resilient despite heavier selling |
Sources: NSDL, depository data, JM Financial (May 2026). Figures are net and subject to revision.
This data shapes how the best investment research companies in India are advising clients, and why ignoring domestic flows is now a costly mistake. Quality investment research services treat the FII-DII balance as a core input, not a footnote.
Why FII Inflows India Turned Negative
The collapse in FII inflows into India is not a verdict on Indian companies. This persistent selling does not stem from a collapse inside India's corporate environment; instead, global macroeconomic pressures and shifting investment trends are redirecting international capital.
Several global forces are at play. Higher interest rates in developed markets make safe foreign bonds more attractive than emerging-market equities. A strong dollar raises the cost of holding rupee assets. Geopolitical uncertainty pushes global allocators toward perceived safe havens. And after a long bull run, India's valuations looked rich to value-conscious foreign desks.
There's also a rotation story. In Jan to Mar 2026, US mutual funds saw equity and hybrid outflows while debt funds drew inflows, a textbook flight to safety, even as Indian equity funds received ₹90,457 crore over the same quarter. Foreign caution and domestic conviction moved in opposite directions.
For long-term investors, this is less alarming than the headlines suggest. A market less dependent on "hot" foreign money is structurally calmer, a key reason active investing strategies and PMS in investment mandates are gaining traction this year.

The Rise of DIIs: India's New Market Anchor in 2026
The hero of 2026 is the ordinary Indian SIP investor. April 2026 SIP inflows stood at ₹31,115 crore, just below March 2026's all-time high of ₹32,087 crore, with the structural SIP trajectory remaining intact. This monthly tide of disciplined money is what DIIs deploy into the market.
The depth of absorption is remarkable. DIIs increased their stake in 39 out of 41 Nifty stocks where FIIs sold, acting as a systematic, near-perfect absorber of every foreign exit. This is not luck; it's the mathematical result of relentless SIP flows.
Crucially, this money doesn't flee at the first sign of trouble. For the 61st consecutive month since March 2021, equity mutual funds recorded net positive inflows, with investors continuing to buy even as the Nifty fell sharply in March 2026.
The behavioural shift matters. Lower FII ownership reduces the "hot money" component of Indian equity flows, structurally reducing crash amplitude, a positive for long-term investors who dislike volatility. For anyone building a mutual funds portfolio, this is a foundation worth understanding.
Get research like this in your inbox
The week’s research that mattered, in five minutes. Joined by 2L+ investors.
What This Means for Your Portfolio in 2026
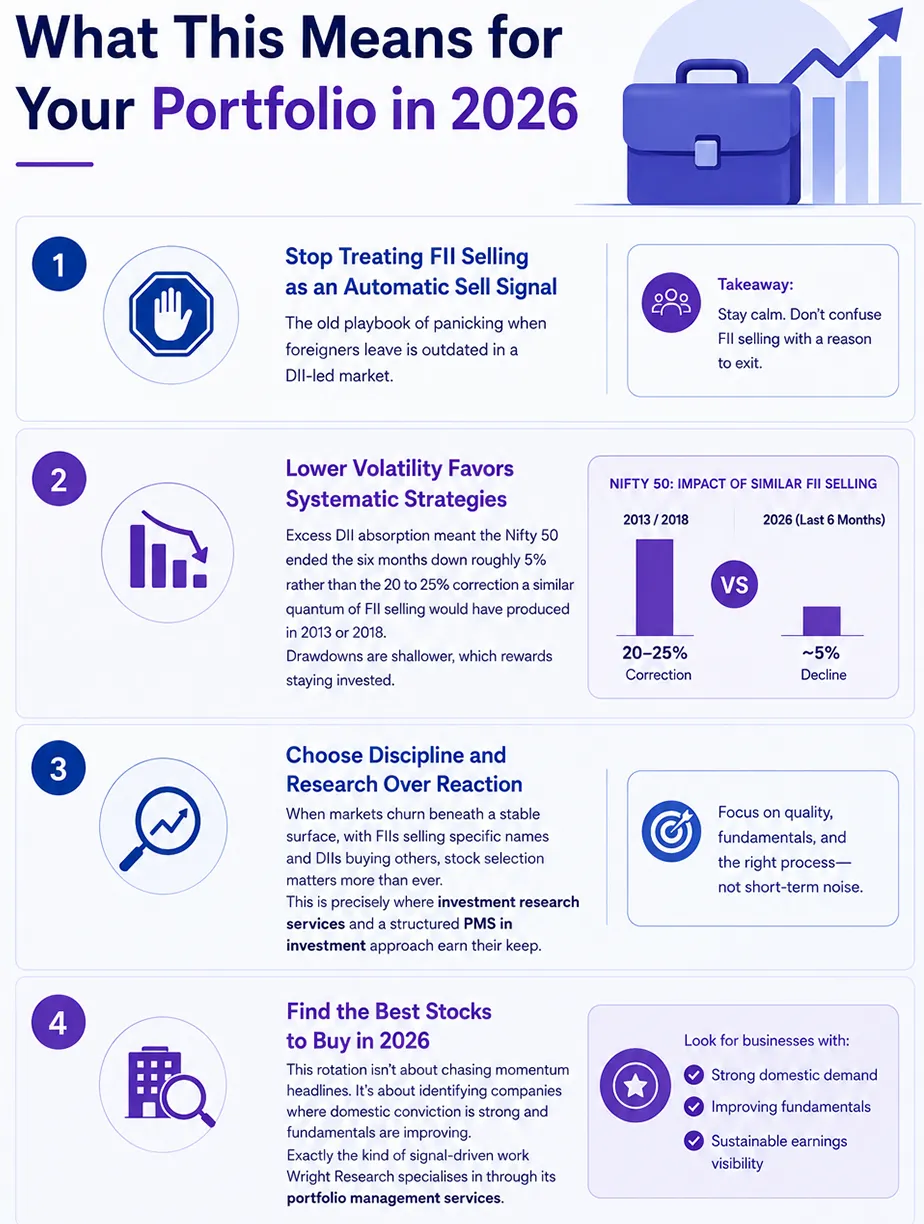
So what should you actually do with this knowledge? First, stop treating FII selling as an automatic sell signal. The old playbook of panicking when foreigners leave is outdated in a DII-led market.
Second, recognise that lower volatility favours systematic strategies. The excess DII absorption meant the Nifty 50 ended the six months down roughly 5% rather than the 20 to 25% correction a similar quantum of FII selling would have produced in 2013 or 2018. Drawdowns are shallower, which rewards staying invested.
Third, this environment suits disciplined, research-driven approaches over reactive trading. When markets churn beneath a stable surface, with FIIs selling specific names and DIIs buying others, stock selection matters more than ever. This is precisely where investment research services and a structured PMS in investment approach earn their keep.
Finding the best stocks to buy in 2026 in this rotation isn't about chasing momentum headlines. It's about identifying companies where domestic conviction is strong and fundamentals are improving, exactly the kind of signal-driven work Wright Research specialises in through its portfolio management services.
Active Investing and Factor Investing in a DII-Led Market
A market where FIIs and DIIs are pulling stocks in different directions creates dispersion: some sectors fall while others rise. Dispersion is the friend of active investing, because skilled selection can outperform a flat index.
This is where factor investing shines. Instead of guessing which way foreign money flows next, factor strategies rank stocks on measurable signals like momentum, quality, value, and low volatility. Wright Research's quant models process hundreds of these data points to build and rebalance portfolios, removing human bias from the equation.
In 2026's conditions, a quality and low-volatility tilt has historically helped portfolios weather FII-driven churn, while momentum factors capture the stocks DIIs are accumulating. Combining these through a rules-based factor investing framework gives investors a repeatable edge that emotional, headline-led trading simply cannot match.
This systematic philosophy is what separates leading investment research companies in India from traditional brokers who merely react to the daily FII number. A disciplined, active investing process is built for exactly this kind of two-speed market.
FII-Led vs DII-Led Markets: Which Is Better for You?
Investors often ask which environment is "better." The honest answer: a DII-led market is generally calmer and kinder to long-term wealth builders, while an FII-led market can deliver sharper rallies but also brutal drawdowns.
Parameter | FII-Led Market | DII-Led Market (2026) |
Volatility | High, sharp swings | Lower, cushioned by SIPs |
Crash risk | Severe (2013, 2018 style) | Muted, shallower drawdowns |
Rally speed | Fast, liquidity-driven | Steadier, fundamentals-driven |
Best suited for | Tactical traders | Long-term and systematic investors |
Ideal vehicle | Active trading | Portfolio management services, SIPs |
For most readers building wealth over the years, the 2026 DII-led structure is an advantage. It rewards patience, systematic active investing, and a well-constructed mutual funds portfolio rather than timing the next foreign flow.
How to Position Your Portfolio with Wright Research
Putting this into action is simpler than the headlines suggest. Here's a practical path.
Start by reviewing your current allocation. If your holdings are concentrated in stocks heavily owned by FIIs, you may be carrying more flow-driven volatility than you realise. A diversified mutual funds portfolio with a factor tilt can smooth this out.
Next, decide on your vehicle. If you have ₹50 lakh or more and want a professionally managed, quant-driven mandate, portfolio management services offer customisation and direct stock ownership. If you're building up disciplined SIPs into research-backed funds, keep yourself on the right side of the DII tide.
Then, lean on research. Wright Research's investment research services track FII and DII flows daily and translate them into actionable, factor-based portfolios, so you're not guessing at the best stocks to buy in 2026. A disciplined PMS in investment mandate turns this research into a managed portfolio of the best stocks to buy 2026 without the daily stress.
Ready to explore a data-led approach to 2026's markets? Speak with a Wright Research advisor or explore our PMS strategies today.
Is your portfolio built for what’s coming?
Get a free AI-powered review of your holdings — risk, overlap and quality in minutes.
Frequently Asked Questions
What does FII vs DII mean in the stock market?
FII vs DII compares two groups of large investors. FIIs are foreign institutions like global funds and pension funds driving FII inflows to India. DIIs are domestic players like mutual funds and insurers. Their combined buying and selling sets daily market direction and overall volatility.
Why are FII inflows India negative in 2026?
FII inflows India turned negative mainly due to global factors like higher developed-market interest rates, a strong dollar, and geopolitical caution redirecting capital. It does not reflect weakness in Indian companies. Net foreign outflows crossed ₹2.3 lakh crore between January and May 2026.
How are DIIs keeping the market stable?
DIIs deploy record SIP money into equities every month. In 2026, DII inflows absorbed nearly all FII selling, increasing stakes in most Nifty stocks that foreigners sold. This domestic wall kept indices resilient despite heavy foreign outflows, reducing crash risk for your mutual funds portfolio.
Should I sell when FIIs are selling?
Not automatically. In a DII-led market, foreign selling is often absorbed by domestic buyers, so drawdowns are shallower. Reacting to every FII number usually hurts returns. A disciplined, active investing or factor investing approach generally serves long-term investors better than timing flows.
How does factor investing help in a volatile market?
Factor investing ranks stocks on measurable signals like quality, momentum, value, and low volatility instead of predicting fund flows. This rules-based method captures the stocks DIIs accumulate while avoiding bias. It's a core tool used by leading investment research companies in India for steadier outcomes.
Is PMS a good choice in the 2026 market?
For investors with ₹50 lakh or more, PMS in investment offers professional, quant-driven management and direct stock ownership, well-suited to 2026's two-speed market. Portfolio management services let experts handle FII-DII churn and stock selection while you focus on long-term goals.


