by Siddharth Singh Bhaisora
Published On July 27, 2025
When Chinese factory activity comes in stronger or weaker than markets expected, prices across the world tend to move often within minutes. That matters for India because global investors also change their appetite for risk, for commodities, and for emerging‑market exposure. At the same time, India’s equity market has been dealing with stop‑start foreign portfolio flows in 2025, with valuation and momentum sending a mixed message. Let’s look at what this means for those of us investing day‑to‑day in Indian equities.
A July 2025 IMF working paper “Global Financial Spillovers of Chinese Macroeconomic Surprises” by Camila Gutierrez, Javier Turen, and Alejandro Vicondoa examines high‑frequency forecast errors (“surprises”) in major Chinese data releases and measures how assets move in narrow windows around the announcements. The headline result is that China’s Industrial Production is the one indicator that reliably moves global markets. Other data such as retail sales, CPI, GDP, PPI, exports, imports, trade etc do not show a reliable same‑day effect in the high‑frequency tests.
These moves aren’t just generic “global news.” When China’s Industrial Production data happen to land on the same day as macro releases from Japan or the UK, the researchers control for those other surprises and find that the Chinese Industrial Production surprise remains significant, while the others do not. That points to the China‑specific content of the market move.
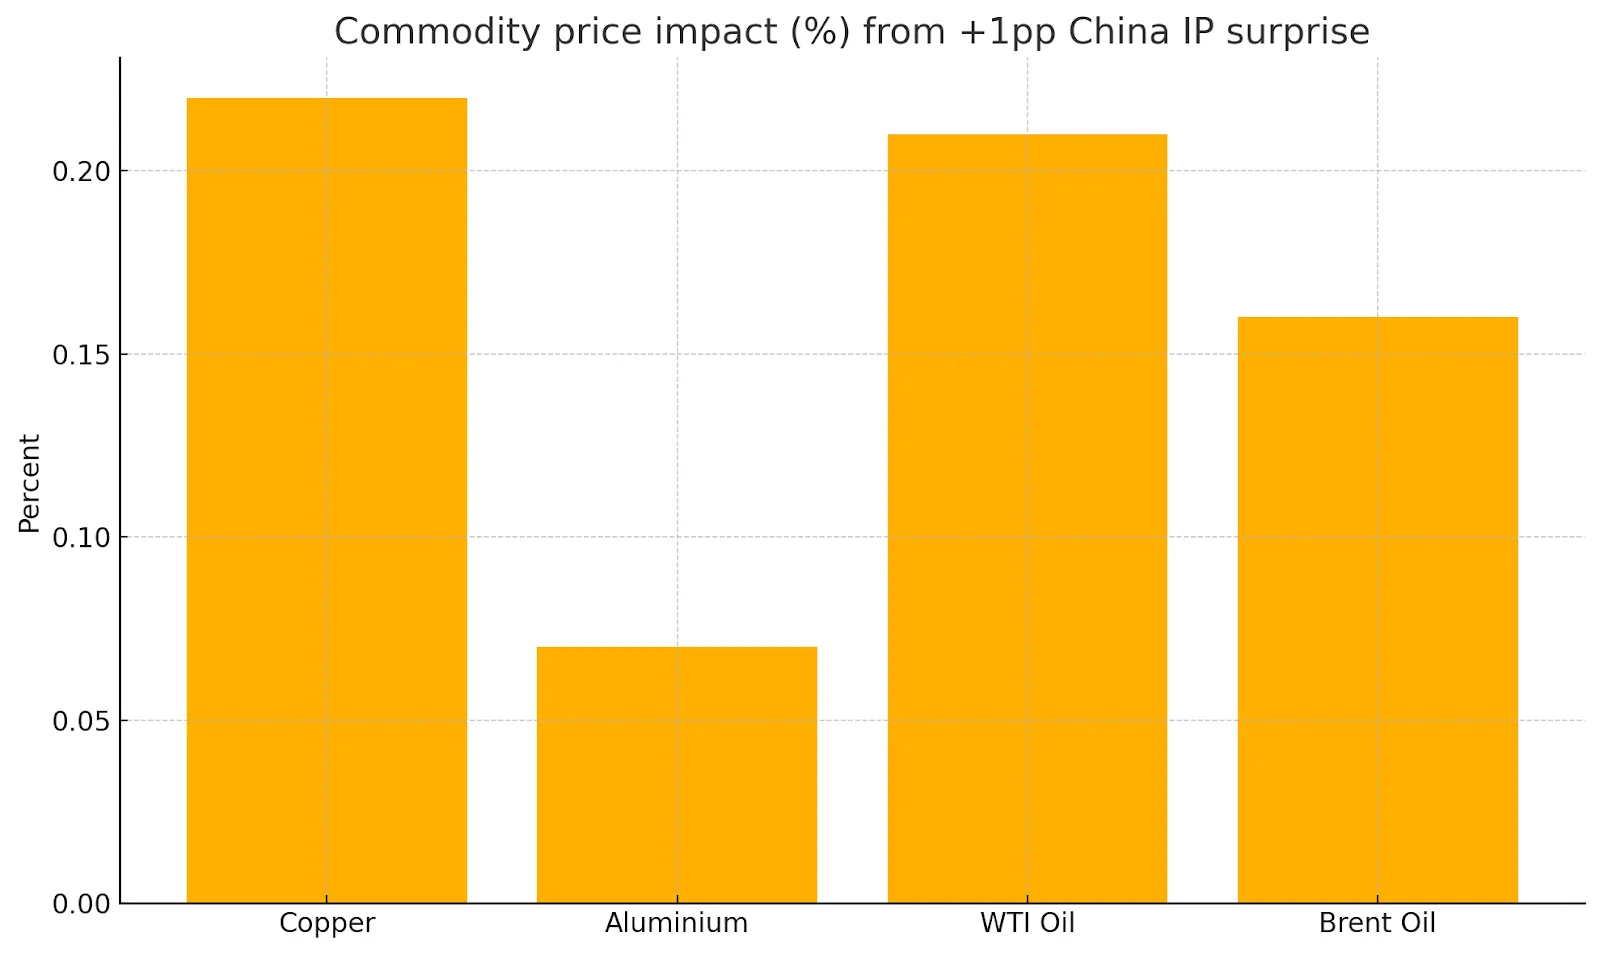
Why focus on China at all? Because the country’s share of global output and trade has grown dramatically, and it has become a dominant buyer of many commodities. China accounts for roughly 60% of global aluminium demand, 55% of copper, and about 14 to 15% of oil, which gives its factory cycle real weight in commodity and equity markets worldwide.
Industrial Production is basically the monthly gauge of how much China’s factories produced compared with a year earlier. Think of heavy industry and manufacturing - electronics, machinery, autos, steel, chemicals and the like. The IMF working paper we draw on constructs surprises for several Chinese data releases by comparing each actual number with the median forecast collected by Bloomberg just before release. The surprise is simply “actual minus expected,” so a +1 percentage‑point Industrial Production surprise means the data beat forecasts by one percentage point. The study builds these surprise series for industrial production, retail sales, GDP, CPI/PPI, exports and imports.
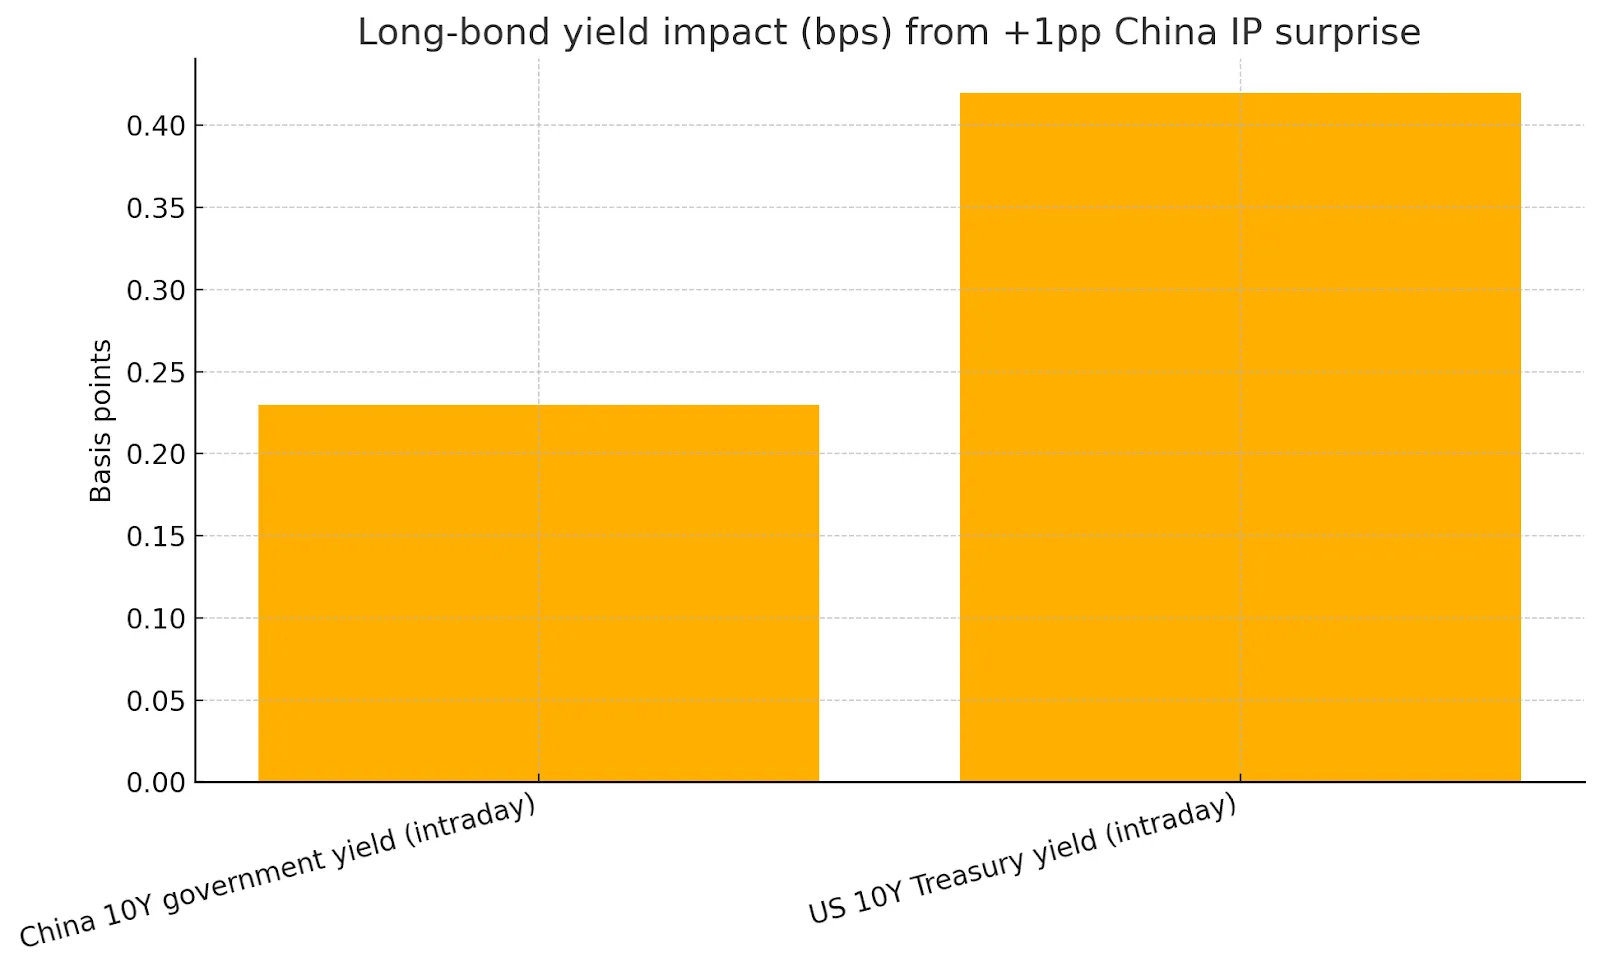
The quickest effects are in equity and bond markets in Asia’s time zone, and in commodity contracts once they open. Within a tightly defined window around the announcement, the study finds Chinese stocks rise, other Asia‑Pacific stocks also gain, 10‑year government bond yields edge up while short‑term yields barely move, and industrial commodities lift.
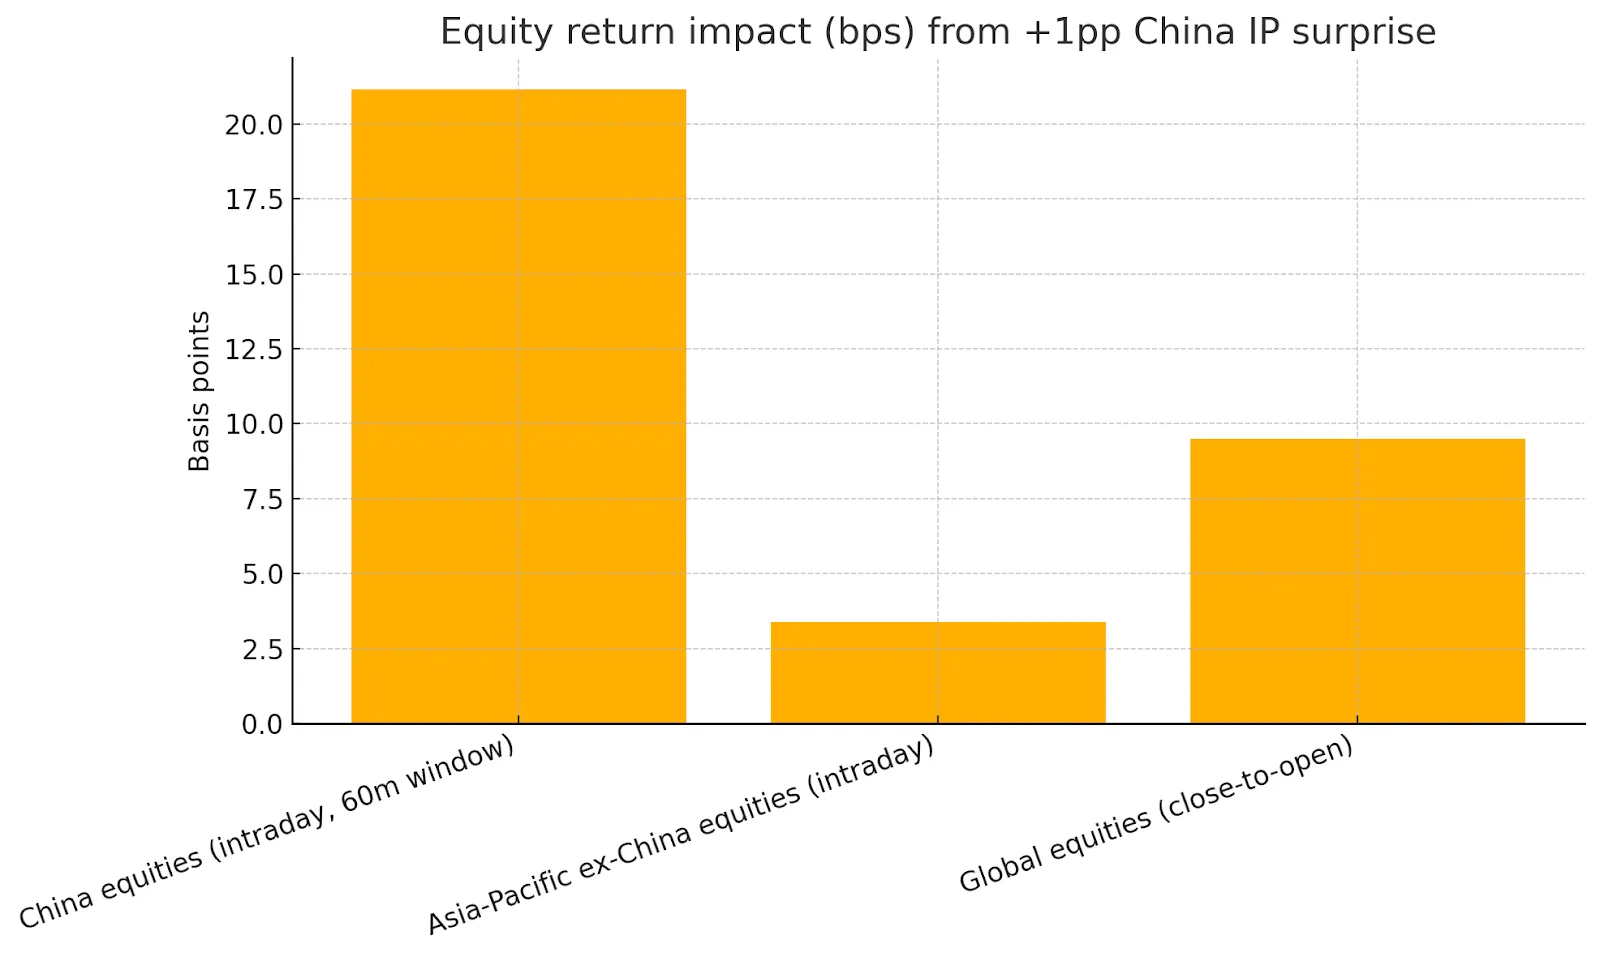
Because of time zones, the paper also checks the close‑to‑open reaction in global markets and shows that a positive China Industrial Production surprise is followed by an average rise of about 9.5 basis points in international equity returns when those markets next open. That result holds up even when the authors add other countries’ surprises to the model.
Risk appetite changes too. The VIX - a common gauge of equity market fear - tends to be lower following stronger‑than‑expected Chinese IP, in line with a short‑term loosening in financial conditions. In the paper’s close‑to‑close specification, the VIX coefficient is negative and statistically significant.
All of this adds up to a consistent picture: when China’s factories surprise on the upside, the immediate tone is “risk‑on” - equities up, long‑dated yields a bit higher, and industrial commodities firmer.
Not every country’s equity market reacts by the same amount. The study documents that emerging markets react more than advanced economies, and the reaction is amplified in countries that export more to China - not with general trade openness or income per capita. On average, EM equity markets’ response is about 4 basis points larger than that of advanced economies on an IP‑surprise day. Moreover, each 1‑percentage‑point increase in export dependence on China adds roughly 0.14 basis points to the stock‑market move, while import dependence and general openness measures are not meaningful amplifiers in the data. Taken together, 2 ideas stand out:
Equity markets around the world tend to move together after China Industrial Production surprises
The magnitude of the move is amplified by bilateral export linkages to China. That points to China‑specific news, not just generic “global growth,” as the driver.
After 2016, the average global equity response to a China Industrial Production surprise is ~4.5 bps larger than before - consistent with China’s rising weight in the global economy. The effect has also grown over time as China’s weight in the world economy and commodity markets has increased, which helps explain why these data points seem more market‑moving now than they were a decade ago.
India’s market is less tied to China than many exporters in East Asia, but it is not isolated. On a China Industrial Production beat day, the global pattern - equities up, industrial commodities up, long rates a touch higher, and the VIX down - tends to support risk appetite in emerging markets as an asset class. Broad co-movement covers the vast majority of countries sampled, even after allowing for differences in development level and openness. In 21 of 27 markets studied, stock returns respond positively on Industrial Production (IP) surprise days, highlighting a coordinated global reaction.
Country | Same Day (All) | Same Day (IP) | Close Open (All) | Close Open (IP) |
Canada | 0.02 | 0.01 | 0 | |
France | 0 | 0.01 | 0 | 0.01 |
Germany | 0.01 | 0.03 | 0 | 0.03 |
Hong Kong | 0.03 | 0.02 | 0 | |
India | 0 | 0.09 | 0.02 | 0.09 |
Indonesia | 0.06** | 0.02 | 0.05 | 0.02 |
Italy | 0 | 0.04 | 0 | |
Japan | 0.02 | 0 | 0.03 | 0 |
Malaysia | 0 | 0 | 0.02 | 0 |
Philippines | 0.02 | 0.03 | 0.04 | 0.03 |
Singapore | 0 | 0.02 | 0.01 | 0.02 |
South Korea | 0.07** | 0.06 | 0.08 | 0.06 |
Taiwan | 0.04 | 0.05 | 0.03 | 0.05 |
Thailand | 0.02 | 0 | 0.03 | 0 |
United Kingdom | 0.06** | 0.15** | 0.02 | 0.15** |
United States | 0.11*** | 0.03 | 0.03 | 0.03 |
Significance levels: ∗∗∗p < 0.01, ∗∗p < 0.05, ∗p < 0.1.
That backdrop spills over to India through a few channels investors here already track. A firmer tone in EM equities can lift index futures and ETFs that include India; stronger metals and energy prices can help producers and weigh on energy‑intensive or oil‑sensitive consumers; and a lower VIX usually means cheaper index protection, which influences hedging costs across portfolios. The point is not that India becomes a macro derivative of China, but that the intraday and overnight tone of global risk is measurably linked to China’s factory surprise, and that tone tends to show up in opening gaps and early‑session flows.
Through most of 2025, daily foreign flows were negative, driven by worries about low growth, geopolitics, and high valuations. Then two inflection points appeared: a brief reversal around 20 March and a more persistent turn in April.
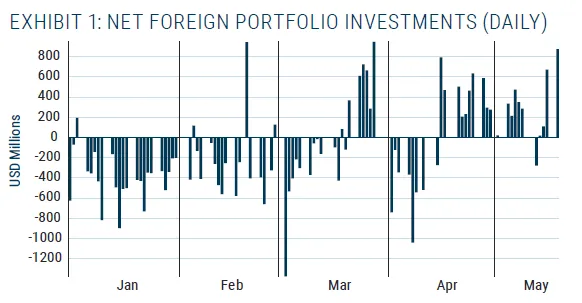
Why did flows improve? A mid‑April delay of US tariffs, accompanied by a sharp drop in perceived risk. The VIX spiked to 52 at the height of uncertainty in April and eased soon after as tensions calmed. February and March CPI beating expectations as supportive macro news, while acknowledging ongoing profit concerns for corporates. In short, both “push” (global) and “pull” (local) forces likely helped. Foreign flows to most emerging market economies are often explained by push‑and‑pull drivers - global risk appetite, relative valuation and growth, the U.S. dollar, and local inflation/geopolitics.
Market state (Value × Sentiment) | Share of foreign flows |
Cheap + Strong momentum | 51.4% |
Expensive + Strong momentum | 24.1% |
Cheap + Weak momentum | 17.4% |
Expensive + Weak momentum | 6.9% |
As of 31 May 2025 |
Indian market returns look meaningfully different on days when foreign flows are positive versus negative. In other words, flow direction has information content for near‑term price action - even though, on average, both flows and returns trend higher over time.
Even if the index looks pricey, many sub‑segments have different cycles, capital intensity, policy support and export optionality.
McKinsey’s June analysis shows where India can build outsized businesses over the next decade by focusing on large, fast‑growing, innovation‑heavy spaces. India’s share of global GDP has already risen from 1.9% in 2008 to 3.4% in 2023, and the government’s 2040 target is 8 to 10%. These sectors jointly can produce $1.7 to $2.0 trillion of annual revenue by 2030, up from ~$690 billion in 2023, potentially delivering ~30% of incremental GDP by 2040.

Below are some of the larger revenue pools for 2030:
Urban construction ($400 to $490 bn) and Travel & tourism ($360 to $420 bn) are the two largest.
Auto components ($160 to $190 bn), Semiconductors ($100 to $120 bn), Cloud services ($70 to $80 bn) and Cybersecurity ($65 to $80 bn) round out big tech‑adjacent pools.
Renewables with storage ($50 to $70 bn), EVs & batteries ($40 to $60 bn), Aerospace & defense ($40 to $50 bn), and AI software & services ($40 to $50 bn) speak to energy transition and digital scale.
Bio‑to‑X ($30 to $40 bn), Medical devices ($25 to $35 bn), Space ($20 to $30 bn), Biopharma ($20 to $25 bn), and Industrial electronics ($20 to $25 bn) add breadth. Nuclear fission ($10 to $15 bn) and Robotics (~$3 bn) are smaller but strategically important.
Beta & breadth: Expect broad, positive moves in global stocks with bigger effects in EMs, and relatively stronger moves in China‑linked export markets. India’s sensitivity will be state‑dependent: sectors and companies with export linkages into China’s industrial cycle (metals, capital goods, select chemicals, energy value chain) should screen as higher beta to a positive Industrial Production surprise.
Rates & risk: Watch 10‑year yields (China/U.S.) for small but positive moves and the VIX for a down‑shift; both are consistent with risk‑on tone.
Commodities: Industrial metals and oil typically pop. That can be a tailwind for Indian upstream energy and metal producers, but a headwind for oil‑sensitive downstreams (aviation, paints, logistics) if the move extends.
Before release: Trim oil‑sensitive downstreams or add short‑dated hedges if a positive Industrial Production surprise risk is high; conversely, consider metals/upstream add‑ons into weakness. (Rationale: metals/oil pop on upside IP.) For index exposure, size EM beta a touch higher than DM into the event; EMs exhibit larger responsiveness.
At release / shortly after: If Industrial Production > expectations, lean into China‑exposed exporters and industrial cyclicals on the day; de‑emphasize oil‑sensitive consumption names if crude is moving. Use the VIX down‑shift to adjust hedge ratios (e.g., take profit on protective vol if the thesis was a positive surprise).
After the pop: Be mindful that the amplification of China news has risen post‑2016. Don’t overstay tactical bets; path dependency matters if follow‑on data or policy news diverge.
Discover investment portfolios that are designed for maximum returns at low risk.
Learn how we choose the right asset mix for your risk profile across all market conditions.
Get weekly market insights and facts right in your inbox

It depicts the actual and verifiable returns generated by the portfolios of SEBI registered entities. Live performance does not include any backtested data or claim and does not guarantee future returns.
By proceeding, you understand that investments are subjected to market risks and agree that returns shown on the platform were not used as an advertisement or promotion to influence your investment decisions.
"I was drawn to Wright Research due to its multi-factor approach. Their Balanced MFT is an excellent product."

By Prashant Sharma
CTO, Zydus
By signing up, you agree to our Terms and Privacy Policy
"I was drawn to Wright Research due to its multi-factor approach. Their Balanced MFT is an excellent product."
By Prashant Sharma
CTO, Zydus
Skip Password
By signing up, you agree to our Terms and Privacy Policy
"I was drawn to Wright Research due to its multi-factor approach. Their Balanced MFT is an excellent product."
By Prashant Sharma
CTO, Zydus
"I was drawn to Wright Research due to its multi-factor approach. Their Balanced MFT is an excellent product."
By Prashant Sharma
CTO, Zydus
Log in with Password →
By logging in, you agree to our Terms and Privacy Policy
"I was drawn to Wright Research due to its multi-factor approach. Their Balanced MFT is an excellent product."
By Prashant Sharma
CTO, Zydus
Log in with OTP →
By logging in, you agree to our Terms and Privacy Policy
"I was drawn to Wright Research due to its multi-factor approach. Their Balanced MFT is an excellent product."
By Prashant Sharma
CTO, Zydus
Answer these questions to get a personalized portfolio or skip to see trending portfolios.
Answer these questions to get a personalized portfolio or skip to see trending portfolios.
(You can choose multiple options)
Answer these questions to get a personalized portfolio or skip to see trending portfolios.
Answer these questions to get a personalized portfolio or skip to see trending portfolios.
Answer these questions to get a personalized portfolio or skip to see trending portfolios.
(You can choose multiple options)
Investor Profile Score
We've tailored Portfolio Management services for your profile.
View Recommended Portfolios Restart


