

I am writing this post as a follow up on a talk by the same name given at Re-work Deep Learning Summit, Singapore. In the talk I tried to detail the reasonswhy the financial models fail and how deep learning can bridge the gap. Further on, I moved on to present three use cases for deep learning in Finance and evidence of the superiority of these models .
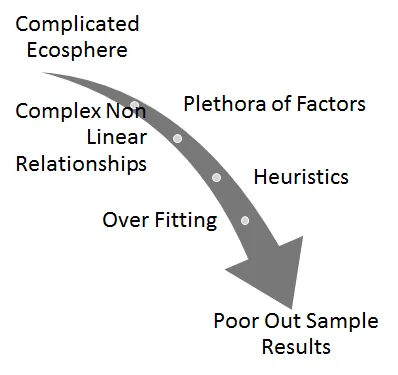
While finance is the most computationally intensive field that there is, the widely used models in finance — the supervised and unsupervised models, the state based models, the econometric models or even the stochastic models are marred by the problems of over fitting, heuristics and poor out of sample results. Which is because, the financial domain is hugely complex and non-linear with a plethora of factors influencing each other .
To solve this, if we look at the research done in Deep Learning in proven fields of image recognition, speech recognition or sentiment analysis we see that these models are capable of learning from largescaled unlabelled data, forming non-linear relationships, forming recurrent structures and can be easily tweaked to avoid over-fitting.
If these models find application in the discipline of finance then the applications are far and wide.These models can be used in pricing, portfolio construction, risk management and even high frequency trading to name a few fields . So let us tackle a few of these problems.
Return Prediction
Taking the sample problem of predicting daily Gold Prices, we first look at the traditional methods.
Using the Autoregressive Integrated moving Average model, which tries to predict a stationary time series keeping the seasonal component in place we get a result
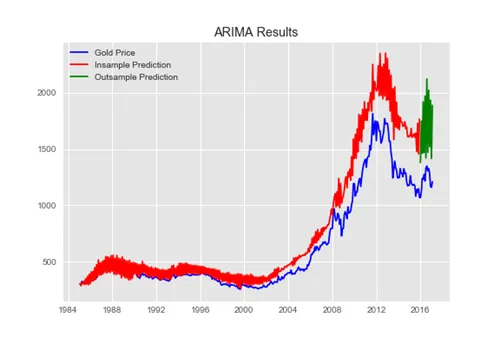

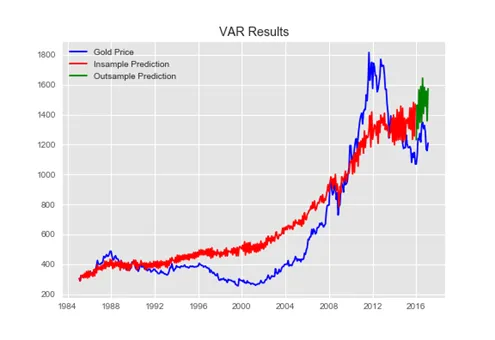
If we add related predictor variables to our auto-regressive model and move to a Vector Auto Regressive mode l, we get these results —

Deep Regression
Using the same inputs if I fit a simple deep regression model on the data, I get far better results,
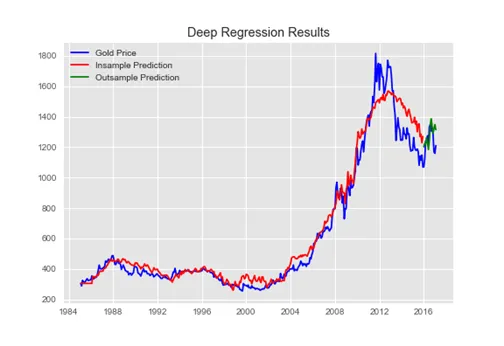

Modifying my architecture to use convolutional neural networks for the same problem, my results are
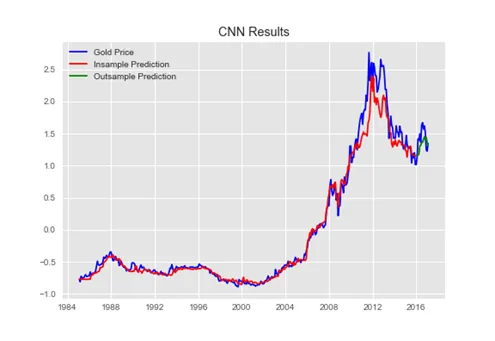

These results are drastically better. But the best results come next.
There you go! Using these variations of recurrent neural networks, my results are:
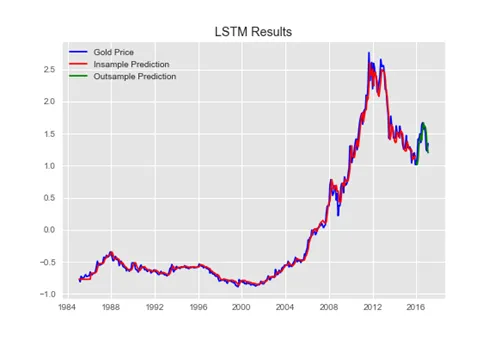

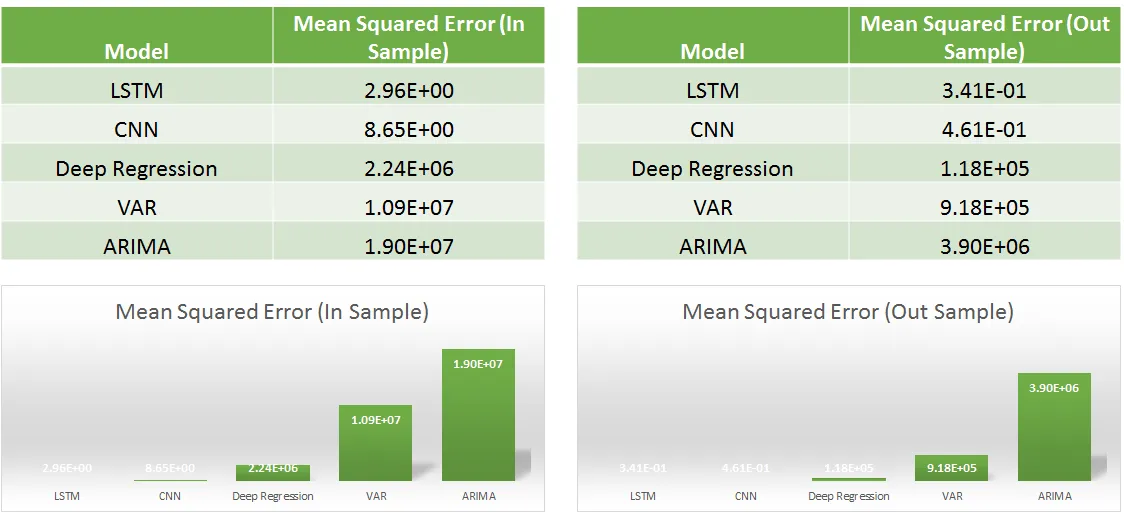
So overall the trend of the mean squared errors is a revelation !
Check the macro backdrop
GDP, inflation, rates and more — India’s key economic indicators in one dashboard.
Get research like this in your inbox
The week’s research that mattered, in five minutes. Joined by 1.6L+ investors.
Portfolio Construction
The second financial problem we will try to tackle using deep learning is of portfolio construction. The application of deep learning to this problem has a beautiful construct. My study is inspired by a paper titled Deep Portfolios.
What the authors of the paper try to do is to construct auto-encoders that map a time series to itself. The errors of prediction using these auto-encoders becomes a proxy of a stock beta (correlation to the market), the auto-encoder being a model of the market!
Ch oosing a diverse set of stocks based on above mentioned auto-encoder errors, we can construct a deep index using another deep neural network and the res ults are quite good.
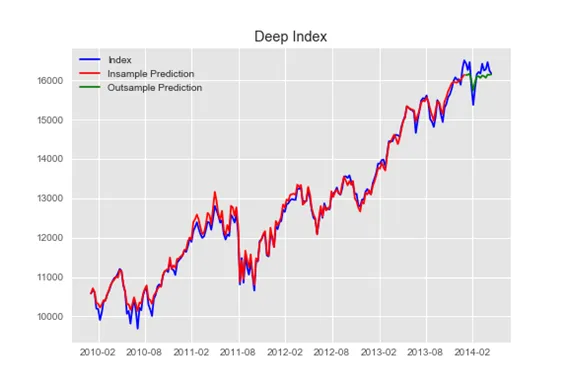
The deep neural network here has become a index construction method that replicated the index usingthe stocks.
But that’s just the beginning of it! If we apply smart indexing, where I remove periods of extreme drawdown from the index and train my index mapping deep neural network on the smart index, I am able to outperform the index in a drastic way!
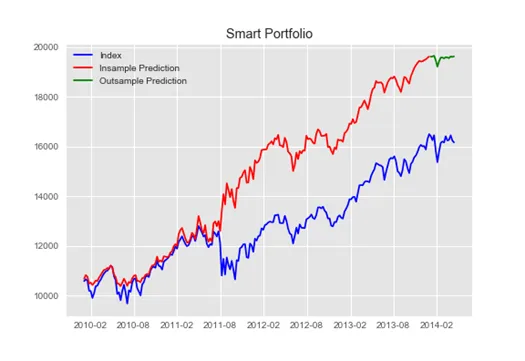
This technique has a huge potential in the field of portfolio construction!
See what markets are pricing in
Live indices, sector moves and market breadth — the backdrop to every story we publish.
Conclusion
The current trends in the financial industry are leading the way to more sophisticated and sound models finding their way in. Technology is a huge area of stress for all the banks with a large number of data scientists entering the field. You have hedge funds like RelTec and Worldquant that already use this technology in their trading. With the superior results shown by these sophisticated models in other fields and the huge gaps open in the field of financial modelling, there is a scope of dramatic innovations!
Better solutions to our critical problems in the field of finance and trading would lead to increased efficiency, more transparency, tighter risk management and new innovations.
PS: The code used for all the above analysis can be found on my github repo
I’m planning my next post on deep RL for portfolio management, so keep tuned in!
Any good suggestions are welcome.
Please visit my website https://www.wrightresearch.in / to know more about the investment strategies I manage!