by Naman Agarwal
Published On Aug. 8, 2025
The financial markets are dynamic and often unpredictable, driving traders and investors to seek reliable chart patterns that hint at potential reversals or trend continuations. Among these, the bullish engulfing pattern stands out as one of the most widely recognized candlestick formations for identifying possible market reversals after a prolonged downtrend. A bullish engulfing pattern is a critical tool in technical analysis, an approach to evaluating assets using charts and patterns to forecast future price movements.
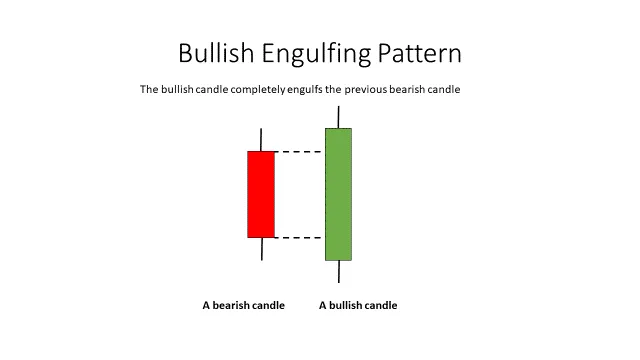
A bullish engulfing pattern is a two-candlestick formation that signals a potential reversal from a bearish (downward) trend to a bullish (upward) trend. The bullish engulfing pattern is defined by a smaller bearish candle (red or black) followed by a larger bullish candle (green or white) whose real body entirely covers or "engulfs" the previous day's bearish body. This is considered one of the most decisive bullish candlestick reversal patterns, as it demonstrates strong buying momentum overwhelming prior selling pressure.
The bullish engulfing meaning extends beyond just pattern recognition; it reflects a shift in market psychology. Typically emerging after a series of declines, the pattern suggests that sellers were in control but buyers have forcefully wrested back dominance. When paired with heightened trading volume or other confirming indicators, this pattern can serve as an early warning of changing market sentiment.
Before identifying or trading using this formation, it’s crucial to understand its defining attributes and what they imply for market participants. Below are the standout features and context in which the bullish engulfing candlestick excels as a trading signal.
The bullish engulfing pattern is not to be confused with simply any up day following a down day. Here’s what sets this pattern apart:
Appears after a downtrend or period of selling.
The first candlestick is bearish, representing continued selling pressure.
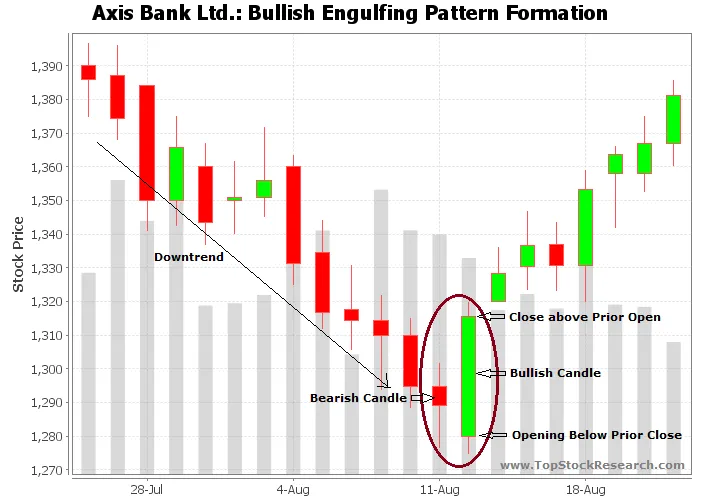
The second day's candlestick opens lower than the previous close (gap down) and closes higher than the previous open creating a bullish candle that fully engulfs the previous bearish body.
The bullish engulfing candle typically closes at or near its high, evidencing strong buying interest.
When accompanied by increased trading volume, the signal’s reliability is enhanced.
While the classic bullish engulfing is the primary formation, variations and related types of engulfing candlestick can influence interpretation and trading strategy. The key types include:
There are two principal engulfing candlestick patterns that traders watch for:
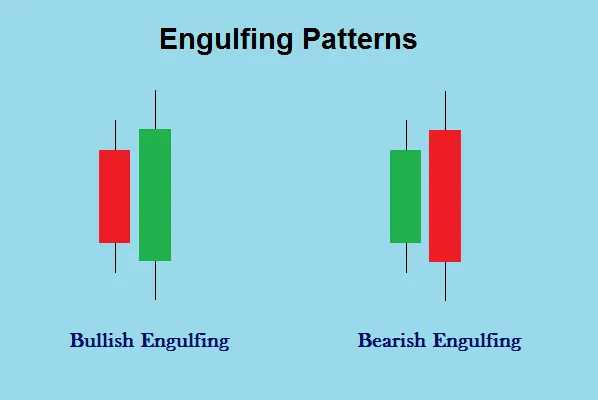
Bullish Engulfing Pattern: Occurs at the bottom of a downtrend; the second candle is green/white, engulfing the previous red/black candle, signaling a likely reversal upward.
Bearish Engulfing Pattern: Occurs at the top of an uptrend (for contrast), where a large red/black candle engulfs a smaller green/white candle, hinting at a reversal downward.
Other subtypes and contexts:
Full Body Engulfing: The real body of the bullish candle fully covers the prior bearish body (no overlap of wicks necessary).
Partial Engulfing: The bullish candle’s body covers at least the previous candle’s real body, even if wicks protrude.
Volume-Supported Engulfing: When the pattern comes with a notable surge in trading volume, further validating the bullish sentiment.
Traders use the bullish engulfing candle as a potential buy signal, generally implementing the following approach:
The bullish engulfing candlestick suggests shifting momentum in favor of buyers, often used as a key signal in reversal trading , but prudent trade execution involves multiple considerations:
Entry: Traders usually look for confirmation by entering a long position above the high of the engulfing candle. This ensures that the reversal is supported by continued buying pressure.
Exit: Exits may be preset based on risk tolerance using nearby resistance levels, recent swing highs, or technical indicators (like moving averages), especially when an F&O ban is in effect.
Stop-loss Placement: Protective stop-loss orders are commonly placed just below the engulfing candle’s low, minimizing risk if the pattern fails.
Market Context: The reliability improves if the pattern appears after an extended decline, near strong support zones, or when oversold technical readings are present.
Supplementary Tools: Additional confirmation from indicators such as RSI, MACD, or trendlines helps to avoid false signals and increases probability of success.
Volume Analysis: Patterns backed by a spike in trading volume signify greater conviction and are more trustworthy.
Risk Management: Never rely solely on a single pattern; always use prudent position sizing, stop-losses, and clear risk-reward targets.
Engulfing patterns are best used as part of a holistic trading strategy combining technical signals, market context, and strong discipline.Remember, while this pattern is highly reliable, it’s important to use proper risk management techniques and avoid over-relying on a single signal.
Understanding the contrast between bullish engulfing and bearish engulfing is vital for traders, as each signals a potential reversal in opposite market directions. Here’s a tabular overview highlighting the key distinctions:
Parameter | Bullish Engulfing | Bearish Engulfing |
Formation | Small bearish candle, followed by a large bullish candle that engulfs the previous body | Small bullish candle, followed by a large bearish candle that engulfs the previous body |
Trend Context | Appears after downtrend; signals reversal upward strike | Appears after uptrend; signals reversal downward |
Candle Color | 1st: red/black; 2nd: green/white | 1st: green/white; 2nd: red/black |
Market Sentiment | Buyers overpower sellers; bullish momentum builds | Sellers overpower buyers; bearish momentum builds |
Trader Action | Consider buying; close shorts; enter long | Consider selling; close longs; enter short |
Reliability | Strong after downtrends, especially with volume | Strong after uptrends, especially with volume |
Example | Seen before rallies or upward reversals | Seen before declines or downward reversals |
Understanding and skillfully applying the bullish engulfing pattern can significantly enhance a trader’s ability to spot short-term reversals and position accordingly. While the pattern is straightforward, its effectiveness is maximized when incorporated into a comprehensive trading plan factoring in market context, technical confluence, and disciplined risk management. By mastering both the bullish engulfing and its opposite, the bearish engulfing, traders can navigate diverse market conditions with greater confidence.
For a deeper dive into candlestick patterns and how professionals incorporate them into trading methodologies, consult widely respected sources such as government research, or financial regulatory bodies for timeless techniques and the latest research.
The bullish engulfing pattern is best used after a downward trend, especially if it forms near a support area or after a strong price drop. It can signal a change in market sentiment from bearish to bullish and is often used as a potential buying opportunity, especially if other indicators support the signal.
A bullish engulfing pattern is more reliable when confirmed by other factors: higher trading volume, support from technical indicators (like RSI or MACD), or significant support levels. However, it's not a guarantee of a reversal using it alongside other analysis methods and risk controls improves results.
Beginners should first learn chart patterns like the bullish engulfing pattern and practice in a demo account to build experience without risking real money. It's important to create a trading plan, use stop-losses for risk management, stay disciplined, and focus on learning rather than quick profits. Start with small trades and gradually scale up as your skills grow.
You can confirm an engulfing candle by looking for the next price bar to move higher and close above the high of the bullish engulfing candle. Additional confirmation comes from increased volume, support from other bullish indicators, or a strong reversal at a key support zone.
You’ll notice the pattern after a downtrend: the first candle is small and bearish, followed by a bigger bullish candle that completely covers the previous body. The signal is stronger if volume increases and the bullish candle closes near its high.
Discover investment portfolios that are designed for maximum returns at low risk.
Learn how we choose the right asset mix for your risk profile across all market conditions.
Get weekly market insights and facts right in your inbox

It depicts the actual and verifiable returns generated by the portfolios of SEBI registered entities. Live performance does not include any backtested data or claim and does not guarantee future returns.
By proceeding, you understand that investments are subjected to market risks and agree that returns shown on the platform were not used as an advertisement or promotion to influence your investment decisions.
"I was drawn to Wright Research due to its multi-factor approach. Their Balanced MFT is an excellent product."

By Prashant Sharma
CTO, Zydus
By signing up, you agree to our Terms and Privacy Policy
"I was drawn to Wright Research due to its multi-factor approach. Their Balanced MFT is an excellent product."
By Prashant Sharma
CTO, Zydus
Skip Password
By signing up, you agree to our Terms and Privacy Policy
"I was drawn to Wright Research due to its multi-factor approach. Their Balanced MFT is an excellent product."
By Prashant Sharma
CTO, Zydus
"I was drawn to Wright Research due to its multi-factor approach. Their Balanced MFT is an excellent product."
By Prashant Sharma
CTO, Zydus
Log in with Password →
By logging in, you agree to our Terms and Privacy Policy
"I was drawn to Wright Research due to its multi-factor approach. Their Balanced MFT is an excellent product."
By Prashant Sharma
CTO, Zydus
Log in with OTP →
By logging in, you agree to our Terms and Privacy Policy
"I was drawn to Wright Research due to its multi-factor approach. Their Balanced MFT is an excellent product."
By Prashant Sharma
CTO, Zydus
Answer these questions to get a personalized portfolio or skip to see trending portfolios.
Answer these questions to get a personalized portfolio or skip to see trending portfolios.
(You can choose multiple options)
Answer these questions to get a personalized portfolio or skip to see trending portfolios.
Answer these questions to get a personalized portfolio or skip to see trending portfolios.
Answer these questions to get a personalized portfolio or skip to see trending portfolios.
(You can choose multiple options)
Investor Profile Score
We've tailored Portfolio Management services for your profile.
View Recommended Portfolios Restart


