


Blog home
Newsletter
News
Video
Podcast
Reading list
Wright Brief
Sign In

All you need to know about the Multi Factor Tactical portfolio

This is a dynamic portfolio that allocates to equity smart beta factor baskets along with bonds, liquid and gold ETFs

Listen to this article
Audio · ~2 min
Add as a preferred source on Google
Tactical Asset Allocation

Free tool

See what markets are pricing in

Live indices, sector moves and market breadth — the backdrop to every story we publish.

Open Market Tracker

What is the rationale behind it?

The rationale of this strategy can be broken down into two themes:

Dynamic Asset Allocation

Let us look at the equity markets in the two recent time periods — the year 2017 and 2018.
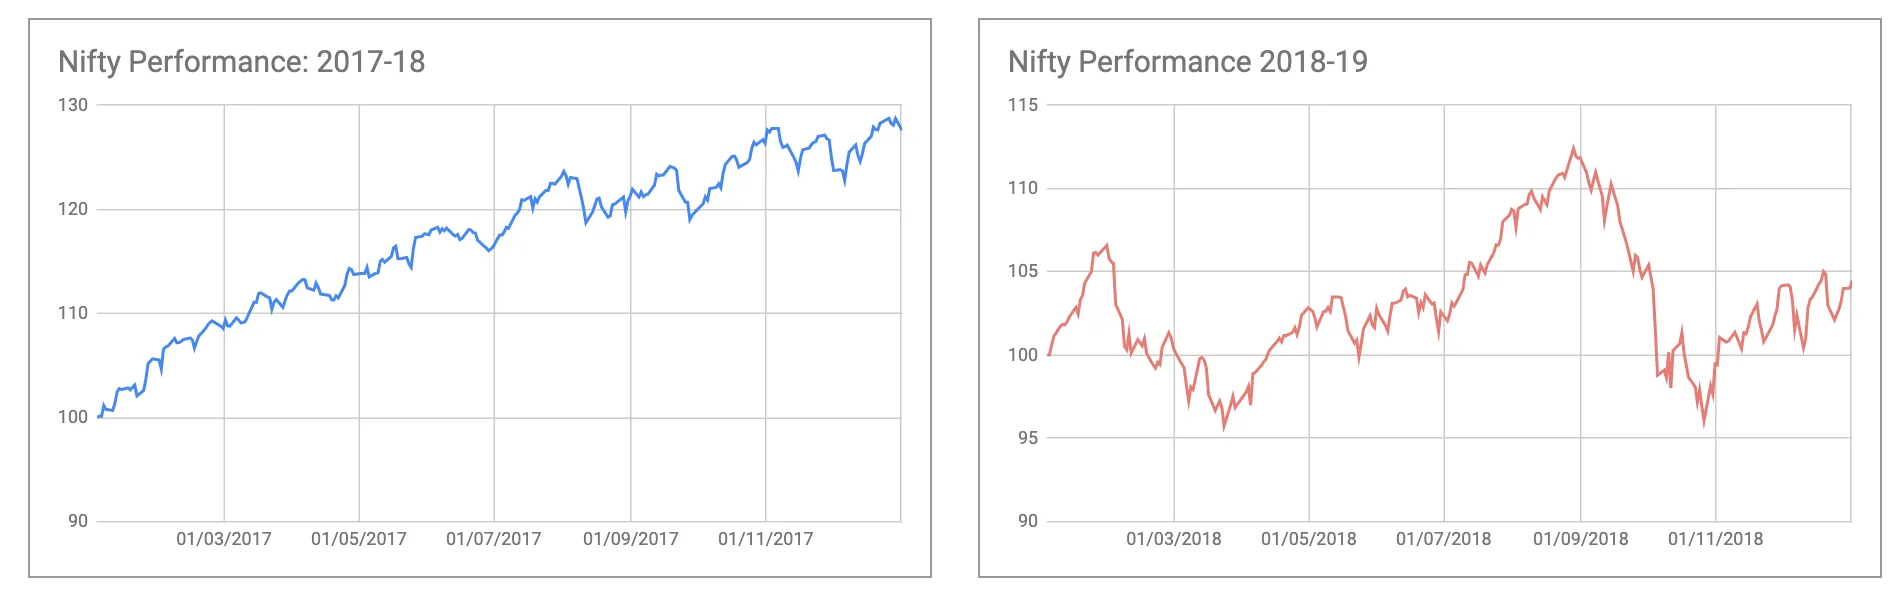
Nifty Performance 17-19

Now, look at 2 portfolios:

  • One with 80% allocation to equities and 20% to bonds
  • The other with 20% to equities and 80% to bonds
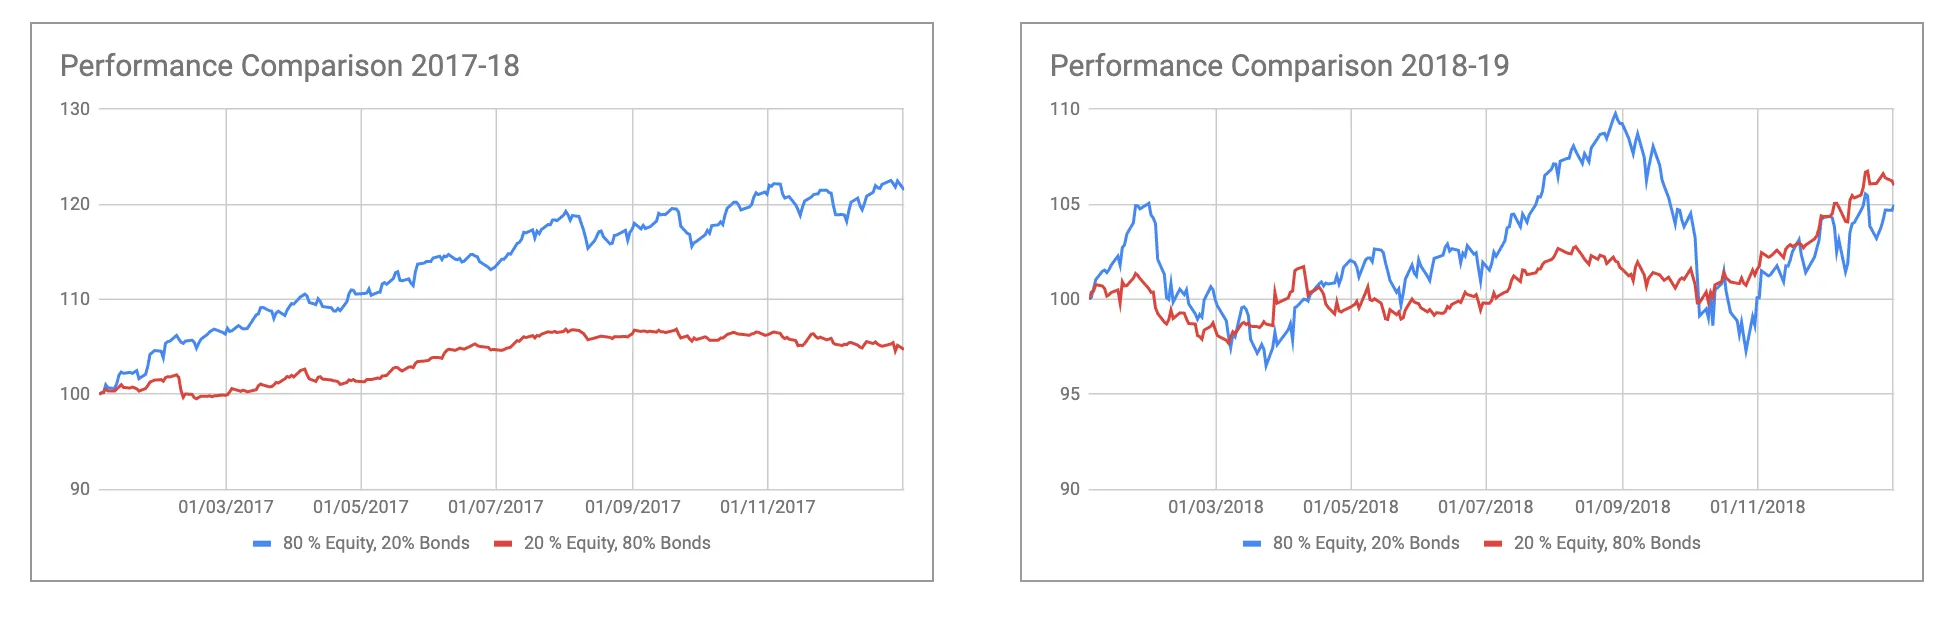
Performance comparison

The equity majority portfolio has better performance in 2017 but the bond majority portfolio gives better risk adjusted returns in 2018.

We choose the best asset mix using stocks along with bond and gold ETFs in the two different types of market regimes.

The regimes are predicted using a model that looks at short term and long term price patterns and economic data. We chase the equity market trend when the market is favourable and try to control the risk when it is not
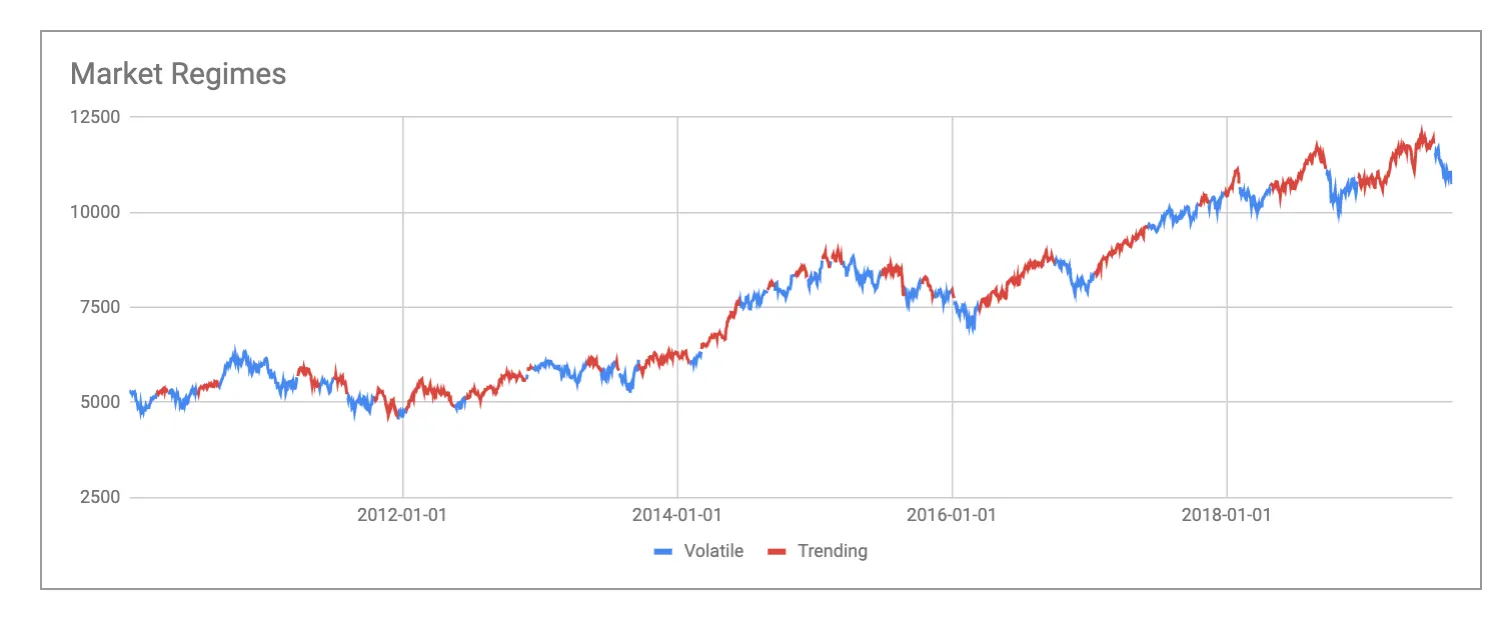
Market Regimes

Stock Selection

While we trade bonds & commodities through ETFs, the choice of stocks in the portfolio comes from equity factor models or the popular name smart-beta. The individual equity buckets chase factors like:

  • Momentum or trend following
  • Value or choosing the undervalued stocks
  • Growth or choosing high growth stocks
  • Quality or choosing the stocks with good earning quality

The Wright Brief · free weekly

Get research like this in your inbox

The week’s research that mattered, in five minutes. Joined by 2L+ investors.

How has been the performance?

We have been live for 10 months since July 2019, here’s how the performance has looked like:
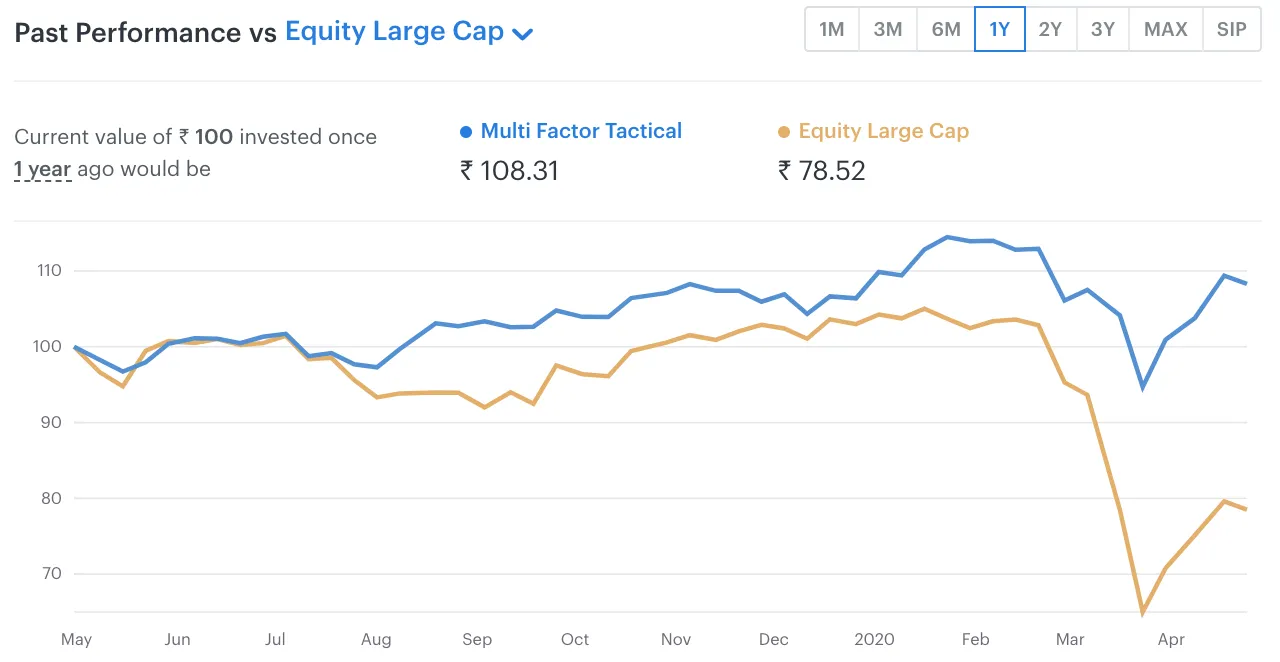
Multifactor tactical 1Y
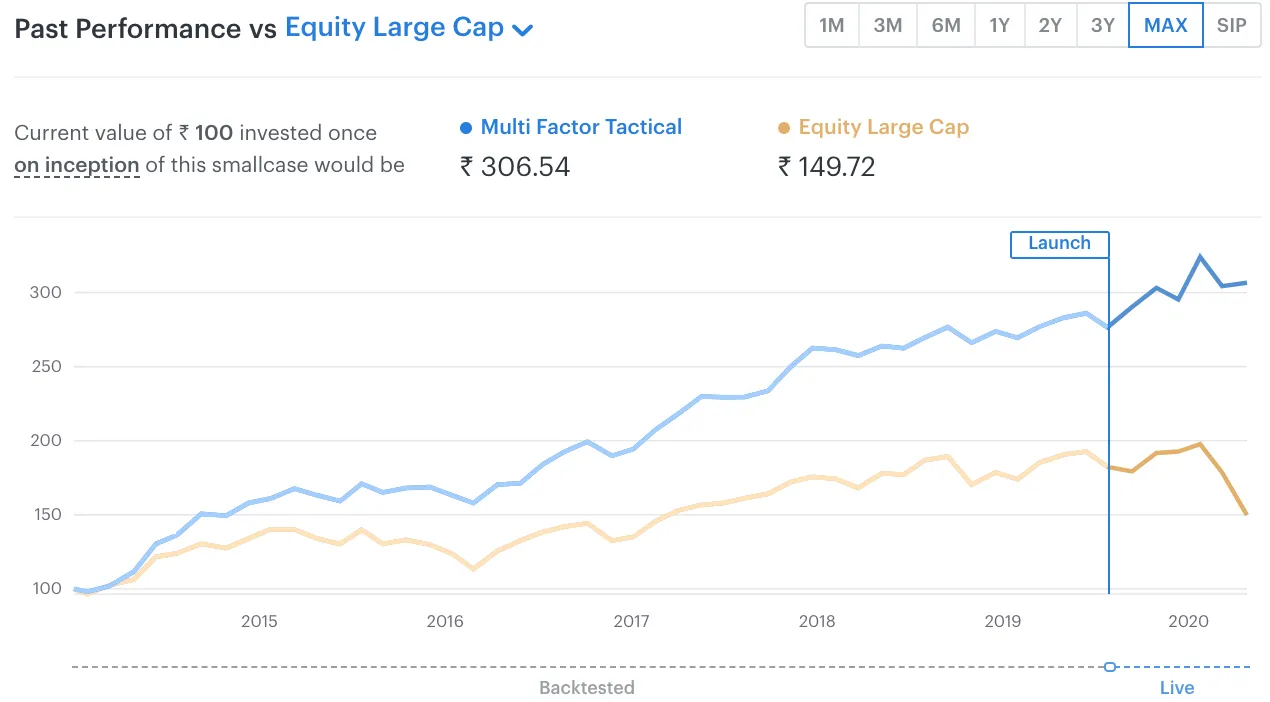
The portfolio has done well is trending times and has also suffered much lower drawdowns during the market crash in March 2020.

The backtested performance of the model since 2014 looks like this:
Past Performance Max

How does it perform during market crashes?

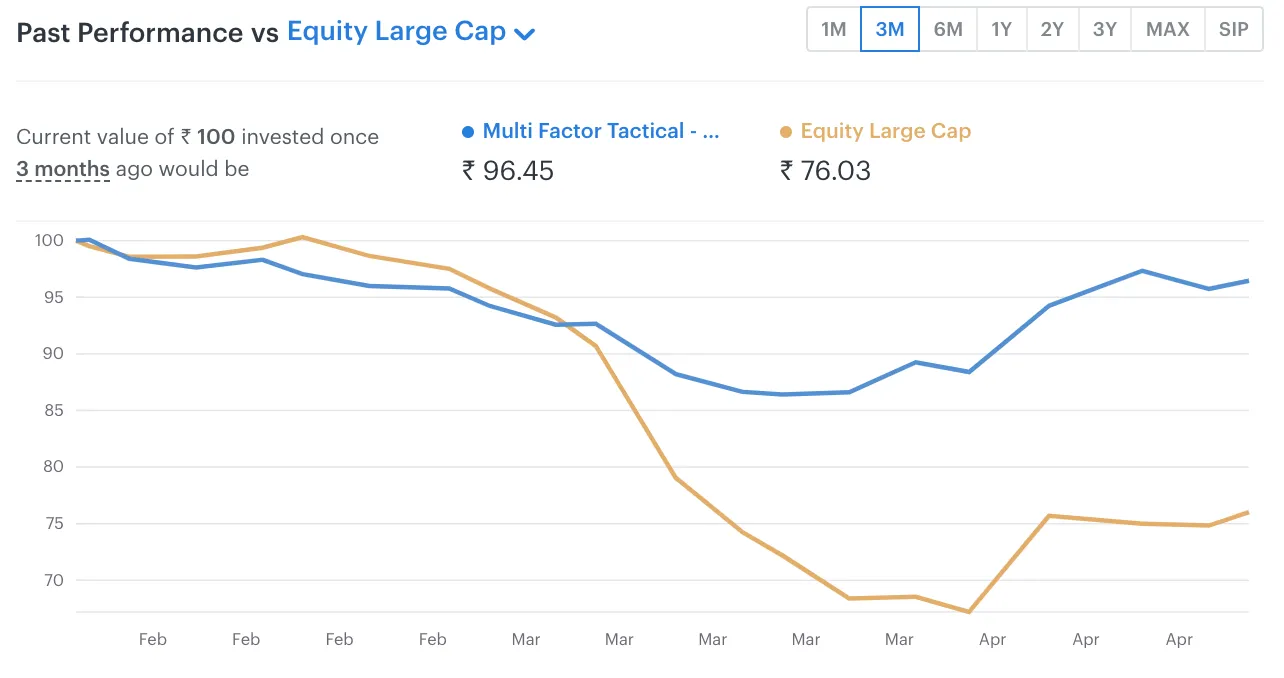
When the markets crashed in March 2020 led by coronavirus fears, our portfolios stood out based on the principles of dynamic asset allocation
Multifactor tactical 3M

While the markets suffered a drawdown of ~30% the portfolio only dropped ~5%

Free tool

Track the factors behind this research

Momentum, value, quality and low-vol — updated factor performance for Indian markets.

Open Factor Updates

How can I invest?

Indian retail investors can invest via smallcase here: https://wrightresearch.smallcase.com/

Details on the steps to invest and the plans is detailed here: https://www.wrightresearch.in/invest

Disclaimer: Investment in securities market are subject to market risks. Read all the related documents carefully before investing. Registration granted by SEBI, membership of a SEBI recognized supervisory body (if any) and certification from NISM in no way guarantee performance of the intermediary or provide any assurance of returns to investors.

The content in these posts/articles is for informational and educational purposes only and should not be construed as professional financial advice and nor to be construed as an offer to buy/sell or the solicitation of an offer to buy/sell any security or financial products. Users must make their own investment decisions based on their specific investment objective and financial position and using such independent advisors as they believe necessary.

Wryght Research & Capital Pvt (Brand name: Wright Research) is a SEBI Registered Portfolio Manager Reg No: INP000007979 (Validity: Apr 03, 2023 – Perpetual) and a SEBI Registered Research Analyst No: INH000017295 (Validity: Jul 03, 2024 – Perpetual), with its registered office at 103, Shagun Vatika Prag Narayan Road, Lucknow, UP, 226001 India and CIN: U67100UP2019PTC123244. Past performance may or may not be sustained in future. Performance provided there in is not verified by SEBI. Investment in securities is subject to market and other risks, and there is no assurance or guarantee that the objectives of any of the strategies of the Portfolio Management Services will be achieved. Registration granted by SEBI, enlistment as RA with Exchange and certification from National Institute of Securities Markets (NISM) in no way guarantee performance of the intermediary or provide any assurance of returns to investors. Please read the Disclosure document carefully before investing. Securities quoted are for illustration only and are not recommendatory. Charts shown are for illustration only. For more information and disclosures, visit our disclosures page here.

Found this useful? Share it.
Explore related topics
Sonam Srivastava
About the author
Sonam Srivastava
Founder, CEO | Wright Research, Wright Research

I am passionate about building a scalable quant business.

Wright PMS · Portfolio Management Service

Put this research to work

The same 300+ factor research engine behind this article — applied to a professionally managed portfolio, end to end.

300+
Factors tracked
2L+
Investors
₹1,200+ Cr
Invested
SEBI
Registered PMS
