by Naman Agarwal
Published On Aug. 13, 2025
Technical analysis forms the backbone of successful trading strategies, providing traders with systematic approaches to interpret market behavior and make informed decisions. Among the vast array of analytical tools available, continuation candlestick patterns stand out as essential elements for understanding market momentum and trend persistence. These patterns represent brief pauses in ongoing trends rather than complete trend reversals, offering traders valuable opportunities to enter or add to existing positions before the original trend resumes its course.
Continuation patterns are fundamental chart formations that signal temporary consolidation phases within established trends, serving as the market's way of gathering momentum for the next significant move. Unlike reversal patterns that indicate complete trend changes, continuation patterns suggest that after a brief respite, the price will resume moving in the direction of the prevailing trend. These formations occur across all timeframes and asset classes, making them universally applicable tools for traders operating in stocks, forex, commodities, and cryptocurrencies. The reliability of continuation patterns increases when they appear in the context of strong underlying trends, are confirmed by volume analysis, and align with broader market sentiment and technical indicators.
Continuation patterns represent chart formations that develop during temporary pauses in established trends, indicating that the prevailing price movement will likely resume after a brief consolidation period. These patterns emerge when market participants take profits, reassess positions, or await new catalysts while the underlying trend momentum remains intact.
The fundamental concept behind continuation patterns lies in market psychology and participant behavior. When an asset experiences a strong trending move, some traders naturally begin taking profits, while others wait for better entry opportunities or confirmation signals. This temporary balance between buying and selling pressure creates consolidation phases that manifest as recognizable chart patterns. The key distinction is that the underlying trend's driving forces remain intact, making trend resumption the most probable outcome.
Understanding the core traits that define reliable continuation candlestick patterns is crucial for successful pattern recognition and trading execution. These characteristics help traders distinguish meaningful signals from market noise and establish clear invalidation points with confidence.
The most reliable continuation patterns exhibit several distinctive features that enhance their predictive value:
Strong Prior Trend: The pattern must emerge within an established trend that has demonstrated clear momentum. Weak or unclear trends reduce pattern reliability significantly.
Volume Contraction During Formation: Trading volume typically decreases as the pattern develops, indicating reduced conviction among market participants during the consolidation phase.
Clean Pattern Structure: Well-defined boundaries and symmetrical formations provide clearer breakout signals and more reliable trading opportunities.
Appropriate Duration: Patterns should neither be too brief (lacking significance) nor too extended (suggesting trend exhaustion).
Volume Expansion on Breakout: A significant increase in trading volume when the pattern breaks confirms renewed market interest and trend continuation.
Pattern Characteristic | Reliability Indicator | Trading Implication |
Volume Behavior | Contraction during pattern, expansion on breakout | Confirms genuine consolidation and resumption |
Pattern Duration | 3-12 weeks for most patterns | Optimal timeframe for trend continuation |
Trend Strength | Clear directional move preceding pattern | Higher probability of successful breakout |
Breakout Confirmation | Close beyond pattern boundaries with volume | Reduces false breakout probability |
The following section explores the most effective continuation patterns that every trader should master, providing visual clarity and practical application insights for each formation.
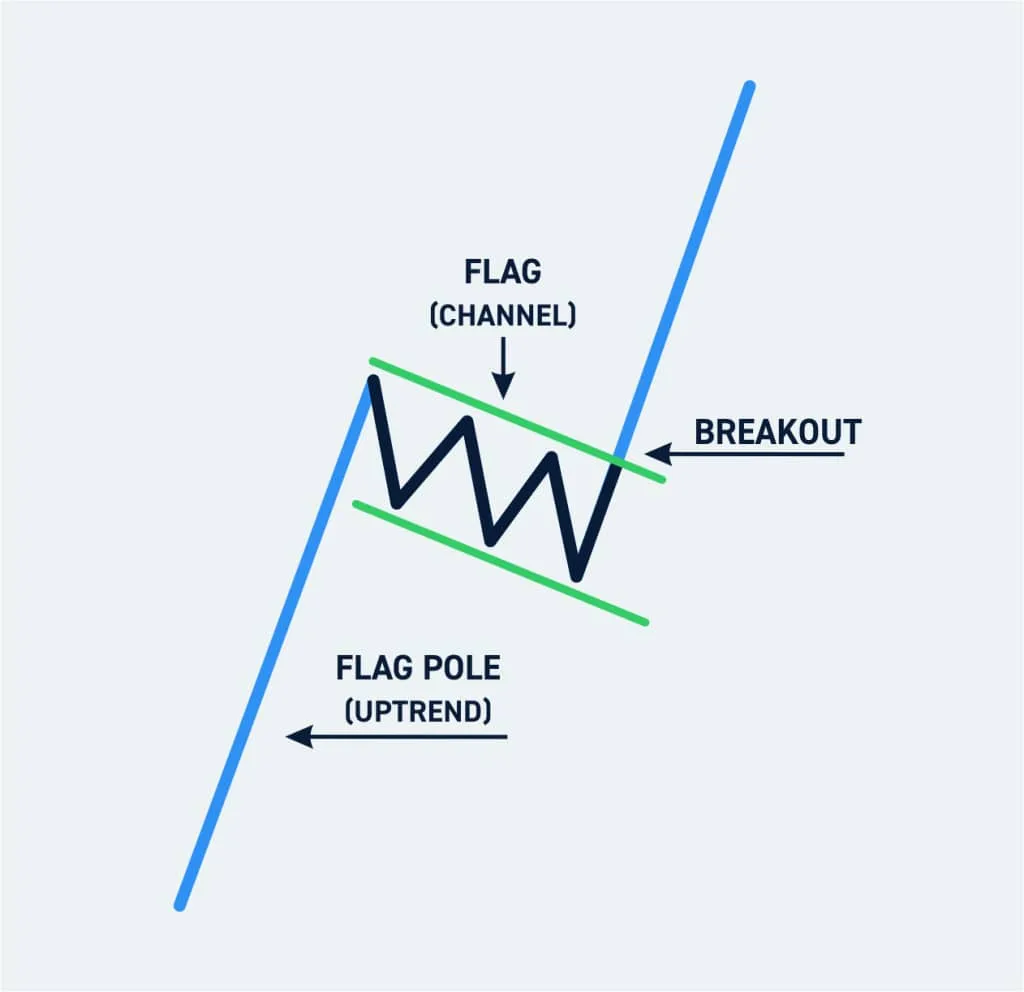
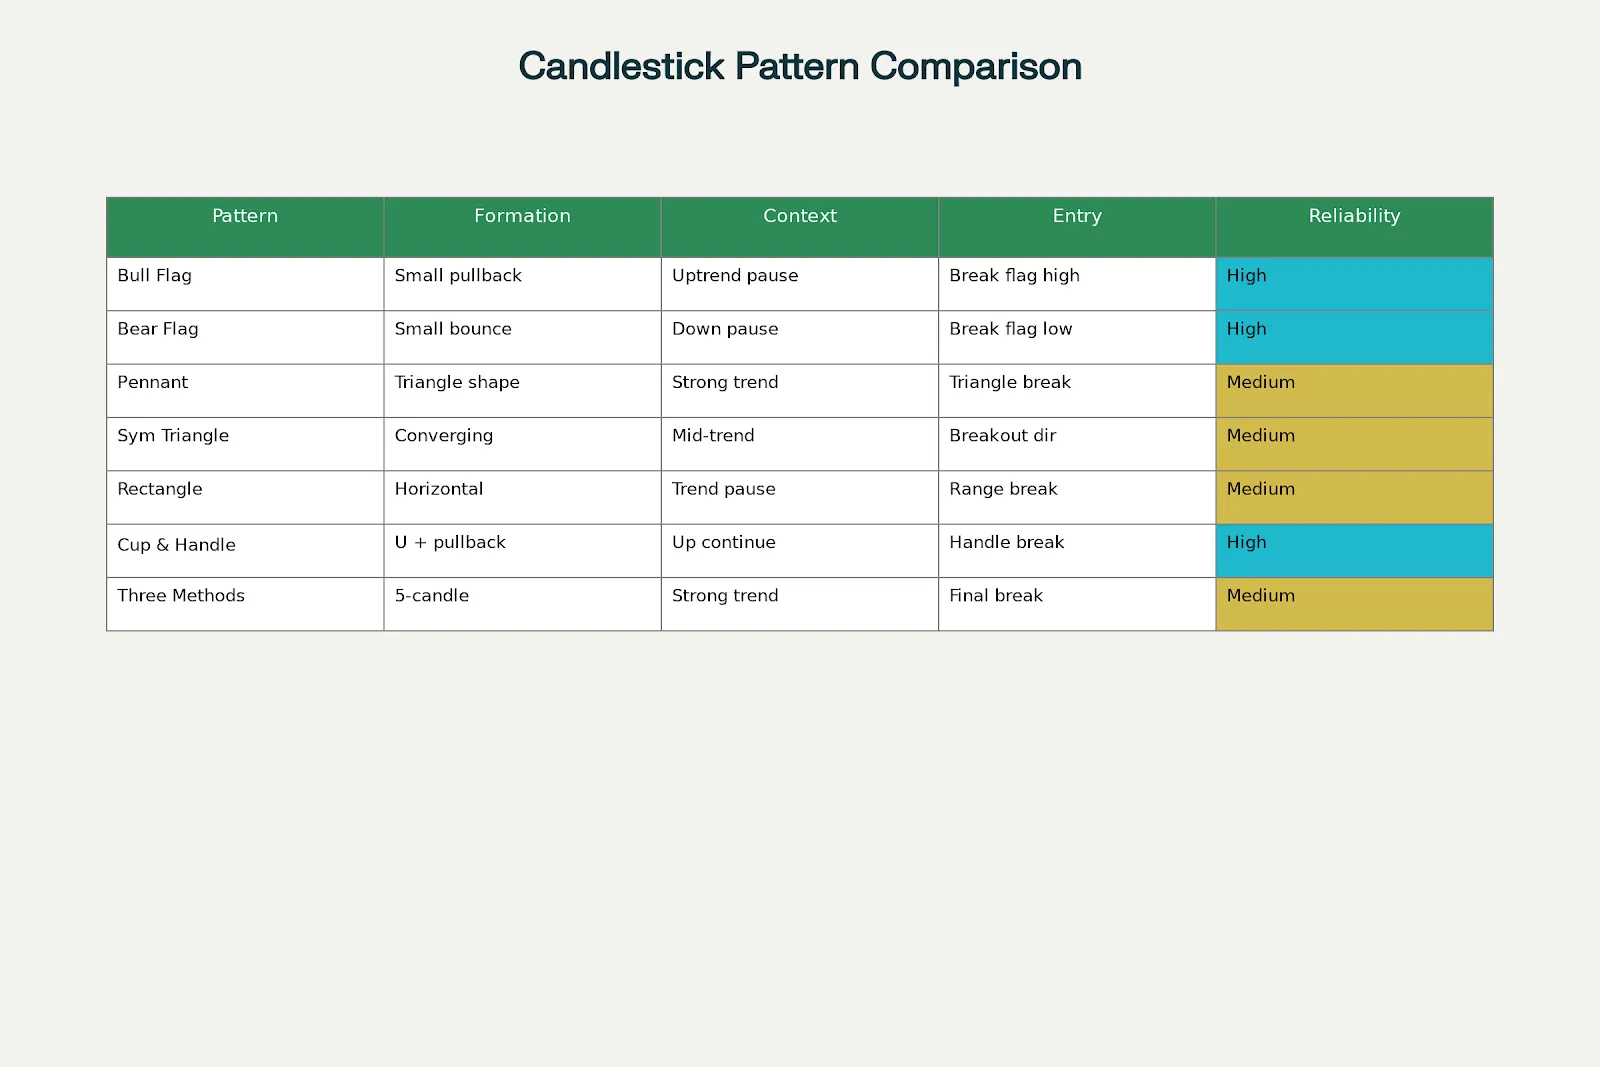
Flag patterns represent some of the most reliable continuation formations, appearing after sharp price movements known as "flagpoles." These patterns demonstrate temporary profit-taking within strong trends before momentum resumes.
Bull Flag Pattern:
Forms after a strong upward move
Characterized by a slight downward slope during consolidation
Entry signal occurs when price breaks above the upper flag boundary
Typical duration: 1-4 weeks
Bear Flag Pattern:
Develops following a sharp decline
Shows brief upward consolidation against the main trend
Entry signal triggered by a break below the lower flag boundary
Often accompanied by decreasing volume during formation
Pennant patterns closely resemble flags but form symmetrical triangles instead of rectangular consolidations. These patterns typically develop after explosive price movements and indicate brief periods of indecision before trend continuation.
Key characteristics include:
Converging trend lines forming a small triangle
Shorter duration than triangles (usually under 3 weeks)
Always preceded by a strong directional move (the flagpole)
Breakout occurs in the direction of the prior trend
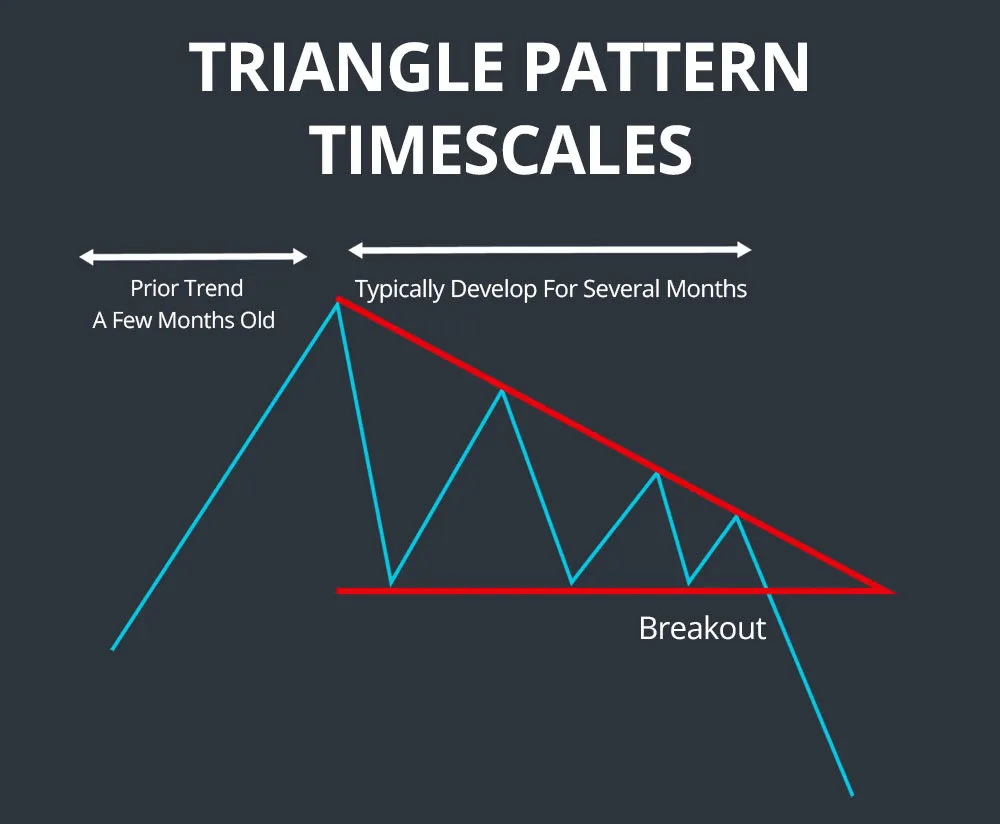
Triangle formations represent periods of price compression where trading ranges narrow progressively. These patterns can appear in various forms, each providing specific insights into market dynamics.
Symmetrical Triangles:
Feature converging trend lines with decreasing highs and increasing lows
Typically continue in the direction of the preceding trend
Require at least five touches of support and resistance for validity
Ascending Triangles:
Characterized by horizontal resistance and rising support
Generally bullish continuation patterns
Break higher in approximately 60-70% of cases
Descending Triangles:
Show horizontal support with declining resistance
Usually bearish continuation signals
Break lower in the majority of instances
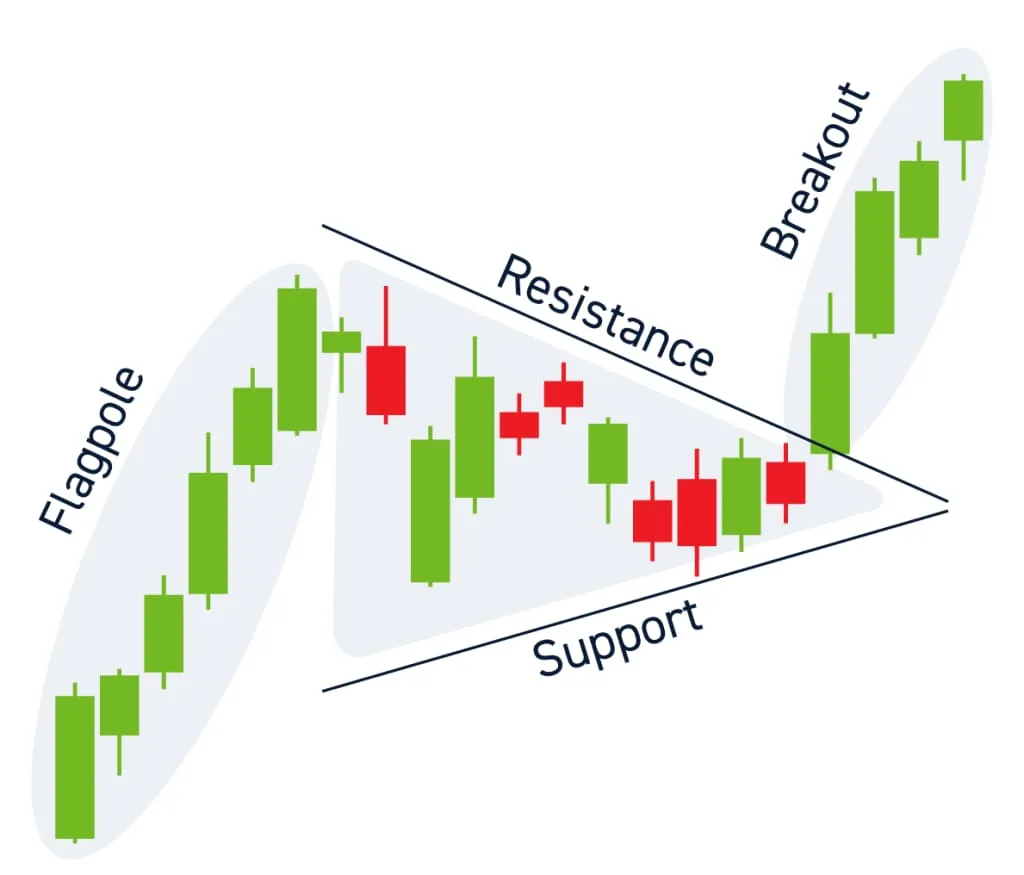
Rectangle patterns form when prices oscillate between clearly defined horizontal support and resistance levels, creating a sideways trading range during trend pauses.
Essential features include:
Parallel horizontal boundaries
Multiple touches of both support and resistance
Volume typically decreases during formation
Breakout direction usually aligns with prior trend
Rectangle pattern trading strategy guide illustrating types of rectangle patterns and four key trading strategies with annotated charts synapsetrading
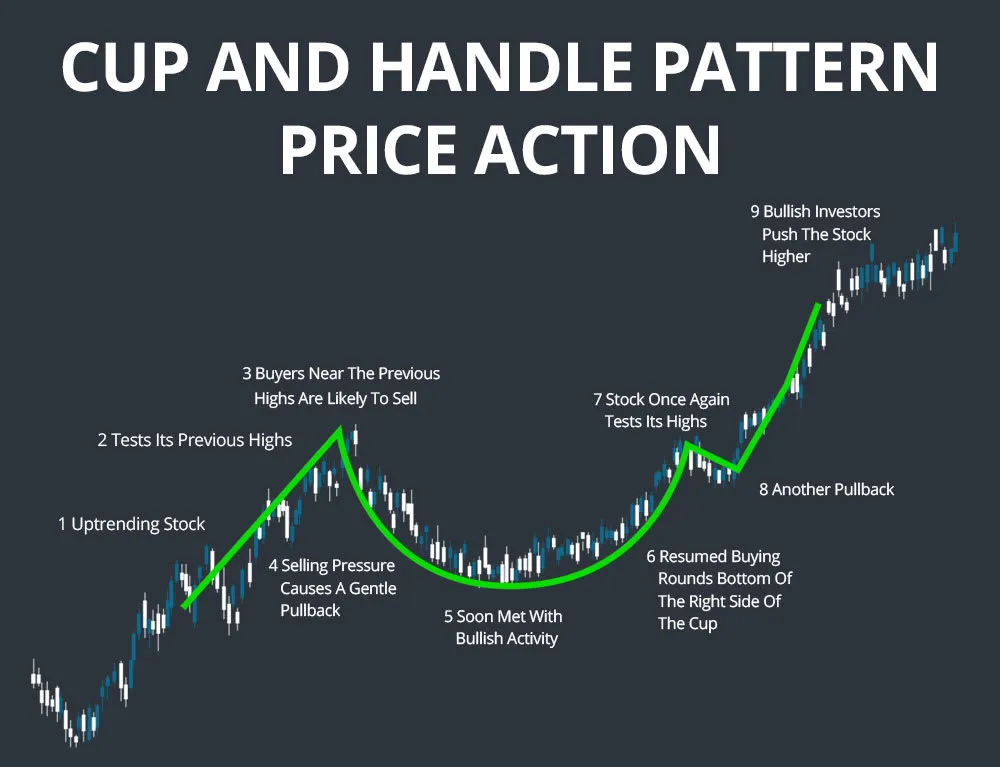
The cup and handle formation represents one of the most powerful bullish continuation patterns, popularized by William O'Neil and widely recognized for its reliability in trending markets.
Pattern characteristics:
"U"-shaped consolidation (the cup) following an uptrend
Brief pullback forming the handle
Handle should retrace no more than 50% of the cup's advance
Ideal duration: 7 weeks to 65 weeks for complete formation
This five-candlestick pattern appears in uptrends and demonstrates temporary selling pressure that fails to overcome bullish momentum. The formation consists of a long bullish candle, three smaller bearish candles, and a final bullish candle that closes above the initial candle's high.
Rising three methods is a bullish continuation candlestick pattern that occurs in an uptrend and whose conclusion sees a resumption of that trend. This can be contrasted with a falling three method.
The decisive (fifth) strongly bullish candle is proof that sellers did not have enough conviction to reverse the prior uptrend and that buyers have regained control of the market.
The bearish counterpart to rising three methods, this pattern occurs in downtrends and shows brief buying pressure that cannot sustain against selling momentum. It features a long bearish candle, three smaller bullish candles, and a concluding bearish candle that closes below the initial candle's low.
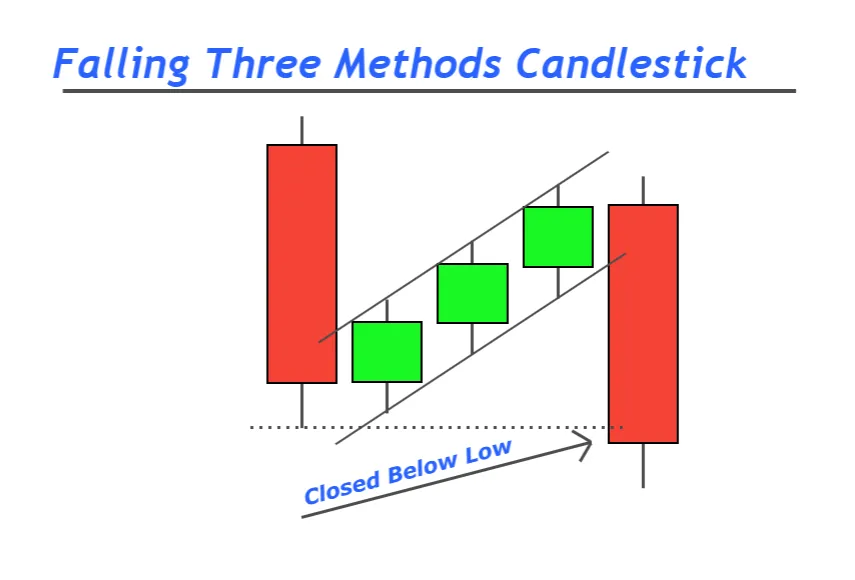
This pattern indicates that the short-term price increase (the three bullish candles) is just a temporary pause in the overall downward trend.
Successfully trading continuation patterns requires a systematic approach that combines pattern recognition with proper risk management and market context analysis. Professional traders employ specific strategies to maximize the probability of successful trades while minimizing potential losses.
The trading process typically follows these key steps:
Pre-Entry Analysis:
Confirm the presence of a strong prior trend
Verify pattern structure meets standard criteria
Assess volume behavior during pattern formation
Check alignment with broader market conditions
Entry Strategies:
Breakout Method: Enter positions when price closes beyond pattern boundaries with increased volume
Retest Method: Wait for price to retest the breakout level before entering
Anticipation Method: Enter during pattern formation (higher risk but better reward potential)
Risk Management:
Place stop-loss orders just outside pattern boundaries
Use position sizing based on account risk tolerance (typically 1-2% per trade)
Set profit targets using pattern height projections
Consider trailing stops to protect profits as trends develop
Understanding the fundamental distinctions between continuation patterns and reversal patterns is essential for proper pattern classification and trading strategy selection. These differences affect entry timing, risk management, and profit expectations.
Aspect | Continuation Patterns | Reversal Patterns |
Purpose | Signal trend resumption after pause | Indicate complete trend change |
Market Context | Appear mid-trend during consolidation | Form at trend extremes |
Volume Behavior | Decreases during formation, spikes on breakout | Often shows climax volume at completion |
Duration | Generally shorter (weeks to months) | Typically longer formation periods |
Success Rate | Higher probability (60-70%) | Lower probability (40-50%) |
Trading Approach | Follow existing trend direction | Trade against previous trend |
Risk Level | Moderate (trend-following) | Higher (counter-trend) |
Successful pattern trading requires awareness of common pitfalls and implementation of proven risk mitigation strategies. Even experienced traders can fall victim to pattern failures without proper preparation and discipline.
Volume Analysis Best Practices:
Never ignore volume behavior during pattern formation and breakouts
Look for at least 50% increase in volume on breakout confirmation
Be wary of breakouts occurring on declining volume
Consider volume-weighted average price (VWAP) for additional confirmation
Market Context Considerations:
Avoid trading patterns during major news events or earnings announcements
Consider broader market sentiment and sector performance
Check correlation with related assets and market indices
Be aware of seasonal patterns and market cycles
Technical Confirmation Strategies:
Use multiple timeframe analysis to confirm pattern validity
Combine patterns with momentum indicators (RSI, MACD)
Check for support/resistance confluence at key pattern levels
Monitor moving average alignment for trend confirmation
Risk Management Protocols:
Never risk more than 1-2% of account equity on a single pattern trade
Use proper position sizing based on stop-loss distance
Implement trailing stops to protect profits during trend continuation
Maintain detailed trading journals to track pattern performance
Mastering continuation candlestick patterns provides traders with a significant edge in navigating market trends and identifying high-probability trading opportunities. These seven patterns, bull/bear flags, pennants, triangles, rectangles, cup and handle, and three method formations represent some of the most reliable tools in technical analysis for trend continuation trading.
The key to successful pattern trading lies in understanding that these formations reflect temporary pauses in ongoing trends rather than complete reversals. By focusing on proper pattern identification, volume confirmation, market context analysis, and disciplined risk management, traders can significantly improve their success rates and overall profitability.
Remember that no pattern guarantees success, and market conditions can change rapidly. Continuous education, practice with historical data, and careful position sizing remain essential elements of sustainable trading success. For additional research on technical analysis and pattern recognition, consult resources from established financial institutions such as the U.S. Securities and Exchange Commission or academic studies published in financial journals to deepen your understanding of market behavior and pattern reliability.
As you develop your skills in recognizing and trading these patterns, maintain a disciplined approach to risk management and always consider the broader market context. With proper application and experience, continuation patterns can become powerful tools in your trading arsenal, helping you capitalize on trend persistence while managing downside risk effectively.
Discover investment portfolios that are designed for maximum returns at low risk.
Learn how we choose the right asset mix for your risk profile across all market conditions.
Get weekly market insights and facts right in your inbox

It depicts the actual and verifiable returns generated by the portfolios of SEBI registered entities. Live performance does not include any backtested data or claim and does not guarantee future returns.
By proceeding, you understand that investments are subjected to market risks and agree that returns shown on the platform were not used as an advertisement or promotion to influence your investment decisions.
"I was drawn to Wright Research due to its multi-factor approach. Their Balanced MFT is an excellent product."

By Prashant Sharma
CTO, Zydus
By signing up, you agree to our Terms and Privacy Policy
"I was drawn to Wright Research due to its multi-factor approach. Their Balanced MFT is an excellent product."
By Prashant Sharma
CTO, Zydus
Skip Password
By signing up, you agree to our Terms and Privacy Policy
"I was drawn to Wright Research due to its multi-factor approach. Their Balanced MFT is an excellent product."
By Prashant Sharma
CTO, Zydus
"I was drawn to Wright Research due to its multi-factor approach. Their Balanced MFT is an excellent product."
By Prashant Sharma
CTO, Zydus
Log in with Password →
By logging in, you agree to our Terms and Privacy Policy
"I was drawn to Wright Research due to its multi-factor approach. Their Balanced MFT is an excellent product."
By Prashant Sharma
CTO, Zydus
Log in with OTP →
By logging in, you agree to our Terms and Privacy Policy
"I was drawn to Wright Research due to its multi-factor approach. Their Balanced MFT is an excellent product."
By Prashant Sharma
CTO, Zydus
Answer these questions to get a personalized portfolio or skip to see trending portfolios.
Answer these questions to get a personalized portfolio or skip to see trending portfolios.
(You can choose multiple options)
Answer these questions to get a personalized portfolio or skip to see trending portfolios.
Answer these questions to get a personalized portfolio or skip to see trending portfolios.
Answer these questions to get a personalized portfolio or skip to see trending portfolios.
(You can choose multiple options)
Investor Profile Score
We've tailored Portfolio Management services for your profile.
View Recommended Portfolios Restart


